

Abstract
Alternative splicing contributes to cell type-specific transcriptomes. Here, we show that changes in intragenic chromatin marks affect NCAM (neural cell adhesion molecule) exon 18 (E18) alternative splicing during neuronal differentiation. An increase in the repressive marks H3K9me2 and H3K27me3 along the gene body correlated with inhibition of polymerase II elongation in the E18 region, but without significantly affecting total mRNA levels. Treatment with the general DNA methylation inhibitor 5-azacytidine and BIX 01294, a specific inhibitor of H3K9 dimethylation, inhibited the differentiation-induced E18 inclusion, pointing to a role for repressive marks in sustaining NCAM splicing patterns typical of mature neurons. We demonstrate that intragenic deployment of repressive chromatin marks, induced by intronic small interfering RNAs targeting NCAM intron 18, promotes E18 inclusion in undifferentiated N2a cells, confirming the chromatin changes observed upon differentiation to be sufficient to induce alternative splicing. Combined with previous evidence that neuronal depolarization causes H3K9 acetylation and subsequent E18 skipping, our results show how two alternative epigenetic marks regulate NCAM alternative splicing and E18 levels in different cellular contexts.
Keywords: alternative splicing, chromatin, differentiation, pol II elongation
Introduction
Recent estimates using RNA-seq technologies suggest that more of 90% of the human genes undergo alternative splicing and that nearly 20 000 tissue-specific splicing isoforms can be detected even from a limited set of tissues (Pan et al, 2008; Wang et al, 2008). Alternative splicing is not only the most important source of proteome expansion but also greatly contributes to tissue- and species-specific protein patterns in metazoans (Barbosa-Morais et al, 2012; Ellis et al, 2012). As other RNA processing steps, pre-mRNA splicing is mostly co-transcriptional (Tilgner et al, 2012), allowing for a mechanistical interaction between the transcription and splicing machineries (Neugebauer, 2002; Bentley, 2005; Perales and Bentley, 2009; Kornblihtt et al, 2013). This functional coupling has important consequences for alternative splicing events, since changes in the quality of the RNA polymerase II (pol II) complex can impact alternative splicing regulation, either by differential recruitment of splicing factors through the pol II protein complex (recruitment model) or by modulation of pol II elongation properties that affect the timing in which important RNA sequences are presented to the splicing machinery (kinetic model) (de la Mata et al, 2003; de la Mata and Kornblihtt, 2006; Kornblihtt, 2007).
Since chromatin is the actual template of transcription and is implicated in its regulation, it was expected that functional links would exist between chromatin structure and pre-mRNA processing (Luco et al, 2011). Early reports with viral and plasmidic systems (Adami and Babiss, 1991; Kadener et al, 2001) and more recent ones on endogenous genes (Alló et al, 2009; Batsché et al, 2006; Schor et al, 2009) show that indeed closed intragenic chromatin conformations favour inclusion of weak alternative exons, probably by aiding pol II in pausing for more efficient co-transcriptional exon recognition by the splicing machinery (Kornblihtt, 2006; Alló et al, 2010). This is also supported by genome-wide nucleosome positioning studies that uncovered a preferential positioning in exons that was even more pronounced for weak exons or exons flanked by long introns (Andersson et al, 2009; Schwartz et al, 2009; Spies et al, 2009; Tilgner et al, 2009). These observations support a functional role of intragenic nucleosomes as ‘speed bumps’ for pol II (Spies et al, 2009). Pausing of pol II at exons was confirmed by a recent genome-wide nuclear run-on experiment with single-nucleotide resolution, which also shows that inefficiently included exons are associated with less pausing (Kwak et al, 2013). Evidence from budding yeast strongly argues that pausing of pol II contributes to co-transcriptional splicing (Carrillo Oesterreich et al, 2010) and, at the same time, the splicing process favours pausing (Alexander et al, 2010). In addition to changes in the elongation properties, chromatin marks can assist both constitutive and alternative splicing by recruitment of splicing factors to transcription sites through adaptor proteins (Sims et al, 2007; Luco et al, 2010).
How can intragenic chromatin be a player in alternative splicing regulation? A first scenario involves fast and reversible modification of chromatin structures of certain genes in response to a given stimulus. This is exemplified by the regulation of exon 18 (E18) of the NCAM (neural cell adhesion molecule) gene in response to depolarization of membrane potential in neuronal cells, where an increase in histone H3 acetylation and chromatin relaxation in the distal region of the NCAM gene favours a decrease in the inclusion of E18 in the mature mRNA (Schor et al, 2009). In a different example, activation of the PKC pathways leads to increased binding of the heterochromatin protein HP1γ to the chromatin regions corresponding to a tandem of alternative exons in the CD44 gene, which helps pol II pausing, leading to higher inclusion levels (Saint-André et al, 2011). Further investigation of this phenomenon revealed a role of Ago1 and Ago2 proteins, recruited in an HP1γ-dependent manner (Ameyar-Zazoua et al, 2012). Another important example is the participation of the H3K36me3 histone mark in the PTB-dependent modulation of FGFR2 alternative splicing between epithelial and mesenchymal cells (Luco et al, 2010). These dynamic and cell type-specific relationships between chromatin and alternative splicing prompted us to investigate the problem in a differentiation model.
Neuronal cells make a widespread use of alternative splicing to increase and regulate their proteomic diversity, with many alternative events specific to neural cell types (Fagnani et al, 2007). Also, many neurological diseases are associated with defective splicing (Licatalosi and Darnell, 2006). NCAM is a membrane-bound protein that mediates cell-to-cell interactions in neurons and other cell types, and has three major isoforms, namely NCAM 120, 140 and 180 (Cunningham et al, 1987). NCAM 140 and 180 are integral membrane proteins differing in a cytosolic domain encoded by the alternatively spliced E18 of 801 bp. While NCAM 140 is more abundant in neuronal precursors and favours neurite growth, NCAM 180 is specific of mature neurons and is enriched in cell-to-cell contacts, where it contributes to organize stable and mature synapses (Persohn and Schachner, 1990; Doherty et al, 1992; Sytnyk et al, 2002; Buttner et al, 2004; Polo-Parada et al, 2004; Sytnyk et al, 2006). Our recent results showing that NCAM E18 is sensitive to chromatin structure and pol II elongation rate (Schor et al, 2009) make the study of this splicing event in neuronal differentiation a suitable system to assess the influence of chromatin in alternative splicing regulation.
Here we show that the upregulation of NCAM E18 inclusion into mature mRNA observed after differentiation of mouse N2a neural cells in culture is regulated by the acquisition of the histone heterochromatin marks H3K9me2 and H3K27me3 along the NCAM gene body, but not at the NCAM promoter, with a concomitant reduction in RNA pol II elongation at different regions of the NCAM gene, including E18. We demonstrate that the change in E18 splicing is reverted by treatments with drugs that promote chromatin relaxation, with a specific inhibitor of H3K9 methylation and by knockdown of HP1α. Most importantly, we show that intragenic deployment of repressive marks induced by an intronic small interfering RNA (siRNA) targeting NCAM intron 18 is sufficient to observe upregulation of E18 inclusion in undifferentiated N2a cells, confirming that the chromatin changes observed upon differentiation are causative of the splicing effect.
Results
NCAM E18 is sensitive to chromatin modulation in differentiated N2a cells
Since neuronal differentiation is associated with higher inclusion levels of NCAM E18 and this inclusion correlates negatively with permissive chromatin and high transcriptional elongation rates (Schor et al, 2009), we hypothesized that upon differentiation repressive chromatin marks could be deployed to promote higher NCAM E18 inclusion levels, characteristic of mature neurons. As previously described (Tacke and Goridis, 1991), incubation of N2a neuroblastoma cells in a medium with low serum and high dimethyl-sulphoxide (DMSO) concentration induces differentiation to neuron-like cells with a concomitant upregulation of E18 inclusion (Figure 1A). As previously reported (Schor et al, 2009), treatment with the histone deacetylase inhibitor trichostatin A (TSA) induces a decrease in E18 inclusion in undifferentiated N2a cells (Figure 1B, lanes 1 and 2). A similar effect is observed here in differentiated N2a cells (lanes 3 and 4). In order to investigate if similar effects are seen in a different neuronal differentiation system, we used the embryonic carcinoma P19 cell line. The differentiation pathway of mouse P19 cells occurs in two steps. First cells are grouped in embryoid bodies (EBs) whose disaggregation and replating leads to differentiated neurons in culture. Figure 1C shows that E18 inclusion increases from undifferentiated cells (lane 1) to EBs (lane 3) and from EBs to differentiated neurons (lanes 5 and 7), proportionally to the time after differentiation. Similarly to the behaviour of N2a cells, this effect is partially reverted by the chromatin relaxation agent TSA starting from EBs (lanes 4, 6 and 8), but, differently from the neuroblastoma cells, in the fully undifferentiated state E18 inclusion is not responsive to TSA treatment (lane 2).
Figure 1.

Differential response of NCAM exon 18 alternative splicing to chromatin-relaxing agents in undifferentiated and differentiated N2a cells. (A) Increase in NCAM E18 inclusion after differentiation of N2a cells assessed by radioactive semi-quantitative RT–PCR or real-time quantitative RT–PCR. Responsiveness of N2a cells (B) and P19 cells (C) to trichostatin A (TSA) in different differentiation stages. For P19 cells, after formation of EBs, the cells are resuspended, and plated in neuronal differentiation medium for the indicated times. Cells were treated with 5 ng/μl TSA for 16 h. (D) Responsiveness of N2a cells to 5-azacytidine (5aC). The indicated cells were treated with 5 μM 5aC for three days. All values are expressed as mean+s.d., relativized to values of control undifferentiated cells. P values correspond to two-tailed Student’s t test (n=3 in all cases).
E18 inclusion in N2a cells is also downregulated by the transcription-promoting drug 5-azacytidine (5aC) (Ferraro and Lavia, 1983; Ginder et al, 1984; Chiu and Blau, 1985) in differentiated cells (Figure 1D, lanes 3 and 4), but the drug has no effect in undifferentiated cells (lanes 1 and 2). Although unlikely, since the drug treatment is applied after 4–5 days of differentiation, we show that 5aC does not revert the differentiation process itself, by analysing markers associated with differentiated neurons, such as Tau or neurofilament proteins, which are not downregulated in 5aC-treated cells (Supplementary Figure S1). We also did not find evidence for an indirect effect of 5aC on E18 inclusion through changes in the mRNA abundance of the splicing factors controlling E18 splicing. Experiments with a NCAM E18 minigene show that E18 inclusion is mainly upregulated by the splicing factor SRSF3 and downregulated by SRSF5 or hnRNPA1, (Supplementary Figure S2A). Treatments with 5aC and TSA, the two drugs that revert the E18 upregulation that takes place upon differentiation, failed to change the expression levels of the above-mentioned splicing factors, which could account for the observed changes in E18 splicing patterns (Supplementary Figure S2B). Altogether these experiments suggest that a chromatin change upon differentiation may contribute to the increase in E18 inclusion. The NCAM gene has three additional alternative splicing regions placed upstream of E18, two of which, known as VASE and MSD1, are not coupled to alternative polyadenylation (Reyes et al, 1991). While the VASE event is not affected by differentiation (Supplementary Figure S3A), the MSD1 event displays a significant change upon differentiation that is reverted by treatments with TSA and 5aC (Supplementary Figure S3B). These results suggest that both the MSD1 and E18 alternative splicing events are modulated by chromatin structure during differentiation, while chromatin may be unable to modulate splicing patterns when complete inclusion or exclusion is seen, as in the case of the VASE alternative splicing observed here.
These results prompted us to investigate whether, upon differentiation, repressive chromatin marks are deployed on the NCAM gene, reinforcing the prevalence of deacetylated histones at distal intragenic regions in undifferentiated N2a cells (Schor et al, 2009).
Repressive chromatin marks along the NCAM gene body upon differentiation
5aC can induce a more permissive chromatin structure through different mechanisms, among which inhibition of DNA methylation was the first characterized and is the best understood (Creusot et al, 1982). However, 5aC is not expected to cause DNA de-methylation in non-dividing cells. Consistently, bisulphite sequencing confirmed that the CpGs at the NCAM gene region involved in E18 alternative splicing remain fully methylated in both non-differentiated and differentiated N2a cells (Figure 2A). This rules out a role for DNA methylation in the regulation of E18 splicing upon differentiation. A number of reports have documented cases where genes that are not methylated become activated in response to inhibitors of DNA methylation such as 5aC or 5-aza-2-deoxymethylcytosine (Soengas et al, 2001; Zhu et al, 2001; Scott et al, 2006). In fact, 5-aza-2-deoxymethylcytosine is known to inhibit H3K9 methylation by decreasing the levels of the histone methyltransferase G9a (Wozniak et al, 2007). We investigated the hypothesis that the chromatin changes triggered by differentiation involve repressing histone methylation. Undifferentiated N2a cells show low basal levels of repressive H3K9 and H3K27 methylation throughout the NCAM gene (Schor et al, 2009). Using native chromatin immunoprecipitation (nChIP) we measured H3K9 dimethylation (H3K9me2) at different regions of the NCAM gene (Figure 2B, amplicons A–I) in undifferentiated and differentiated cells, finding a general increase of this repressive mark along most of the intragenic regions tested (Figure 2C, left). As controls, increases in H3K9me2 levels were observed neither in an intergenic region located 10.6 kbp upstream of the NCAM gene (Figure 2C, centre), nor in the housekeeping gene HPRT (Figure 2C, right).
Figure 2.

Differentiated N2a cells show increased repressive histone marks along the NCAM gene. (A) Results of DNA methylation analysis. Following sodium bisulphite modification, genomic DNA was PCR-amplified and 10 clones per sample were sequenced (five are shown). Black and white circles indicate methylated and unmethylated CpG sites, respectively. (B) A scheme of the NCAM gene indicating the amplicons used for nChIP (black thick lines A–J) and for elongation analysis of Figure 3 and Figure 5D (boxes α–η). (C) H3K9me2 analysis along the NCAM gene and the intergenic zone placed 10.6 kbp upstream of the promoter, using native chromatin immunoprecipitation (nChIP). As a control, the housekeeping gene HPRT is shown. Values of two independent immunoprecipitations, relativized to the mean value for HPRT exon 2, are shown for each region. (D) nChIP against H3K9me2 for undifferentiated, differentiated and 5aC-treated differentiated cells. 5aC treatment was as in Figure 1. Values of two independent immunoprecipitations, relativized to the mean value for HPRT exon 2, are shown for each region for Diff. and Diff.+5aC experiments. All values are relativized to those of HPRT exon 4. (E) Quantification of total NCAM mRNA levels. Values (means±s.d.) are expressed in relation to the housekeeping gene HSPCB, and relativized to the mean for undifferentiated cells. P value corresponds to two-tailed Student’s t test (n=3).
The increase in H3K9me2 along the NCAM gene was reverted by treatment of differentiated N2a cells with 5aC (Figure 2D) and with TSA (Supplementary Figure S4), two reagents that induce a more permissive chromatin structure through different mechanisms. Although the pattern of H3K9me2 modification, in which the whole extension of the NCAM gene is affected, differs from the reported increase in H3K9 acetylation after membrane depolarization (Schor et al, 2009), which affects only the distal part of the NCAM gene around E18, both patterns include E18. Most interestingly, the effect of TSA on H3K9 methylation (Supplementary Figure S4) shows a preferentially distal pattern, similar to that of H3K9Ac increase upon membrane depolarization. No increase in H3K9me2 is observed at the NCAM promoter (Figure 2C, amplicon A), which is consistent with the fact that no significant change in the total NCAM mRNA levels is observed after differentiation (Figure 2E).
An increase in H3K27 tri-methylation (H3K27me3) is also evidenced after differentiation at most amplicons where the increase in H3K9me2 occurs (Supplementary Figure S5A, left), pointing to a more general repressive chromatin conformation being deployed during differentiation inside the NCAM gene, which includes the alternatively spliced regions. In this case, unlike H3K9me2, H3K27me3 increases in the intergenic region in a similar fashion (Supplementary Figure S5A, right), suggesting that the NCAM gene is located within a larger block where H3K27me3 augments during differentiation. When chromatin modifications and splicing patterns were analysed in the same cells along the course of differentiation (Supplementary Figure S5B) the H3K27me3 mark increased with similar kinetics in all regions. The maximum level of H3K27me3 (4 h) preceded the maximum level of E18 inclusion (6 h) into NCAM mRNA, in agreement with the idea that the deposition of the repressive histone marks might be the cause of the neuro-specific alternative splicing pattern of this exon.
Repressive chromatin in differentiated cells is associated with slower transcriptional elongation at the NCAM E18 region
The positive correlation between repressive marks and higher E18 inclusion in differentiated cells is consistent with an effect of chromatin structure in inhibiting pol II elongation, which in turn modulates splicing choices in the E18 AS. Not only are intragenic repressive chromatin marks known to inhibit transcriptional elongation in several genes (Lorincz et al, 2004; Alló et al, 2009; Saint-André et al, 2011) but also, in the NCAM gene in particular, E18 inclusion is stimulated when transcription is driven by a slow RNA pol II mutant (Schor et al, 2009), implying that its splicing is regulated by the transcriptional elongation rate. We explored this hypothesis using a validated elongation assay based on analysing the kinetics of pre-mRNA levels after releasing undifferentiated or differentiated N2a cells from a transcriptional blockage by DRB (5,6-dichloro-1-beta-D-ribofuranosylbenzimidazole) (Singh and Padgett, 2009). Analysis of both E18 intron/exon junctions (amplicons ζ and η, Figure 3A and B) reveals significant delays in the recovery of NCAM pre-mRNA levels after the DRB wash in the differentiated N2a cells, compared to the undifferentiated cells. It should be noted that since we are analysing amplicons spanning splice junctions, the pre-mRNA levels measured are the consequence of both their recovery due to transcription and their disappearance due to splicing and/or RNA degradation.
Figure 3.

Differentiated N2a cells show slower pol II elongation than undifferentiatied cells. Analysis of transcriptional elongation in the indicated regions α (A) and β (B) of the NCAM gene using the method described in Singh and Padgett (2009)). After DRB was washed out to re-initiate transcription, samples were collected at the indicated times for quantification of the pre-mRNA levels using the amplicons depicted in Figure 2B. The values are relativized to the pre-mRNA levels of untreated cells for each experiment. Individual values are shown for each time point. The curves correspond to the mean values at each time point. (C) Analysis of the pre-mRNA level of the regions of NCAM gene depicted in Figure 2B and exon 6 of HPRT is presented as the difference between values at time points of 30 and 0 min after DRB wash-out. Values of individual independent determinations for each time point are shown.
We decided to compare the differences in pre-mRNA recovery in other regions of the NCAM gene to determine if the inhibition of elongation upon differentiation was a localized or general phenomenon. For that, we used the increase in transcription in the first 30 min after DRB release as a reference, since this time point shows the clearest difference between the cell types. Figure 3C shows that inhibition of elongation in differentiated cells is conspicuous around E18 (amplicons δ, ε, ζ and η) but not further upstream at E2-I2 (amplicon β) and I4-E5 (amplicon γ) boundaries. Surprisingly, transcriptional recovery is significantly inhibited at a region closer to the promoter spanning the E1-I1 boundary (amplicon α), which may be explained by a lag in initiation or promoter release in differentiated cells, a difference that would have no further influence on the average elongation rates in the gene body, as it is no longer significant at amplicons β and γ.
Overall, together with the increase in deposition of the repressive marks H3K9me2 and H3K27me3, these results suggest that a barrier to elongation affecting the E18 region is actually created upon differentiation. The effect is observed in the more downstream regions, while the chromatin changes affect most of the gene body. This implies either that pol II elongation at the most downstream region of the NCAM gene is more sensitive to a chromatin blockade or that other factors might act in concert with the repressive histone marks to further restrict the modulation of pol II elongation.
Chromatin modifications determine NCAM E18 splicing patterns
One of the main problems in the analysis of chromatin regulation of splicing is determining whether the multiple histone modifications found to be associated with specific alternative splicing patterns are just correlations or play a causative role. The change in NCAM E18 alternative splicing upon neuron differentiation studied here offers a good model to investigate this problem. We have shown so far that the differentiation protocol applied to N2a cells causes a morphological change (Supplementary Figure S1), an upregulation of E18 inclusion (Figure 1A) reversible by the chromatin relaxing agent TSA (Figure 1B) and by 5aC (Figure 1C), the intragenic deposition of the H3K9me2 (Figure2C) silencing mark and a reduction in pol II elongation (Figure 3). The fact that both 5aC (Figure 2D) and TSA (Supplementary Figure S4), which decrease H3K9me2, revert the effect of differentiation in upregulating E18 inclusion (Figure 1C) is an indication of a causal relationship between chromatin modification and alternative splicing outcome. However, these drugs may have other effects that are difficult to rule out. To determine whether the deployment of the H3K9me2 mark is necessary for the splicing change associated with differentiated cells, we used the drug BIX 01294 (BIX) (Kubicek et al, 2007), which is a specific inhibitor of G9a, the methyltransferase responsible for euchromatic H3K9me2. Figure 4A shows that while BIX has no effect on E18 alternative splicing in non-differentiated N2a cells, it partially reverts the upregulation of E18 inclusion in differentiated cells. The effect of BIX is even stronger for the differentiated P19 cells (Figure 4B). The partial reversion of E18 splicing pattern by BIX supports a role of H3K9 methylation in this regulation, while it also suggests that other factors (that is, different chromatin features or neuron-specific trans regulation) are also acting. H3K9 methylation can recruit repressive proteins such as the heterochromatin protein HP1α. In good agreement with the effect of BIX, knockdown of HP1α also reverts the effects of differentiation on E18 inclusion (Figure 4C).
Figure 4.
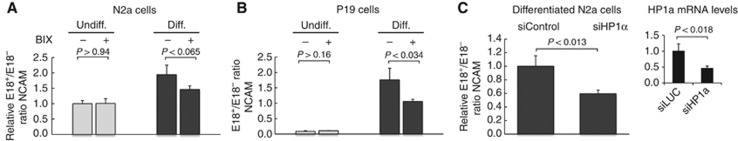
H3K9 methylation and HP1α recruitment contribute to the upregulation of E18 inclusion in differentiated cells. Responsiveness of N2a cells (A) and P19 cells (B) to treatment with BIX before and after differentiation assessed by real-time quantitative RT–PCR. Cells were treated with 1 μM BIX for 3 days. Each individual value corresponds to the mean±s.d. of three replicates. (C) Responsiveness of differentiated N2a cells to treatment with a siRNA against HP1α (siHP1α) or a siRNA control against luciferase (siControl). All values are expressed as mean±s.d., relativized to values of cells transfected with the siControl. The inset shows the steady-state mRNA levels of HP1α measured by real-time RT–PCR, showing a near 50% depletion efficiency. P values correspond to two-tailed Student’s t test (n=3).
Previous results indicate that histone methylation and heterochromatin formation are necessary for the full change in splicing upon differentiation. To prove that a chromatin change occurring only in the NCAM gene is sufficient to promote E18 inclusion, we made use of the recently described TGS-AS (transcriptional gene silencing-regulated alternative splicing) methodology (Figure 5A) (Alló et al, 2009). When targeting promoter regions, siRNAs trigger transcriptional gene silencing by promoting heterochromatin formation (Kim et al, 2006). We have shown that siRNAs targeting intronic sequences downstream of an alternative exon regulate the splicing of that exon by creating the same silencing marks observed upon N2a differentiation (H3K9me2 and H3K27me3) at the target site, which in turn act as roadblocks to pol II elongation. The effect depends on Argonaute-1 (AGO1) and HP1α and is counterbalanced by factors favouring chromatin opening or transcriptional elongation (Alló et al, 2009). Using the Stealth technology (Invitrogen) we designed a double-stranded siRNA (siI18as) targeting a region of NCAM intron 18 (Figure 5B) in such a way that the antisense strand enters the silencing complex to pair with the nascent NCAM pre-mRNA. Transfection of undifferentiated N2a cells with siI18as causes a twofold increase in E18 inclusion (Figure 5B, lanes 1 and 2) that is abolished by RNAi knockdown of AGO1 (lanes 3 and 4) and HP1α (lanes 5 and 6) and by treatment of cells with BIX (lanes 7 and 8). As an important control, siI18as has no effect on E18 splicing in differentiated N2a cells (lanes 10 and 11), where the repressive intragenic chromatin conformation is already deployed. Furthermore, targeting the intron upstream of E18 does not affect its splicing (siI17as, lane 9). Two additional experiments confirm the mechanism depicted in Figure 5A, originally based on results obtained in a study involving the fibronectin E33 alternative exon (Alló et al, 2009). Transfection of N2a cells with siI18as causes H3K9 dimethylation (Figure 5D) at the NCAM E18 region and downstream (amplicons H and J), but not at the promoter region (amplicon A) or at another upstream region (amplicon C). This is consistent with the inhibition of Pol II elongation measured by the Singh and Padgett (2009) method around E18. Figure 5E shows the kinetics of pre-mRNA recovery after DRB wash for two regions, one mapping close to the promoter (amplicon α) and the other at the E18–I18 boundary (amplicon ζ). siI18as transfection inhibits elongation at the E18-I18 region but not close to the promoter. This localized effect is confirmed when several regions are analysed, following the same representation as used in Figure 3C (Figure 5E, inset).
Figure 5.

Effects of intronic siRNAs on NCAM alternative splicing. (A) Schematic explanation of the TGS-AS mechanism. (B) A scheme of the part of the NCAM gene around exon 18 and the target sites for the intronic double-stranded siRNAs (siI17as and siI18as). (C) Lanes 1 and 2: levels of NCAM E18 inclusion in the presence or absence of siI18as transfection of undifferentiated N2a cells (in the absence of siI18as, a control siRNA against luciferase was transfected). Lanes 3−8: same as lines 1−2, but with the co-transfection of a siRNA against AGO1 (siAGO1), a siRNA against HP1α (si HP1α) or in the presence of BIX. Lane 9: levels of NCAM E18 inclusion in the presence of siI17as transfection of undifferentiated N2a cells. Lanes 10 and 11: same as 1-2 but in differentiated cells. All values are expressed as mean (±s.d.), relativized to values of cells transfected with the siRNA against luciferase. P value corresponds to two-tailed Student’s t test (n=3). (D) H3K9me2 analysis along the NCAM gene in the absence or presence of siI18as transfection using nChIP. The amplicons used are indicated in Figure 2B. Values of two independent immunoprecipitations, relativized to the mean value for HPRT exon 2, are shown for each region. (E) Analysis of transcriptional elongation in the regions α (A) and β (B) of the NCAM gene in the presence or absence of siI18as transfection of undifferentiated N2a cells (in the absence of siI18as, a control siRNA against luciferase was transfected) using the method described in Singh and Padgett (2009). After DRB was washed out to re-initiate transcription, samples were collected at the indicated times for quantification of the pre-mRNA levels using the amplicons depicted in Figure 2B. Values of individual independent determinations for each time point are shown. The inset shows the analysis of pre-mRNA level of the regions of NCAM gene depicted in Figure 2B, presented as Δ(30′−0′) after DRB wash-out relativized to values of cells transfected with siLUC. All values are means+s.d. of duplicates from a representative experiment.
These results indicate that a local deployment of repressive chromatin elicited by specific intronic siRNAs duplicates the effects of differentiation on E18 splicing. This result confirms that the increase in H3K9me2 is sufficient to cause a change in the splicing pattern, and at the same time is necessary for reaching the inclusion levels observed after differentiation.
Discussion
Cell differentiation implies transcriptome reprogramming. In a classical view this is achieved through the differential regulation of transcription, which results in silencing or activation of specific genes. Recent results highlight alternative splicing as a major contributor to cell- and species-specific differentiation (Kalsotra and Cooper, 2011; Barbosa-Morais et al, 2012; Ellis et al, 2012). However, very little is known about the regulatory networks that result in cell-specific patterns of alternative splicing and, in particular, on how the coupling of transcription and splicing in different chromatin contexts contributes to cell differentiation. In a previous work we showed that neuronal depolarization triggers intragenic histone acetylation of the NCAM gene, allowing for higher pol II elongation rates that cause lower inclusion levels of the NCAM E18 into the mature mRNA (Schor et al, 2009). Considering that NCAM E18 was reported to have higher inclusion levels in differentiated neurons (Pollerberg et al, 1985; Tacke and Goridis, 1991) compared with neuronal precursors, the NCAM model of coupling between chromatin, elongation and splicing, revealed by the depolarization study, became highly instrumental to investigate the molecular bases of the upregulation of E18 inclusion during differentiation. Using murine N2a cells in culture we confirmed that E18 inclusion is increased between 2 and 3 times upon neuron differentiation and that this effect is reverted by 5aC and partially by TSA treatment. Results with these chromatin-relaxing agents were highly suggestive that a more compact chromatin status was responsible for the change in splicing in the differentiated cells. This was confirmed by ChIP analysis showing that two silencing histone marks (H3K9me2 and H3K27me3) are deployed all along the NCAM gene after differentiation (Figure 2B and Supplementary Figure S5A) and that, in the case of H3K27me3, the increase in E18 inclusion continues after the increase in the levels of the chromatin silencing mark have been stabilized (Supplementary Figure S5B), which suggests that the change in chromatin precedes the change in splicing. This conclusion is also supported by the demonstration that treatment of the cells with 5aC or TSA reverts the upregulation of the silencing mark H3K9me2 (Figure 2D and Supplementary Figure S4), which can account for the effect of both drugs in preventing upregulation of E18 inclusion during differentiation (Figure 1B and D). 5aC may also act by inhibiting DNA methylation, which in turn may prevent the deposition of methylated histones. We think that DNA methylation is unlikely to play a role here not only because inhibition of methylation requires cycles of cell division whose number is limited in our experimental system, but mainly because we show that differentiation does not change the NCAM DNA methylation pattern around E18 (Figure 2A). We favour the possibility that 5aC is acting by directly inhibiting H3K9 methylation, which is consistent with the results in Figure 2D showing that H3K9 methylation on the NCAM gene is abolished by treating the cells with 5aC. In this context, it became crucial to investigate whether elongation was affected by differentiation. Measuring pol II elongation for specific genes in live cells had been a challenging task until a feasible and simple experimental approach was developed by Singh and Padgett (2009). This approach was successfully used recently by Zhou et al (2011) to show that the Hu splicing regulator induces localized histone acetylation in a target gene after differentiation, leading to increased local transcriptional elongation. Figure 3 shows that pol II elongation is inhibited around E18 in N2a differentiated cells without altering total levels of NCAM mRNA (Figure 2E).
Three lines of evidence indicate that the change in E18 inclusion levels is caused by the intragenic deployment of histone silencing marks on the NCAM gene: (1) The differentiation-dependent upregulation of E18 inclusion is partially prevented by the inhibitor of H3K9 methylation, BIX (Figure 4A and B); (2) upregulation of E18 inclusion is inhibited by knocking down the heterochromatin protein HP1α (Figure 4C); (3) transfection of undifferentiated cells with an siRNA targeting intron 18 upregulates E18 inclusion, duplicating the effect of differentiation on E18 splicing (Figure 5C, lanes 1 and 2). Intronic siRNAs were previously demonstrated to trigger deposition of the H3K9me2 and H3K27me3 silencing marks at their target sites, creating roadblocks to pol II elongation that upregulate inclusion of the upstream exon through an AGO1-dependent mechanism known as TGS-AS (Alló et al, 2009). We confirm that the TGA-AS mechanism operates in the NCAM gene with several experiments: The intronic siRNA effect is abolished by knocking down AGO1 and HP1α (Figure 5C, lanes 3–6) or by addition of BIX (lanes 7 and 8). Furthermore, and similarly to what was shown for the fibronectin gene (Alló et al, 2009), transfection with the intronic siRNA promotes a localized increase in H3K9me2 at the target site and downstream (Figure 5D) and a reduction of pol II elongation around E18 (Figure 5E).
As mentioned before, the changes in the chromatin marks appear not to be specifically located at the E18 region, but to be spread across the entire gene body (and further upstream in the case of H3K27me3), with the exception of the promoter region. This is not entirely reflected in the spatial pattern of pol II elongation inhibition (Figure 3), more affected in the distal region of the gene than in the exon 2 and exon 5 regions analysed (amplicons β and γ). The slight change seen in this region for these amplicons, as for HPRT exon 6, may be a consequence of global efficiency differences in transcription or splicing between the undifferentiated and differentiated cell type. The difference between widespread chromatin and local elongation rate changes is not inconsistent with our model, but suggests that other elements (either in cis or in trans) render transcription in the distal region of the gene more sensitive to chromatin structure. This could also be caused by the particular E18 splicing event, since it is known that splicing can modulate elongation properties (Lin et al, 2008; Alexander et al, 2010). The use of the TGS-AS approach allows a more precise and controlled intervention in intragenic chromatin structure, which is reflected in much more spatially restricted changes both in H3K9me2 (Figure 5D) and in pol II elongation rate (Figure 5E).
Our results complete a picture in which differentiation promotes intragenic chromatin silencing, localized decrease in elongation and higher E18 inclusion. Chromatin compaction and repressive marks seem to be a landmark of various mammalian differentiation systems (Meshorer and Misteli, 2006; Fisher and Fisher, 2011), which can be interpreted as a way to silence non-lineage-specific genes and restrict the transcriptome. Analysis of specific epigenetic modulation has been historically skewed towards readily detectable peaks at promoter regions, while intragenic regions have been mostly neglected. However, clear examples exist showing intragenic changes in DNA methylation during differentiation of mouse ES cells to neuronal precursors (Meissner et al, 2008) or H3K27me3 and H3K9me3 during differentiation of human ES cells to fibroblasts (Hawkins et al, 2010). H3K9me2 is also found in large blocks called LOCKs (large organized chromatin K9 modifications) and are substantially expanded during in vitro differentiation of mouse ES cells or in adult tissues such as liver or brain (Wen et al, 2009). These LOCKs can include many genes and are negatively correlated with expression. Recently, another study assessing changes in H3K9me2 during differentiation of mouse ES cells to terminal neurons has shown that the total amount and the coverage of the genome with this repressive mark is not dramatically increased upon differentiation, but is mostly restricted to local regions (Lienert et al, 2011). Most interestingly, these local areas are mainly intragenic regions and are not associated with silencing of the genes (Lienert et al, 2011). This kind of modulation is consistent with a role of repressive chromatin marks in gene expression steps downstream transcriptional initiation, such as mRNA processing.
Taken together, results in a previous report (Schor et al, 2009) and the present work support a general model of ‘alternative chromatin-alternative splicing’ (Figure 6) in which cells subjected to two different stimuli (membrane potential depolarization or differentiation signals) can modulate the chromatin surrounding a single alternative splicing event in opposite ways to have opposite effects on localized pol II elongation. In this way, this mechanism gives rise to two different alternative splicing patterns in a dynamic way, each of them characteristic of a functional and differentiation status of the neuronal cells.
Figure 6.

Alternative chromatin-alternative splicing model.
Materials and methods
Cell culture
N2a cells were cells were grown in Dulbecco’s modified Eagle’s medium, with high glucose and piruvate (Invitrogen), supplemented with 10% fetal bovine serum. For differentiation, 200 000 cells were plated, washed the next day once with PBS and incubated for 8–9 days (except when indicated otherwise) in the same medium but with 0.2% serum and 2% DMSO. When indicated, 5aC (Sigma), BIX 01294 (Boehringer Ingelheim) or vehicle was added to differentiated cells on days 5–6 or to undifferentiated cells plated at low confluence and left for 3 days. For TSA (Sigma) treatments the drug was left overnight (16 h). Transfection of siRNAs was performed with Lipofectamine 2000 and Optimem (Invitrogen) following the manufacturer’s protocol. Cells were grown in the appropriate conditions for 2–3 more days after transfection. The sequence of the siRNAs used is provided in Supplementary Material. P19 cells were subjected to treatment with retinoic acid to induce the cells to form EBs for 4 days and then the disaggregated cells were plated on poly-lysine and grown in neurobasal medium supplemented with B27 for 3–4 days more.
RNA extraction and RT–PCR
Total RNA was extracted using TRI Reagent (Molecular Research Center, Inc.) according to the manufacturer’s protocol. Reverse transcription using M-MLV reverse transcriptase (Invitrogen) and oligo-dT primer was performed according to the provider’s instructions. Analysis of NCAM E18 splicing using semiquantitative radioactive PCR or real-time PCR was performed as in Schor et al (2009). Analysis of total NCAM was performed by real-time PCR using primers corresponding to exons 2 and 3 of the mRNA. Amplicons for the housekeeping gene HSPCB were used to relativize NCAM levels. Primer sequences are provided in Supplementary Material.
nChIP
nCHIP was performed as in Schor et al (2009), except that the values were calculated relative to the inputs, before subtraction of the non-specific binding (IgG) control. For each immunoprecipitation we used 10 μg of H3K9me2 (07-441) and H3K27me3 (07-449) antibodies from Millipore or 10 μg of rabbit control IgG (ab46540) from Abcam. Pre-blocked protein A agarose beads (Millipore 16-157) were used to recover the immuno-complexes. DNA was purified using QIAquick purification kit (QIAGEN) and quantitative PCR analysis was performed with real-time mixes from Biodynamics and Roche. Primer sequences are provided as Supplementary Material.
Elongation analysis
A methodology similar to that described in (Singh and Padgett (2009)) was used, except that transcription was inhibited with 300 μM DRB during 5 h. Total RNA was extracted using TRI Reagent (Molecular Research Center, Inc.) according to the manufacturer’s protocol. RT reaction was initiated with random defamers. Quantification of the pre-mRNAs was performed by real-time PCR. To enrich in pre-mRNA, only amplicons spanning exon–intron junctions or intronic sequences were used. Results were expressed in relation to the pre-mRNA value of control cells never treated with DRB. For analysing the recovery at 30 min, the amount at time 0 was subtracted. Primer sequences are provided in Supplementary Material.
Bisulphite sequencing
Unmethylated cytosine was converted to uracil by sodium bisulphite using the EpiTect Bisulfite Kit (Qiagen). One microlitre of the converted samples was used as PCR template for amplification and PCR products were ligated into pCR 2.1-TOPO Vector (Invitrogen) according to the manufacturer’s protocol. Ligations were transformed into Escherichia coli DH5α and plasmid extracted from cultures of recombinant colonies using the PureLink Quick Plasmid Miniprep Kit (Invitrogen). Approximately 10 clones per sample were sequenced.
Supplementary Material
Acknowledgments
We thank V Buggiano for her invaluable help and MJ Muñoz, F Pelisch, M Alló, G Risso, A Srebrow, C Lafaille, L Gómez Acuña, A Quaglino, B Pozzi, M Godoy Herz, N Nieto Moreno, G Dujardin and L Durrieu for their support and useful discussions. This work was supported by grants to ARK from the Agencia Nacional de Promoción de Ciencia y Tecnología of Argentina, the University of Buenos Aires and the European Alternative Splicing Network (EURASNET). IES and EP were, and AF is, recipients of fellowships and ARK is a career investigator from the Consejo Nacional de Investigaciones Científicas y Técnicas of Argentina (CONICET) and a Senior International Research Scholar of the Howard Hughes Medical Institute.
Author contributions: IES and AF designed and performed most of the experiments. EP performed some of the experiments. IES and ARK co-wrote the manuscript. ARK supervised the whole work.
Footnotes
The authors declare that they have no conflict of interest.
References
- Adami G, Babiss LE (1991) DNA template effect on RNA splicing: two copies of the same gene in the same nucleus are processed differently. EMBO J 10: 3457–3465 [DOI] [PMC free article] [PubMed] [Google Scholar]
- Alexander RD, Innocente SA, Barrass JD, Beggs JD (2010) Splicing-dependent RNA polymerase pausing in yeast. Mol Cell 40: 582–593 [DOI] [PMC free article] [PubMed] [Google Scholar]
- Alló M, Buggiano V, Fededa JP, Petrillo E, Schor I, de la Mata M, Agirre E, Plass M, Eyras E, Elela SA, Klinck R, Chabot B, Kornblihtt AR (2009) Control of alternative splicing through siRNA-mediated transcriptional gene silencing. Nat Struct Mol Biol 16: 717–724 [DOI] [PubMed] [Google Scholar]
- Alló M, Schor IE, Munoz MJ, de la Mata M, Agirre E, Valcarcel J, Eyras E, Kornblihtt AR (2010) Chromatin and alternative splicing. Cold Spring Harb Symp Quant Biol 75: 103–111 [DOI] [PubMed] [Google Scholar]
- Ameyar-Zazoua M, Rachez C, Souidi M, Robin P, Fritsch L, Young R, Morozova N, Fenouil R, Descostes N, Andrau JC, Mathieu J, Hamiche A, Ait-Si-Ali S, Muchardt C, Batsché E, Harel-Bellan A (2012) Argonaute proteins couple chromatin silencing to alternative splicing. Nat Struct Mol Biol 19: 998–1004 [DOI] [PubMed] [Google Scholar]
- Andersson R, Enroth S, Rada-Iglesias A, Wadelius C, Komorowski J (2009) Nucleosomes are well positioned in exons and carry characteristic histone modifications. Genome Res 19: 1732–1741 [DOI] [PMC free article] [PubMed] [Google Scholar]
- Barbosa-Morais NL, Irimia M, Pan Q, Xiong HY, Gueroussov S, Lee LJ, Slobodeniuc V, Kutter C, Watt S, Colak R, Kim T, Misquitta-Ali CM, Wilson MD, Kim PM, Odom DT, Frey BJ, Blencowe BJ (2012) The evolutionary landscape of alternative splicing in vertebrate species. Science 338: 1587–1593 [DOI] [PubMed] [Google Scholar]
- Batsché E, Yaniv M, Muchardt C (2006) The human SWI/SNF subunit Brm is a regulator of alternative splicing. Nat Struct Mol Biol 13: 22–29 [DOI] [PubMed] [Google Scholar]
- Bentley DL (2005) Rules of engagement: co-transcriptional recruitment of pre-mRNA processing factors. Curr Opin Cell Biol 17: 251–256 [DOI] [PubMed] [Google Scholar]
- Buttner B, Reutter W, Horstkorte R (2004) Cytoplasmic domain of NCAM 180 reduces NCAM-mediated neurite outgrowth. J Neurosci Res 75: 854–860 [DOI] [PubMed] [Google Scholar]
- Carrillo Oesterreich F, Preibisch S, Neugebauer KM (2010) Global analysis of nascent RNA reveals transcriptional pausing in terminal exons. Mol Cell 40: 571–581 [DOI] [PubMed] [Google Scholar]
- Chiu CP, Blau HM (1985) 5-Azacytidine permits gene activation in a previously noninducible cell type. Cell 40: 417–424 [DOI] [PubMed] [Google Scholar]
- Creusot F, Acs G, Christman JK (1982) Inhibition of DNA methyltransferase and induction of Friend erythroleukemia cell differentiation by 5-azacytidine and 5-aza-2'-deoxycytidine. J Biol Chem 257: 2041–2048 [PubMed] [Google Scholar]
- Cunningham BA, Hemperly JJ, Murray BA, Prediger EA, Brackenbury R, Edelman GM (1987) Neural cell adhesion molecule: structure, immunoglobulin-like domains, cell surface modulation, and alternative RNA splicing. Science 236: 799–806 [DOI] [PubMed] [Google Scholar]
- de la Mata M, Alonso CR, Kadener S, Fededa JP, Blaustein M, Pelisch F, Cramer P, Bentley D, Kornblihtt AR (2003) A slow RNA polymerase II affects alternative splicing in vivo. Mol Cell 12: 525–532 [DOI] [PubMed] [Google Scholar]
- de la Mata M, Kornblihtt AR (2006) RNA polymerase II C-terminal domain mediates regulation of alternative splicing by SRp20. Nat Struct Mol Biol 13: 973–980 [DOI] [PubMed] [Google Scholar]
- Doherty P, Rimon G, Mann DA, Walsh FS (1992) Alternative splicing of the cytoplasmic domain of neural cell adhesion molecule alters its ability to act as a substrate for neurite outgrowth. J Neurochem 58: 2338–2341 [DOI] [PubMed] [Google Scholar]
- Ellis JD, Barrios-Rodiles M, Colak R, Irimia M, Kim T, Calarco JA, Wang X, Pan Q, O'Hanlon D, Kim PM, Wrana JL, Blencowe BJ (2012) Tissue-specific alternative splicing remodels protein-protein interaction networks. Mol Cell 46: 884–892 [DOI] [PubMed] [Google Scholar]
- Fagnani M, Barash Y, Ip JY, Misquitta C, Pan Q, Saltzman AL, Shai O, Lee L, Rozenhek A, Mohammad N, Willaime-Morawek S, Babak T, Zhang W, Hughes TR, van der Kooy D, Frey BJ, Blencowe BJ (2007) Functional coordination of alternative splicing in the mammalian central nervous system. Genome Biol 8: R108. [DOI] [PMC free article] [PubMed] [Google Scholar]
- Ferraro M, Lavia P (1983) Activation of human ribosomal genes by 5-azacytidine. Exp Cell Res 145: 452–457 [DOI] [PubMed] [Google Scholar]
- Fisher CL, Fisher AG (2011) Chromatin states in pluripotent, differentiated, and reprogrammed cells. Curr Opin Genet Dev 21: 140–146 [DOI] [PubMed] [Google Scholar]
- Ginder GD, Whitters MJ, Pohlman JK (1984) Activation of a chicken embryonic globin gene in adult erythroid cells by 5-azacytidine and sodium butyrate. Proc Natl Acad Sci USA 81: 3954–3958 [DOI] [PMC free article] [PubMed] [Google Scholar]
- Hawkins RD, Hon GC, Lee LK, Ngo Q, Lister R, Pelizzola M, Edsall LE, Kuan S, Luu Y, Klugman S, Antosiewicz-Bourget J, Ye Z, Espinoza C, Agarwahl S, Shen L, Ruotti V, Wang W, Stewart R, Thomson JA, Ecker JR et al. (2010) Distinct epigenomic landscapes of pluripotent and lineage-committed human cells. Cell Stem Cell 6: 479–491 [DOI] [PMC free article] [PubMed] [Google Scholar]
- Kadener S, Cramer P, Nogues G, Cazalla D, de la Mata M, Fededa JP, Werbajh SE, Srebrow A, Kornblihtt AR (2001) Antagonistic effects of T-Ag and VP16 reveal a role for RNA pol II elongation on alternative splicing. EMBO J 20: 5759–5768 [DOI] [PMC free article] [PubMed] [Google Scholar]
- Kalsotra A, Cooper TA (2011) Functional consequences of developmentally regulated alternative splicing. Nat Rev Genet 12: 715–729 [DOI] [PMC free article] [PubMed] [Google Scholar]
- Kim DH, Villeneuve LM, Morris KV, Rossi JJ (2006) Argonaute-1 directs siRNA-mediated transcriptional gene silencing in human cells. Nat Struct Mol Biol 13: 793–797 [DOI] [PubMed] [Google Scholar]
- Kornblihtt AR (2006) Chromatin, transcript elongation and alternative splicing. Nat Struct Mol Biol 13: 5–7 [DOI] [PubMed] [Google Scholar]
- Kornblihtt AR (2007) Coupling transcription and alternative splicing. Adv Exp Med Biol 623: 175–189 [DOI] [PubMed] [Google Scholar]
- Kornblihtt AR, Schor IE, Alló M, Dujardin G, Petrillo E, Muñoz MJ (2013) Alternative splicing: a pivotal step between eukaryotic transcription and translation. Nat Rev Mol Cell Biol 14: 153–165 [DOI] [PubMed] [Google Scholar]
- Kubicek S, O'Sullivan RJ, August EM, Hickey ER, Zhang Q, Teodoro ML, Rea S, Mechtler K, Kowalski JA, Homon CA, Kelly TA, Jenuwein T (2007) Reversal of H3K9me2 by a small-molecule inhibitor for the G9a histone methyltransferase. Mol Cell 25: 473–481 [DOI] [PubMed] [Google Scholar]
- Kwak H, Fuda NJ, Core LJ, Lis JT (2013) Precise maps of RNA polymerase reveal how promoters direct initiation and pausing. Science 339: 950–953 [DOI] [PMC free article] [PubMed] [Google Scholar]
- Licatalosi DD, Darnell RB (2006) Splicing regulation in neurologic disease. Neuron 52: 93–101 [DOI] [PubMed] [Google Scholar]
- Lienert F, Mohn F, Tiwari VK, Baubec T, Roloff TC, Gaidatzis D, Stadler MB, Schubeler D (2011) Genomic prevalence of heterochromatic H3K9me2 and transcription do not discriminate pluripotent from terminally differentiated cells. PLoS Genet 7: e1002090. [DOI] [PMC free article] [PubMed] [Google Scholar]
- Lin S, Coutinho-Mansfield G, Wang D, Pandit S, Fu XD (2008) The splicing factor SC35 has an active role in transcriptional elongation. Nat Struct Mol Biol 15: 819–826 [DOI] [PMC free article] [PubMed] [Google Scholar]
- Lorincz MC, Dickerson DR, Schmitt M, Groudine M (2004) Intragenic DNA methylation alters chromatin structure and elongation efficiency in mammalian cells. Nat Struct Mol Biol 11: 1068–1075 [DOI] [PubMed] [Google Scholar]
- Luco RF, Allo M, Schor IE, Kornblihtt AR, Misteli T (2011) Epigenetics in alternative pre-mRNA splicing. Cell 144: 16–26 [DOI] [PMC free article] [PubMed] [Google Scholar]
- Luco RF, Pan Q, Tominaga K, Blencowe BJ, Pereira-Smith OM, Misteli T (2010) Regulation of alternative splicing by histone modifications. Science 327: 996–1000 [DOI] [PMC free article] [PubMed] [Google Scholar]
- Meissner A, Mikkelsen TS, Gu H, Wernig M, Hanna J, Sivachenko A, Zhang X, Bernstein BE, Nusbaum C, Jaffe DB, Gnirke A, Jaenisch R, Lander ES (2008) Genome-scale DNA methylation maps of pluripotent and differentiated cells. Nature 454: 766–770 [DOI] [PMC free article] [PubMed] [Google Scholar]
- Meshorer E, Misteli T (2006) Chromatin in pluripotent embryonic stem cells and differentiation. Nat Rev Mol Cell Biol 7: 540–546 [DOI] [PubMed] [Google Scholar]
- Neugebauer KM (2002) On the importance of being co-transcriptional. J Cell Sci 115: 3865–3871 [DOI] [PubMed] [Google Scholar]
- Pan Q, Shai O, Lee LJ, Frey BJ, Blencowe BJ (2008) Deep surveying of alternative splicing complexity in the human transcriptome by high-throughput sequencing. Nat Genet 40: 1413–1415 [DOI] [PubMed] [Google Scholar]
- Perales R, Bentley D (2009) ‘Cotranscriptionality’: the transcription elongation complex as a nexus for nuclear transactions. Mol Cell 36: 178–191 [DOI] [PMC free article] [PubMed] [Google Scholar]
- Persohn E, Schachner M (1990) Immunohistological localization of the neural adhesion molecules L1 and N-CAM in the developing hippocampus of the mouse. J Neurocytol 19: 807–819 [DOI] [PubMed] [Google Scholar]
- Pollerberg EG, Sadoul R, Goridis C, Schachner M (1985) Selective expression of the 180-kD component of the neural cell adhesion molecule N-CAM during development. J Cell Biol 101: 1921–1929 [DOI] [PMC free article] [PubMed] [Google Scholar]
- Polo-Parada L, Bose CM, Plattner F, Landmesser LT (2004) Distinct roles of different neural cell adhesion molecule (NCAM) isoforms in synaptic maturation revealed by analysis of NCAM 180 kDa isoform-deficient mice. J Neurosci 24: 1852–1864 [DOI] [PMC free article] [PubMed] [Google Scholar]
- Reyes AA, Small SJ, Akeson R (1991) At least 27 alternatively spliced forms of the neural cell adhesion molecule mRNA are expressed during rat heart development. Mol Cell Biol 11: 1654–1661 [DOI] [PMC free article] [PubMed] [Google Scholar]
- Saint-André V, Batsché E, Rachez C, Muchardt C (2011) Histone H3 lysine 9 trimethylation and HP1gamma favor inclusion of alternative exons. Nat Struct Mol Biol 18: 337–344 [DOI] [PubMed] [Google Scholar]
- Schor IE, Rascovan N, Pelisch F, Allo M, Kornblihtt AR (2009) Neuronal cell depolarization induces intragenic chromatin modifications affecting NCAM alternative splicing. Proc Natl Acad Sci USA 106: 4325–4330 [DOI] [PMC free article] [PubMed] [Google Scholar]
- Schwartz S, Meshorer E, Ast G (2009) Chromatin organization marks exon-intron structure. Nat Struct Mol Biol 16: 990–995 [DOI] [PubMed] [Google Scholar]
- Scott SA, Dong WF, Ichinohasama R, Hirsch C, Sheridan D, Sanche SE, Geyer CR, Decoteau JF (2006) 5-Aza-2'-deoxycytidine (decitabine) can relieve p21WAF1 repression in human acute myeloid leukemia by a mechanism involving release of histone deacetylase 1 (HDAC1) without requiring p21WAF1 promoter demethylation. Leuk Res 30: 69–76 [DOI] [PubMed] [Google Scholar]
- Sims RJ 3rd, Millhouse S, Chen CF, Lewis BA, Erdjument-Bromage H, Tempst P, Manley JL, Reinberg D (2007) Recognition of trimethylated histone H3 lysine 4 facilitates the recruitment of transcription postinitiation factors and pre-mRNA splicing. Mol Cell 28: 665–676 [DOI] [PMC free article] [PubMed] [Google Scholar]
- Singh J, Padgett RA (2009) Rates of in situ transcription and splicing in large human genes. Nat Struct Mol Biol 16: 1128–1133 [DOI] [PMC free article] [PubMed] [Google Scholar]
- Soengas MS, Capodieci P, Polsky D, Mora J, Esteller M, Opitz-Araya X, McCombie R, Herman JG, Gerald WL, Lazebnik YA, Cordon-Cardo C, Lowe SW (2001) Inactivation of the apoptosis effector Apaf-1 in malignant melanoma. Nature 409: 207–211 [DOI] [PubMed] [Google Scholar]
- Spies N, Nielsen CB, Padgett RA, Burge CB (2009) Biased chromatin signatures around polyadenylation sites and exons. Mol Cell 36: 245–254 [DOI] [PMC free article] [PubMed] [Google Scholar]
- Sytnyk V, Leshchyns'ka I, Delling M, Dityateva G, Dityatev A, Schachner M (2002) Neural cell adhesion molecule promotes accumulation of TGN organelles at sites of neuron-to-neuron contacts. J Cell Biol 159: 649–661 [DOI] [PMC free article] [PubMed] [Google Scholar]
- Sytnyk V, Leshchyns'ka I, Nikonenko AG, Schachner M (2006) NCAM promotes assembly and activity-dependent remodeling of the postsynaptic signaling complex. J Cell Biol 174: 1071–1085 [DOI] [PMC free article] [PubMed] [Google Scholar]
- Tacke R, Goridis C (1991) Alternative splicing in the neural cell adhesion molecule pre-mRNA: regulation of exon 18 skipping depends on the 5'-splice site. Genes Dev 5: 1416–1429 [DOI] [PubMed] [Google Scholar]
- Tilgner H, Nikolaou C, Althammer S, Sammeth M, Beato M, Valcarcel J, Guigo R (2009) Nucleosome positioning as a determinant of exon recognition. Nat Struct Mol Biol 16: 996–1001 [DOI] [PubMed] [Google Scholar]
- Tilgner H, Knowles DG, Johnson R, Davis CA, Chakrabortty S, Djebali S, Curado J, Snyder M, Gingeras TR, Guigó R (2012) Deep sequencing of subcellular RNA fractions shows splicing to be predominantly co-transcriptional in the human genome but inefficient for lncRNAs. Genome Res 22: 1616–1625 [DOI] [PMC free article] [PubMed] [Google Scholar]
- Wang ET, Sandberg R, Luo S, Khrebtukova I, Zhang L, Mayr C, Kingsmore SF, Schroth GP, Burge CB (2008) Alternative isoform regulation in human tissue transcriptomes. Nature 456: 470–476 [DOI] [PMC free article] [PubMed] [Google Scholar]
- Wen B, Wu H, Shinkai Y, Irizarry RA, Feinberg AP (2009) Large histone H3 lysine 9 dimethylated chromatin blocks distinguish differentiated from embryonic stem cells. Nat Genet 41: 246–250 [DOI] [PMC free article] [PubMed] [Google Scholar]
- Wozniak RJ, Klimecki WT, Lau SS, Feinstein Y, Futscher BW (2007) 5-Aza-2′-deoxycytidine-mediated reductions in G9A histone methyltransferase and histone H3 K9 di-methylation levels are linked to tumor suppressor gene reactivation. Oncogene 26: 77–90 [DOI] [PubMed] [Google Scholar]
- Zhou HL, Hinman MN, Barron VA, Geng C, Zhou G, Luo G, Siegel RE, Lou H (2011) Hu proteins regulate alternative splicing by inducing localized histone hyperacetylation in an RNA-dependent manner. Proc Natl Acad Sci USA 108: E627–E635 [DOI] [PMC free article] [PubMed] [Google Scholar]
- Zhu WG, Dai Z, Ding H, Srinivasan K, Hall J, Duan W, Villalona-Calero MA, Plass C, Otterson GA (2001) Increased expression of unmethylated CDKN2D by 5-aza-2'-deoxycytidine in human lung cancer cells. Oncogene 20: 7787–7796 [DOI] [PubMed] [Google Scholar]
Associated Data
This section collects any data citations, data availability statements, or supplementary materials included in this article.