Abstract
There is uncertainty over the population prevalence of people with Down's syndrome in England and Wales. This study aimed to estimate the population prevalence of Down's syndrome in England and Wales in 2011. A meta-analysis of published survival rates of people with Down's syndrome from 1938 to 2010 was conducted and the results were applied to the estimated numbers of babies born with Down's syndrome since 1938 in England and Wales. An estimated 37 090 people had Down's syndrome in England and Wales in 2011, a population prevalence of 0.66 per 1000 people; 650 under 1, 2673 aged 1–5, 7115 aged 5–18, 12819 aged 19–40, 10 626 aged 41–55 and 3207 aged 56 and older. The average life expectancy for babies with Down's syndrome born in 2011 was 51 years and the median life expectancy was 58 years. This study provides clarity on the number of people with Down's syndrome in England and Wales. Owing to sudden increases in the survival of babies with Down's syndrome in the 1950s there are a large proportion of people with Down's syndrome who are in their 40s. These people have an increased risk of developing dementia in the future and services should be aware of their potential needs.
Keywords: Down's syndrome, population prevalence, survival
Introduction
There is uncertainty over the population prevalence of people with Down's syndrome in England and Wales. The live birth prevalence of Down's syndrome has only accurately been recorded since 1989. Over the last few decades there have been significant changes both in the live birth prevalence of Down's syndrome and also in the survival rates of people with Down's syndrome. Only 47% of live births with Down's syndrome survived to 1 year of age in the 1950s, with the survival increasing to over 90% since the 1980s.1, 2 This paper aimed to estimate the population prevalence of Down's syndrome in England and Wales in 2011, by applying published survival rates to estimated numbers of babies born with Down's syndrome since 1938 in order to predict how many were still alive in 2011.
Materials and methods
Live birth prevalence of Down's syndrome
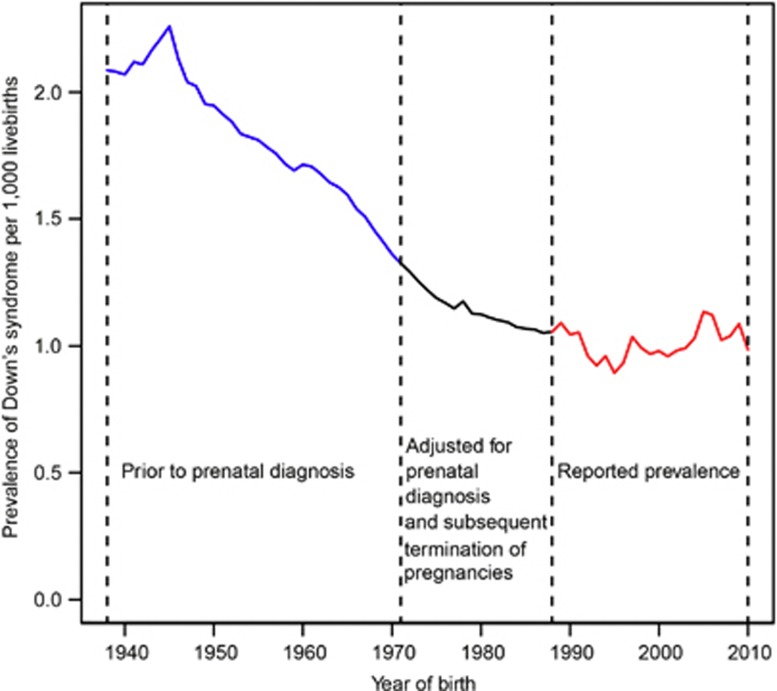
Our accompanying paper estimated the live birth prevalence of Down's syndrome in the absence of screening and subsequent terminations using birth data from 1938 onwards.3 The estimated prevalence is likely to be accurate before screening for Down's syndrome in England and Wales started in the early 1970s. From 1970 to 1989, maternal age was the main factor used to identify pregnant women judged to be at a high risk of a Down's syndrome pregnancy. Women over 35 years of age were offered an amniocentesis or chorionic villus sampling to diagnose the pregnancy and women with affected pregnancies where then offered a termination. The proportion of women over 35 in England and Wales having prenatal diagnosis and deciding to have a termination was estimated using the observed proportions in one cytogenetic laboratory in England (the Wessex Regional Genetics Laboratory, Salisbury, UK) and the numbers of babies born with Down's syndrome to women aged 35 and over were reduced by the estimated proportion having a termination for that year (Supplementary Table 1). A sensitivity analyses was performed to quantify the effect of the adjustment for terminations.
The number of babies born with Down's syndrome has been reported annually since the National Down Syndrome Cytogenetic Register (NDSCR) started to collect details of antenatal and postnatal diagnoses of Down's syndrome in England and Wales in 1989,4, 5, 6 and such data were extracted from the NDSCR annual report.5 These babies have not been followed up and so it is unknown how many are still alive.
Figure 1 shows the estimated live birth prevalence of Down's syndrome since 1938.
Figure 1.
Live birth prevalence of Down's syndrome from 1938 to 2010 in England and Wales.
Published data on survival rates in people with Down's syndrome
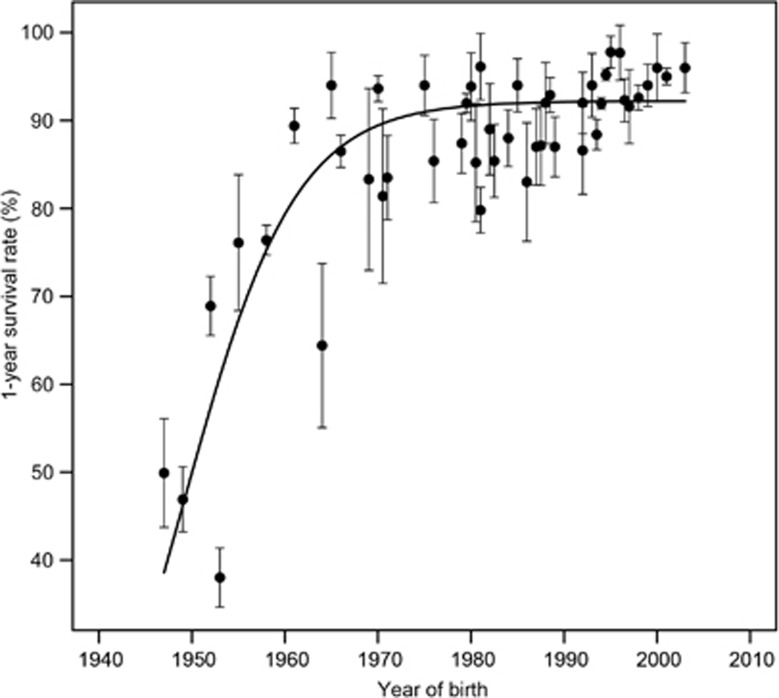
Using OVID and Medline (searching on keywords: Down's syndrome, survival and mortality) 39 studies were identified that reported the survival rate of people with Down's syndrome since 1930 (Supplementary Table 2). For each study, the 1-year survival rate was assumed to occur at the midpoint of the whole study period. The 1-year survival rates according to year of birth were then fitted using nonlinear weighted logistic regression (the nonlinear least square function in R; the sample size in each study was used as the weight). The fitted 1-year survival rate is given by: survival rate =92.210/(1+exp((1948.988−year)/6.041)).
Five- and 10-year survival rates were reported in 24 and 20 studies, respectively, (see Supplementary Table 2; all figures were directly extracted or calculated from the cited studies). For each study, the probability of survival at 5 years of age given that the baby survived to 1 year of age was calculated and assumed to occur at the midpoint of the whole study period. The probability of survival at 5 years of age according to year of birth was then fitted by using nonlinear weighted logistic regression across the whole of the study period with the sample size in each study being used as the weight. The fitted survival rate between age 1 and age 5 is given by: survival rate =98.698/(1+exp((1917.438−year)/19.310)). The same procedure was used to estimate the survival at 10 years of age given that a child survived to age 5. The fitted survival rate between age 5 and age 10 is given by: survival rate=99.750/(1+exp((1900.152−year)/19.326)). The probability of survival at each year of age under 10 was then estimated using linear interpolation.
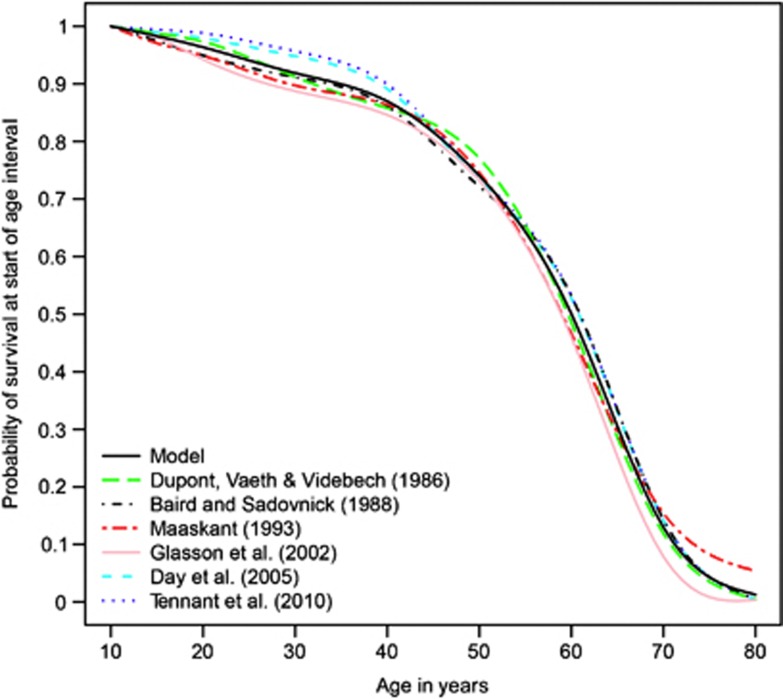
For survival rates above 10 years of age, data were extracted from six studies.7, 8, 9, 10, 11, 12 At each age, the average survival from the six studies was used as the survival curve above 10 years of age. This was assumed to apply regardless of the year of birth. This method of estimating the survival rates at 1, 5 and 10 years was developed by de Graaf et al.13
Population prevalence of Down's syndrome in 2011
For any given year, people with Down's syndrome who survived to 2011 were calculated by multiplying the live births born in that year and subsequent survival rates until 2011. The number of people with Down's syndrome in 2011 was the sum of people of all ages with Down's syndrome who were still alive.
Life expectancy
The average and the median life expectancy for a baby with Down's syndrome born in 2011 was estimated using the above estimated survival rates for people with Down's syndrome.
Results
Figure 2 shows the 1-year survival rate of newborns with Down's syndrome reported in 39 studies on cohorts born from1940 to 2010. Only one study with a small sample size was conducted before 1940 and this study was excluded from the analysis.1
Figure 2.
Published studies on 1-year survival rates for babies with Down's syndrome according to year of birth with 95% confidence intervals and fitted regression curves.
The survival rates between age 1 and 5 and age 5 and 10 are shown in Supplementary Figures 1 and 2, respectively, with the circles being the reported rates and the bold line being the estimated rate. There was a continual increase in survival rates, although it was much smaller after age 5. Figure 3 shows the survival curves from age 10 onwards, which do not show a continual increase in survival over time. The summary survival estimate was the average of all the curves.
Figure 3.
Down's syndrome survival curves above 10 years of age.
Table 1 shows the life table for people with Down's syndrome born in 2011. For newborns with Down's syndrome, the average life expectancy was 50.8 years. The median life expectancy was about 58 years.
Table 1. Life table for people with Down's syndrome born in 2011.
| Age (year) | Number living at beginning of specified age | Mortality rate (deaths per person per year) | Life expectancy at beginning of specified age (years) |
|---|---|---|---|
| 0 − | 100 000 | 0.07810 | 50.8 |
| 1− | 92 190 | 0.00639 | 54.1 |
| 5 − | 89 858 | 0.00212 | 51.4 |
| 10 − | 88 945 | 0.00210 | 46.9 |
| 15 − | 88 033 | 0.00205 | 42.4 |
| 20 − | 87 048 | 0.00311 | 37.8 |
| 30 − | 84 215 | 0.00418 | 28.9 |
| 40 − | 78 356 | 0.01940 | 20.5 |
| 50 − | 63 887 | 0.03223 | 13.9 |
| 60 − | 43 940 | 0.12269 | 7.4 |
| 70 − | 10 155 | 0.21167 | 4.5 |
| 80 − | 914 | 0.51630 | 1.9 |
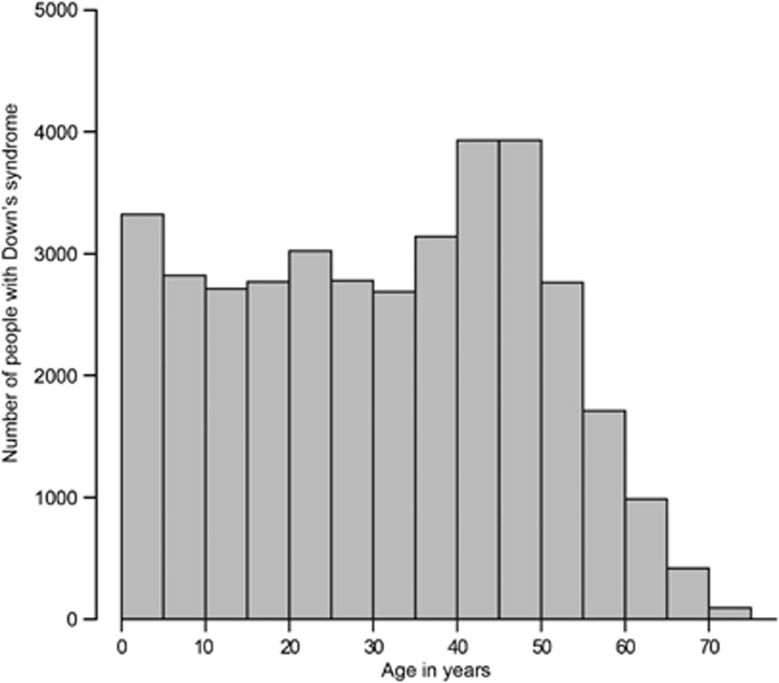
Figure 4 shows the 5-year age distribution of people with Down's syndrome in 2011 (Supplementary Table 4 shows the number of people with Down's syndrome in each age band). There were a relatively small proportion of people aged over 50, partly due to the extremely low first year survival of newborns with Down's syndrome before 1952.11
Figure 4.
Age distribution of people in 2011 with Down's syndrome in England and Wales.
In total, there were estimated to be 37 090 people with Down's syndrome in England and Wales in 2011, 650 babies with Down's syndrome aged 0–1; 2673 aged 1–4 (inclusive); 7115 aged 5–18; 12 819 aged 19–40; 10 626 aged 41–55 and 3207 aged over 55. The population prevalence was 0.66 per 1000 people. The total number of people with Down's syndrome in the United Kingdom in 2011 was likely to be 41 725 (calculated by 37 090 × (63 million/56 million)).
Sensitivity analysis
A sensitivity analysis was performed assuming that no terminations for Down's syndrome occurred before 1989 (rather than assuming the levels were those observed by one regional genetics laboratory). This predicted that there were 38 455 people with Down's syndrome in England and Wales, a prevalence of 0.69 per 1000.
A second sensitivity analysis was performed assuming that the 1-year survival rates observed from 1938 onwards were equivalent to those observed in the 1980s (which is clearly over optimistic); this predicted that there were 40 284 people with Down's syndrome in England and Wales, a prevalence of 0.72 per 1000.
Discussion
This paper combined all available resources on live births and the survival rate of people with Down's syndrome to estimate the prevalence of Down's syndrome in England and Wales in 2011. The estimated number was about 37 090 with a total prevalence of around 0.66 per 1000. The number of people with Down's syndrome was uniformly distributed under age 40 (about 5800 in 10-year age band), however, the number of people with Down's syndrome in their 40s was significantly greater at around 8000.
De Graaf et al13 have estimated the population prevalence of people with Down's syndrome as 0.61 per 1000 persons, with an estimated total of 34 160 persons with Down's syndrome in England and Wales. The difference in prevalence can mainly be explained by different estimates of survival rate. De Graaf et al included in his meta-analysis survival rates estimated in studies comparing the prevalence in one age group with the prevalence in a second age group and assuming the differences were a measure of the survival rate between the two age groups. We excluded these studies in our meta-analysis – only including studies that followed a defined cohort of people with Down's syndrome over time. Our study also included an additional 15 published studies and fitted the regression curves weighted by the number of people involved in the studies.
The estimated life expectancy for people with Down's syndrome born in 2011 was greater than that estimated by other studies;11, 13, 14 a median life expectancy of 58 years compared with 57 years in Baird and Sadnovnick11 and 50 years in De Graaf et al.13 The improvement of median life expectancy is mainly due to the improved infant survival after birth.
One of the weakness of this study is that before 1989 the number of babies are born with Down's syndrome is unknown. Data on the numbers of babies born with Down's syndrome were collected by the National Congenital Anomaly Service (NCAS), and published annually by the Office for National Statistics from 1971 to 2008 (Supplementary Table 3).15 However, both the NDSCR and other regional congenital anomaly registers demonstrated that the NCAS system had a significantly lower ascertainment rate16, 17 (Supplementary Table 3). Therefore, the data from NCAS for 1971 to 1989 were not used; instead the risk of a Down's syndrome pregnancy according to maternal age was used. This has been shown to be accurate in estimating the numbers of babies born with Down's syndrome when applied to single years of maternal age.18 The data on population births were only available in 5-year age bands, which will produce a small amount of inaccuracy. The live birth records were available only after 1938. This excludes people with Down's syndrome born before 1938 although the number of such people who were alive in 2011 would be very small (<200). We had to estimate the proportion of foetuses terminated before 1989. As Supplementary Table 1 shows an estimated 2000 such terminations occurred before 1989 (the difference between columns 4 and 5 in Supplementary Table 1) based on data from Wessex Regional Genetics Centre. It may not be appropriate to apply this regional estimate nationally, but it is unlikely to be too inaccurate.
Karyotypic confirmation of Down's syndrome was not available until the 1960s, thus in the earlier studies Down's syndrome was ascertained by clinical features. It is possible that ‘healthier' babies with less phenotypic features of Down's syndrome may not have been diagnosed, which will result in the estimated survival for the earlier studies being too low. However, our sensitivity analysis indicated that even assuming the survival from 1938 onwards to be that observed in the 1980s (which is clearly over optimistic); the prevalence was 0.72 per 1000. Therefore, this potential underestimation of survival is unlikely to materially affect the overall population estimates.
The majority of Down's syndrome cases were ascertained in the first few days after birth, although not all studies mentioned the ascertainment time. It may be that some babies who were not diagnosed until several weeks later have been excluded from some of the studies. This may result in the estimated survival being too low. However, the majority of babies with Down syndrome are diagnosed within the first few weeks of life and therefore this bias is unlikely to materially affect the estimates.
In conclusion, this paper provides clarity on the number of people with Down's syndrome in England and Wales. Owing to the sudden increase in survival of babies with Down's syndrome from the 1950s onwards, there were a large proportion of people with Down's syndrome who were in their 40s in 2011. A study in 2007 reported that complications such as hypothyroidism, coeliac disease and obesity occur more frequently in adults with Down's syndrome than previous paediatric prevalence studies suggest19 and the authors recommended that an evidence-based guideline detailing structured health checks for adults with Down's syndrome should be developed. The increased survival of older people with Down's syndrome highlights the need for the development of such guidelines and the appropriate resource allocation to deliver the care these people will require, particularly given their increased risk of developing dementia.20, 21
Acknowledgments
We thank Sir Nicholas Wald at the Wolfson Institute of Preventive Medicine for his helpful comments. We thank Dr Gert de Graaf for his help with correcting this paper.
The authors declare no conflict of interest.
Footnotes
Supplementary Information accompanies the paper on European Journal of Human Genetics website (http://www.nature.com/ejhg)
Supplementary Material
References
- Carter C. A life table for mongols with the causes of death. J Ment Defic Res. 1958;2:64–74. [Google Scholar]
- Baird P, Sadovnick A. Life expectancy in Down syndrome. J Pediatr. 1987;110:849–854. doi: 10.1016/s0022-3476(87)80395-5. [DOI] [PubMed] [Google Scholar]
- Wu J, Morris JK.Trends in maternal age and the live birth prevalence of Down's syndrome in England and Wales: 1938–2010 Eur J Human Genet 2012. doi: 10.1038/ejhg.2012.288(in press). [DOI] [PMC free article] [PubMed]
- Mutton DE, Alberman E, Ide R, Bobrow M. Results of first year (1989) of a national register of Down's syndrome in England and Wales. BMJ. 1991;303:1295–1297. doi: 10.1136/bmj.303.6813.1295. [DOI] [PMC free article] [PubMed] [Google Scholar]
- Morris JK. The National Down Syndrome Cytogenetic Register for England and Wales 2010 Annual Report. Queen Mary: University of London, Barts and The London School of Medicine and Dentistry; 2011. [Google Scholar]
- Morris JK, Alberman E. Trends in Down's syndrome live births and antenatal diagnoses in England and Wales from 1989 to 2008: analysis of data from the National Down Syndrome Cytogenetic Register. BMJ. 2009;339:b3794. doi: 10.1136/bmj.b3794. [DOI] [PMC free article] [PubMed] [Google Scholar]
- Tennant PWG, Pearce MS, Bythell M, Rankin J. 20-Year survival of children born with congenital anomalies: a population-based study. Lancet. 2010;375:649–656. doi: 10.1016/S0140-6736(09)61922-X. [DOI] [PubMed] [Google Scholar]
- Day S, Strauss D, Shavelle R, Reynolds R. Mortality and causes of death in persons with Down syndrome in California. Dev Med Child Neurol. 2005;47:171–176. doi: 10.1017/s0012162205000319. [DOI] [PubMed] [Google Scholar]
- Glasson E, Sullivan S, Hussain R, Petterson B, Montgomery P. The changing survival profile of people with Down ' s syndrome: implications for genetic counselling. Clin Genet. 2002;9163:390–393. doi: 10.1034/j.1399-0004.2002.620506.x. [DOI] [PubMed] [Google Scholar]
- Maaskant MA. Mental Handicap and Ageing. Dwingeloo, Kavanah: Maastricht University; 1993. [Google Scholar]
- Baird P, Sadovnick A. Life expectancy in Down syndrome adults. Lancet. 1988;2:1354–1356. doi: 10.1016/s0140-6736(88)90881-1. [DOI] [PubMed] [Google Scholar]
- Dupont A, Vaeth M, Videbech P. Mortality and life expectancy of Down's syndrome in Denmark. J Ment Defic Res. 1986;30:111–120. doi: 10.1111/j.1365-2788.1986.tb01304.x. [DOI] [PubMed] [Google Scholar]
- de Graaf G, Vis JC, Haveman M, et al. Assessment of prevalence of persons with Down syndrome: a theory-based demographic model. J Appl Res Intellect Disabil. 2011;24:247–262. [Google Scholar]
- Malone Q. Mortality and survival of the Down's syndrome population in Western Australia. J Ment Defic Res. 1988;32:59–65. doi: 10.1111/j.1365-2788.1988.tb01388.x. [DOI] [PubMed] [Google Scholar]
- Office for National Statistics Congenital anomaly statistics notifications (Series MB3), No. 1-23; 1988–2010.
- Boyd PA, Armstrong B, Dolk H, et al. Congenital anomaly surveillance in England--ascertainment deficiencies in the national system. BMJ. 2005;330:27. doi: 10.1136/bmj.38300.665301.3A. [DOI] [PMC free article] [PubMed] [Google Scholar]
- Savva GM, Morris JK. Ascertainment and accuracy of Down syndrome cases reported in congenital anomaly registers in England and Wales. Arch Dis Child Fetal Neonatal Ed. 2009;94:F23–F27. doi: 10.1136/adc.2007.135210. [DOI] [PubMed] [Google Scholar]
- Morris JK, Mutton D, Alberman E. Revised estimates of the maternal age specific live birth prevalence of Down's syndrome. J Med Screen. 2002;9:2–6. doi: 10.1136/jms.9.1.2. [DOI] [PubMed] [Google Scholar]
- Henderson A, Lynch SA, Wilkinson S, Hunter M. Adults with Down's syndrome: the prevalence of complications and health care in the community. Br J Gen Pract. 2007;57:50–55. [PMC free article] [PubMed] [Google Scholar]
- Lott IT, Dierssen M. Cognitive deficits and associated neurological complications in individuals with Down's syndrome. Lancet Neurol. 2010;9:623–633. doi: 10.1016/S1474-4422(10)70112-5. [DOI] [PubMed] [Google Scholar]
- Holland AJ, Hon J, Huppert FA, Stevens F, Watson P. Population-based study of the prevalence and presentation of dementia in adults with Down's syndrome. Br J Psychiatry. 1998;172:493–498. doi: 10.1192/bjp.172.6.493. [DOI] [PubMed] [Google Scholar]
Associated Data
This section collects any data citations, data availability statements, or supplementary materials included in this article.


