

Abstract
It has recently been reported (Van Dijk et al., 2011) that in-scanner head motion can have a substantial impact on MRI measurements of resting-state functional connectivity. This finding may be of particular relevance for studies of neurodevelopment in youth, confounding analyses to the extent that motion and subject age are related. Furthermore, while Van Dijk et al. demonstrated the effect of motion on seed-based connectivity analyses, it is not known how motion impacts other common measures of connectivity. Here we expand on the findings of Van Dijk et al. by examining the effect of motion on multiple types of resting-state connectivity analyses in a large sample of children and adolescents (n=456). Following replication of the effect of motion on seed-based analyses, we examine the influence of motion on graphical measures of network modularity, dual-regression of independent component analysis, as well as the amplitude and fractional amplitude of low frequency fluctuation. In the entire sample, subject age was highly related to motion. Using a subsample where age and motion were unrelated, we demonstrate that motion has marked effects on connectivity in every analysis examined. While subject age was associated with increased within-network connectivity even when motion was accounted for, controlling for motion substantially attenuated the strength of this relationship. The results demonstrate the pervasive influence of motion on multiple types functional connectivity analysis, and underline the importance of accounting for motion in studies of neurodevelopment.
Keywords: fMRI, connectivity, network, independent component analysis, fALFF, development, adolescent
1. Introduction
Resting state functional MRI (fcMRI) has been developed as a powerful tool to assess connectivity in large-scale brain networks (Biswal et al., 1995; Fox and Raichle, 2007), and has been used to explore both individual and between-group differences in brain connectivity (Satterthwaite et al., 2010; van den Heuvel et al., 2009; Wolf et al., 2007). However, an important recent study (Van Dijk et al., 2011) has demonstrated that head motion has a confounding effect on fcMRI, whereby increased motion is associated with diminished connectivity between distant nodes while simultaneously increasingly local coupling.
This finding is of particular relevance to imaging studies of neurodevelopment in youth. While it has not been formally examined, it is intuitive that a child's age may be highly related to the ability to stay very still during scanning. Furthermore, past studies have reported that neurodevelopment in youth is associated with increased distant connectivity and reduced local connectivity (Dosenbach et al., 2010; Fair et al., 2007; Fair et al., 2008; Fair et al., 2009). It is noteworthy that this pattern of connectivity change is the inverse of the effect of in-scanner head motion, suggesting that uncontrolled motion might influence estimates of neurodevelopmental trajectories of connectivity. However, several of the most prominent studies of neurodevelopmental connectivity have rigorously matched motion and age, thus reducing the likelihood that reported effects were an artifact of motion (Dosenbach et al., 2010; Fair et al., 2007; Fair et al., 2008). Two other recent studies took a different approach and included a summary measure of subject motion as a confounding variable in the group-level regression (Zuo et al., 2010; Zuo et al., 2011). Nonetheless, the relationship between motion and connectivity in youth has not been previously examined directly. In addition, while Van Dijk et al. demonstrated the effect of motion on seed-based connectivity analyses, it is not known how motion affects other common measures of connectivity including graphical measures of network modularity (Rubinov and Sporns, 2010), independent components analysis (ICA; Beckmann et al., 2005) and power spectrum-based measures such the amplitude of low frequency fluctuation (ALFF; Zang et al., 2007) and the fractional amplitude of low frequency fluctuation (fALFF; Zou et al., 2008).
Our goals in this paper were three-fold. First, we aimed to replicate the results reported by Van Dijk et al. in a completely independent dataset. Second, we extend the analyses presented by Van Dijk et al., and investigate how generalizable the effects of motion are to other analyses of resting-state BOLD data. Specifically, we examine how inter-node distance modulates the effects of motion, and then evaluate the impact of in-scanner head motion on network modularity, network connectivity as measured with dual-regression ICA, and power-spectrum based measures such as ALFF and fALFF. Third and finally, we demonstrate that subject age and motion are highly related, and show the importance of accounting for motion in studies of youth by comparing estimates of the effect of subject age in sub-samples where age and motion are unrelated, related, or when motion is accounted for using regression. As revealed below, motion had marked effects on all measures of connectivity, and had a substantial impact on estimates of connectivity change in youth.
2. Materials and Methods
2.1 Subjects
The present study is a collaboration between the Center for Applied Genomics (CAG) at Children's Hospital of Philadelphia (CHOP) and the Brain Behavior Laboratory at the University of Pennsylvania (Penn). Study procedures were reviewed and approved by the Institutional Review Board of both CHOP and Penn. The target population-based sample is of 10,000 youths who presented to the CHOP network for a pediatric visit and volunteered to participate in genomic studies of complex pediatric disorders. All research participants undergo assessment with a structured neuropsychiatric interview, a neuroscience based computerized neurocognitive battery (Gur et al., 2010), and review of electronic medical records. A subsample of 1,000 subjects is selected for neuroimaging. This report represents an interim analysis of the initial consecutively acquired subjects that underwent neuroimaging, including 456 individuals aged 8-23 years old (mean age 15.6 years; standard deviation 3.4 years); 199 were male. All imaged subjects were recruited as part of the larger study examining neurodevelopmental genomics. Inclusion criteria for the overall study: 1. Able to provide signed informed consent. For participants under age 18 assent and parental consent were required. 2. English proficiency. 3. Physically and cognitively able to participate in computerized neurocognitive testing. Notably, the imaged sample was not recruited on the basis of any specific disorder or symptoms. All imaged subjects were free from active, ongoing medical disorders that would impact brain function; all had normal or corrected-to-normal vision and met no exclusionary criteria for a MRI study.
2.2 Image acquisition
All subject data were acquired on the same scanner (Siemens Tim Trio 3 Tesla, Erlangen, Germany; 32 channel head coil) using the same imaging sequences. Blood oxygen level dependent (BOLD) fMRI was acquired using a whole-brain, single-shot, multi-slice, gradient-echo (GE) echoplanar (EPI) sequence of 124 volumes with the following parameters: TR/TE=3000/32 ms, flip=90°, FOV=192×192 mm, matrix=64×64, slice thickness/gap =3mm/0mm. The resulting nominal voxel size was 3.0×3.0×3.0mm. A fixation cross was displayed as images were acquired. Subjects were instructed to stay awake, keep their eyes open, fixate on the displayed crosshair, and remain still. Prior to time-series acquisition, a 5-minute magnetization-prepared, rapid acquisition gradient-echo T1-weighted (MPRAGE) image (TR 1810ms, TE 3.51 ms, FOV 180×240 mm, matrix 256×192, effective voxel resolution of 1 × 1 × 1mm) was acquired to aid spatial normalization to standard atlas space. Prior to scanning, in order to acclimate subjects to the MRI environment, a mock scanning session was conducted for each individual using a decommissioned MRI scanner and head coil. Mock-scanning was accompanied by acoustic recordings of the noise produced by gradient coils for each scanning pulse sequence. During these sessions, feedback regarding head movement was provided using the MoTrack (Psychology Software Tools, Inc, Sharpsburg, PA) motion tracking system. In order to further minimize motion, subjects' heads were stabilized in the head coil using one foam pad over each ear and a third over the top of the head.
2.3 Assessment of in-scanner head motion
As in Van Dijk et al., our primary measurement of in-scanner head motion was mean relative volume-to-volume displacement. This standard measure summarizes total volume-to-volume translation and rotation across all three axes. While this summary measure was used in all of our analyses, we also examined the correlation between mean relative displacement and other commonly used movement parameters, including maximum relative displacement, standard deviation of relative displacements, maximum absolute displacement, mean absolute displacement, and standard deviation of the absolute displacement. Here, absolute displacement refers to the displacement versus a median reference volume, rather than displacement when compared to the previously acquired volume as in measures of relative displacement.
2.4 Subject sub-samples
As described below (see section 3.5), subject age and subject motion were highly related in the complete sample of 456 subjects, and this sample included subjects with gross motion that would be excluded from any typical analysis. Therefore, in order to examine the effects of motion on connectivity without age being a confounding factor, we selected an age/motion-unrelated subsample of 348 subjects (age range 8-23 years; mean age 16.6 y, SD 3.0 y; 146 male). Following the exclusions of subjects with gross motion (see below), age and motion were still significantly correlated in this age/motion-related subsample. This relationship was driven primarily by young subjects who had high levels of motion (see Figure 5C). By excluding subjects with relatively high levels of motion (i.e., +2SD MRD), this relationship was attenuated (as high motion subjects tended to be younger), but a significant correlation between motion and age remained. Therefore, we next sequentially removed younger subjects with higher levels of motion until the absolute value of the correlation between age and motion was less than or equal to r=0.03. In this sample mean relative displacement was not significantly different among age groups when binned by quartile. We used this age/motion-unrelated subsample for both replication of the within-network effects described by Van Dijk et al., (see section 2.7) as well as the subsequent analyses that investigated approaches beyond within-network connectivity (e.g., modularity, dual-regression ICA, ALFF/fALFF).
Figure 5.

Relationship between age and in-scanner head motion. (A) Relative mean displacement by age of the complete original sample of 456 subjects. (B) Relationship between exclusion threshold and % of sample retained (blue) and the correlation between age and motion at that threshold (red). As the exclusion threshold is made more stringent, the correlation between age and motion is reduced, but study sample size is also reduced. (C) Scatterplot showing the relationship between age and motion in the age/motion-related subsample, where only subjects with gross motion (>0.55 mm mean relative displacement) were removed. Even with the exclusion of subjects with gross motion, age and motion were correlated. (D) Scatterplot showing the relationship between age and motion in the age/motion-unrelated subsample; subject age and motion were uncorrelated in this sample.
As our final aim of this study was to investigate how in-scanner motion might bias estimates of how connectivity changes with age, we compared the effect of age in this age/motion-unrelated sample to a sample where age and motion were related. This age/motion-related sample of 421 subjects (age range 8-23 years; mean age 15.9 y, SD 3.3 y; 181 male) was a subset of the complete sample of 456 subjects, created by simply excluding subjects with gross in-scanner motion, without any attempt to match age and motion. Gross motion was defined as relative mean displacement >0.55mm. While the selection of any exclusion threshold is ultimately arbitrary, this threshold was in line with prior work, and produced a sample that had a similar amount of motion to other large-studies of developmental connectivity (Fair et al., 2008; Fair et al., 2007). Note that these subjects with gross motion (>0.55mm) were excluded from all analyses, and also were not part of the age/motion-unrelated subsample. Summary motion statistics for the inclusive sample and each subsample are presented in Table 1.
Table 1.
| Sample | N | Mean MRD | Standard Deviation MRD |
|---|---|---|---|
|
|
|
|
|
| Entire Sample | 456 | 0.142 | 0.226 |
| Age/motion related sub-sample | 348 | 0.062 | 0.038 |
| Age/motion unrelated sub-sample | 421 | 0.089 | 0.086 |
MRD=mean relative displacement
2.5 General image preprocessing
While each analytic approach required specialized preprocessing, some steps were common to all. All fMRI data processing was conducted using tools that are part of FSL (FMRIB's Software Library, www.fmrib.ox.ac.uk/fsl). BET was used to remove non-brain areas (Smith, 2002). The first four volumes were removed to allow BOLD signal stabilization. All functional timeseries were slice-time corrected, motion corrected to the median image using a tri-linear interpolation with six degrees of freedom (Jenkinson et al., 2002), spatially smoothed (6mm FWHM, isotropic), and grand-mean scaled using mean-based intensity normalization.
2.6 Preprocessing for seed analyses
In additional to the general preprocessing described above (section 2.5), for both within-network and whole-brain seed analyses several additional steps were performed. During preprocessing, data were band-pass filtered to retain frequencies between 0.01Hz and 0.1 Hz (van den Heuvel et al., 2008). As in Van Dijk et al. and multiple prior studies (Andrews-Hanna et al., 2007; Fox et al., 2006; Vincent et al., 2006), we removed the influence of several confounding signals using linear regression. These included: 1) six motion parameters, 2) mean white matter timecourse, 3) mean CSF timecourse, and 4) mean whole-brain timecourse. CSF and white matter timecourses were extracted from subject-specific tissue-segments of the T1-weighted image created using FAST (Zhang et al., 2001). Following regression of confound timecourses, the residual functional timeseries for each subject was co-registered with the anatomical image and transformed to standard anatomical space (T1 Montreal Neurological Institute template, voxel dimensions of 2×2×2 mm) using a non-linear normalization algorithm (FNIRT).
2.7 Replication of Van Dijk et al.: within-network connectivity
We conducted seed-based analyses in order to independently replicate the results reported by Van Dijk et al. (2011). We examined the effect of motion on pairwise connectivity relationships in two of the networks investigated in that study: the default mode network and the frontoparietal control network. In order to replicate their results, we used the same nodes for the default mode network (originally based on Raichle et al., 2001), which included the posterior cingulate cortex (MNI coordinates: 0, −53, 26), medial prefrontal cortex (0, 54, −4), and left and right inferior parietal lobule (−48, −62, 36 and 50, −62, 32).The frontoparietal control network (originally based on Vincent et al., 2008) was also defined as per Van Dijk et al. (2011), and included the anterior prefrontal cortex (−36, 57, 3 and 36, 57, 3) and inferior parietal lobule (−44,−52, 54 and 48, −50, 52). Data were preprocessed as described in sections 2.5 and 2.6. Subsequently, at each ROI, we extracted the mean timecourse of the standard-space residual timeseries. This ROI timeseries was correlated with the timeseries for every other ROI within each network using Pearson's correlations, generating a connectivity matrix describing each network for every subject. In order to improve normality, a Fisher's r-to-z transformation was applied prior to statistical testing. As in Van Dijk et al., averaging across all within-network connections created a composite of total within-network connectivity; this average value was correlated with mean relative displacement. Nonlinear effects were investigated using quadratic regression. All statistical analyses of non-voxelwise data were conducted in Matlab 7.11 (Math Works, Natick, MA, USA) using the Statistical Toolbox. Unless specified otherwise, alpha for all comparisons was set to p=0.05.
2.8 Whole-brain network definition
Next, in order to further examine the effect of motion on measures of whole-brain network topology, we calculated the pairwise connectivity relationship among a much larger set of ROIs that covered the entire brain. Recent evidence suggests that anatomic ROIs may contain functionally heterogeneous sub-regions, leading to the mixing of disparate signals, with resultant negative consequences for network estimation (Smith et al., 2011). Accordingly, we used 160 ROIs (5mm radius spheres) that were derived from a meta-analysis of a large sample of task-based fMRI studies (Dosenbach et al., 2010). Subsequent processing was otherwise the same as above.
2.9 Modulation of motion effects by inter-node distance
Van Dijk et al. demonstrated that motion causes increased nonspecific coupling at ranges <12mm compared to longer ranges, but did not quantify the effect of motion on connectivity over a full range of node distances. Using the 160×160 connectivity matrix, we explored the degree to which inter-node distance modulates the effect of motion on a continuous basis.Mean relative displacement was correlated across subjects with the connectivity measure for every node pair, generating a second-level 160×160 correlation matrix containing 12,720 unique cells. This matrix described how motion impacted pairwise connectivity. In order to establish how distance influenced this relationship, a linear mixed effect regression model was fit using inter-node distance as a fixed factor. Node variability was modeled as a random factor. To ascertain if non-linear effects were present, a second model was run that included both linear and quadratic effects of distance. In addition, this effect was examined separately in positive and negative connections. Lastly, to examine the influence of subject age, we conducted the analyses separately in younger and older subjects as defined by a median split of subject age.
2.10 Modularity analysis
Within the whole-brain network of 160 ROIs, we evaluated the effect of motion on network modularity. Modularity provides a measure of the degree to which a given set of nodes can be parsed into coherent sub-networks (Rubinov and Sporns, 2010). Prior studies of network topology have used thresholded correlation matrices (Achard et al., 2006; Bassett et al., 2008). However, threshold choice may be arbitrary, and significantly impacts estimates of network topology (Rubinov and Sporns, 2011). We therefore used the threshold-free modularity analysis recently introduced by Rubinov and Sporns (2011), part of the Brain Connectivity Toolbox (https://sites.google.com/a/brain-connectivity-toolbox.net/). This measure allows estimation of modularity (using the Louivan algorithm) for fully connected networks with positive and negative weights. Modularity was linearly related to relative mean displacement using Pearson's correlations. Nonlinear effects were evaluated with quadratic regression.
2.11 Independent component analyses
Temporal concatenation group independent component analysis (TC-GICA) was conducted on the age/motion related sample using MELODIC (Beckmann et al., 2005). Prior to TC-GICA, in addition to the general preprocessing steps described above (Section 2.5), data were high pass filtered (0.01Hz) to remove drift, spatially smoothed at 6mm FWHM, and resampled to 4mm isotropic voxels in MNI template space. Component dimensionality was estimated automatically. All components resulting from TC-GICA were submitted for subsequent dual-regression analysis. We focused our analysis on three commonly-observed components, corresponding to the default mode network, the right-lateralized frontoparietal control network, and the dorsal attention network (Biswal et al., 2010; Damoiseaux et al., 2006; Smith et al., 2009; Zuo et al., 2010b; see section 3.4). As part of the dual-regression procedure (Biswal et al., 2010; Filippini et al., 2009; Zuo et al., 2010b), all group-level components were first used as a spatial regressor for the participant's functional data, resulting in a timeseries for each component reflecting how closely the functional data spatially resembled the component at each timepoint. Next, these timeseries was together fed into a second regression as a temporal regressor for the functional data (effectively functioning as a complex seed), producing subject-level spatial maps of component connectivity containing both positive and negative values. These subject-level maps were subjected to a final group-level regression analysis examining the effect of motion (see section 2.13).
2.12 ALFF and fALFF
In contrast to seed-based or pairwise approaches, ALFF and fALFF provide a measure of low frequency oscillations that contribute to connectivity but are fundamentally different from between-region measures of connectivity (Zuo et al., 2010a). ALFF measures the amplitude of low frequency oscillations, while fALFF measures the relative predominance of low frequency amplitude to the amplitude of all oscillations across the entire power spectrum (Zou et al., 2008).fALFF has greater specificity than ALFF in that it is less susceptible to artifact in the ventricles and near large blood vessels (Zou et al., 2008; Zuo et al., 2010a); however, both measures have been found to have high test-retest reliability (Zuo et al., 2010a). Prior to calculation of ALFF and fALFF, data underwent general preprocessing as described in section 2.5. fALFF was calculated as described by Zuo et al. (2010a), and was implemented using scripts written by Biswal et al. (2010) as part of the 1000 functional connectomes project (www.nitrc.org/projects/fcon_1000/). Briefly, at each voxel, ALFF is the sum of amplitudes within a specified low-frequency range of oscillations (0.01-0.1 Hz). In contrast, fALFF is calculated as the sum of amplitudes within this range compared to the total sum of amplitudes across the entire frequency range. Prior to group level analyses, all subject-level ALFF and fALFF maps were Z-transformed to improve normality, and registered to a 2mm MNI template as above. In order to provide an estimate of the effect size of motion on both ALFF and fALFF, we averaged ALFF or fALFF signal across all gray matter voxels in template space (using the Harvard-Oxford atlas, thresholded at probability >0.25) and correlated this average cortical ALFF or fALFF value with mean relative displacement. As above, nonlinear effects were investigated using quadratic regression.
2.13 Voxelwise group level analyses of motion
Subject-level ICA dual regression maps and ALFF/fALFF maps were subjected to identical group-level analysis procedures. Group-level analyses were performed in the age/motion-related sample using a GLM where three regressors were included: age, sex, and mean relative displacement. Mean relative displacement was the effect of interest. All group-level voxelwise analyses were conducted using non-parametric permutation testing methods implemented using RANDOMISE (Nichols and Holmes, 2002). Type I error was controlled with threshold-free cluster enhancement (TFCE); clusters of 100 voxels above a corrected p value <0.01 were considered significant and reported in the text. For display, images were rendered on a cortical map of the right hemisphere using Caret V5.6 (Van Essen et al., 2001). All figures display uncorrected, unmasked t-statistic maps.
2.14 Relevance of motion to estimation of relationship between age and connectivity
While the above analyses used an age/motion related sample to investigate how in-scanner motion impacted multiple different analytic approaches, the final aim of the paper was to examine how in-scanner motion was related to age, and might impact estimates of how connectivity changes with age. Therefore, the relationship between relative mean displacement and age was assessed in the initial inclusive sample of 456 subjects, and each sub-sample (related and unrelated) using Pearson's correlations. In order to establish the relationship between inclusion threshold and sample size, we plotted the percent of the original sample retained using exclusion thresholds ranging from 0mm to 1mm mean relative displacement. In addition, we examined the effect of exclusion threshold on the correlation between age and motion over the same range of exclusion thresholds.
Next, we examined the potential confounding effects motion might have on studies of the relationship between age and connectivity. Prior investigations have highlighted the association of age with increased long-range connectivity of cortical hubs involved in higher-order mental processes (Fair et al., 2007; Fair et al., 2008), and more generally demonstrated that with age short-range connectivity decreases whereas long-range connectivity is enhanced (Dosenbach et al., 2010).We examined age effects on a voxelwise basis from the seed region in the posterior cingulate cortex described above. We chose to examine the effects of age using this specific analysis as such a voxelwise approach is sensitive to the modulation of the effects of age by distance. The voxelwise approach chosen here may be more prone to type I error, but this was controlled using the same statistical thresholding as used for the other voxelwise analyses (TFCE corrected p<0.01; see section 2.13). Voxelwise PCC time-series analysis was carried out using FILM with local autocorrelation correction as implemented in FEAT (Woolrich et al., 2001). As in the pairwise seed analyses, we included confound regressors in the GLM in addition to the PCC timecourse (e.g., motion parameters, mean white matter timecourse, mean CSF timecourse, and mean whole-brain timecourse). To investigate motion's impact on the estimate of the effect of age, we conducted three group-level analyses. First, we examined the effect of age without controlling for motion in the age/motion-related sample (n=421).We compared this to two analyses where motion was accounted for: an analysis of age in the age/motion-unrelated sample (n=348), and an analysis of age in the age/motion-related sample with each subject's mean relative displacement included in the group-level regression as a confound variable (“motion regressed”). Group level statistics were conducted with RANDOMISE using the procedures described above (see section 2.13). For further illustration, we also report correlation and partial correlation values between the PCC seed and the MPFC ROI for each sample. It should be noted that as these sub-samples were overlapping, in this descriptive analysis direct statistical testing between subsamples was not conducted.
3. Results
3.1 Replication of the effect of motion on within-network connectivity
In the age/motion-unrelated sample, we replicated the findings of Van Dijk et al.: motion diminished average within-network connectivity for both the default mode network and the frontoparietal control network. Specifically, mean relative displacement was negatively correlated with average connectivity in the default mode network (r=-0.12, p=0.01).The effect of motion on the average connectivity within the frontoparietal control network was similar (r=-0.11, p=0.02). No significant nonlinear effects were found in either network.
3.2 The effect of motion is modulated by distance and reduces network modularity
Next, we used a set of ROIs covering the entire brain to investigate the modulating effect of inter-node distance on the effect of motion. Euclidean distance among these 12,720 pairwise connections was robustly related to the effect of motion). The linear mixed effects model revealed a significant inverse relationship between distance and motion (Figure 1; r=-0.50; p<1.00×10⁻²⁵). Inclusion of a quadratic term for internode distance did not reveal a significant nonlinear association of distance and motion (p = 0.41). A linear fit of this effect revealed that motion increased connectivity for distances less than 95.61mm, but diminished connectivity for greater distances. Among the 160 ROIs used, 29.5% of connections were separated by at least this distance. This effect was present when positive connections (r=-0.56,) and negative connections (r=-0.51) were considered separately. The effect was equally present in both younger (r=-0.46) and older subjects (r=-0.47) when the sample was split by median subject age. Motion was additionally associated with reduced network modularity (Figure 2; r=-0.38, p=1.58×10⁻¹³). No significant nonlinear effects of motion on network modularity were present.
Figure 1.

The effect of motion is modulated by inter-node Euclidean distance. Motion tends to increase connectivity for locally adjacent nodes, but reduce connectivity between distant nodes.
Figure 2.

Motion reduces network modularity.
3.3 Dual regression ICA is impacted by motion
The number of components generated by TC-GICA (23 components) was consistent with other low-dimensional ICA analyses conducted on large-scale datasets. We selected three well-described ICA components for subsequent analysis with dual regression (Figure 3): the default mode-network, the (right-lateralized) frontoparietal control network, and the dorsal attention network. Group-level regression of subject-level dual regression maps demonstrated that in-scanner motion had a marked impact on subject-level estimates of connectivity for each network. In the default mode network (Figure 3B), motion was associated with altered connectivity with a large cluster including bilateral parietal and temporal cortex as well as subcortical white matter (12,205 4mm isotropic voxels; center of gravity MNI coordinates 2, -26, 12).Motion also had a strong impact on connectivity with the frontoparietal network (Figure 3D), significantly altering between that network and a large cluster of regions spanning frontal, parietal, and temporal cortex (13,372 voxels; center of gravity 18, -18, 20); motion influenced connectivity with left parietal and temporal cortex as well (1,102 voxels; center of gravity-42, -30, 0). Finally, motion also significantly impacted dorsal attention network connectivity (Figure 3F), altering connectivity with a large cluster including bilateral frontal, parietal, and temporal cortex (12,875 voxels; center of gravity 6, -30, 12). Alterations in connectivity were mainly seen in component-positive voxels (Supplementary Figure 1).
Figure 3.

Effect of motion on dual-regression of independent components analysis networks. Three common networks were selected from the TC-GICA: the default mode network (A), the right-lateralized frontoparietal control network (C), and the dorsal attention network (E). Group level analysis of subject-level dual regression maps demonstrated that motion impacted estimates of connectivity for each network (B, D, and F).
3.4 ALFF and fALFF are influenced by motion
The average ALFF and fALFF maps produced in the age/motion-unrelated sample accord with prior reports, with the highest ALFF and fALFF seen in cortical gray matter (Figures 4A and 4D). Increased motion was associated with diminished ALFF in a large bilateral cluster centered on the posterior cingulate cortex (50,202 2mm isotropic voxels; center of gravity -4, -26, 20; Figure 4B). Motion was also associated with smaller regions of increased ALFF in the ventral orbitofrontal cortex (4,779 voxels; 20, 30, -16) and bilateral posterior cerebellum (1,630 voxels; -4, -82, -36). Overall, motion was associated with diminished average grey-matter ALFF (r=-0.11; p=0.036; Figure 4C).No nonlinear effects of motion on average grey matter ALFF were found. The effects of motion on fALFF were even more prominent: fALFF was robustly reduced by motion throughout the cortex (Figure 4E; 76,892 voxels; 2, -26, 12). This effect was not regional: the mean fALFF signal in gray matter was highly related to motion (Figure 4F; r=-0.59, p= 2.62×10⁻²⁴). No significant nonlinear effects were detected. Motion also was associated with a significant increase of fALFF in ventral subcortical white matter and the brainstem (13,540 voxels; 2, -22, -22).
Figure 4.

Effect of motion on ALFF and fALFF. (A) Mean ALFF map. (B) Motion reduces ALFF in midline regions including the posterior cingulate. (C) Motion weakly influences mean gray-matter ALFF. (D) Mean gray-matter fALFF. (E) Motion reduces fALFF throughout the cortex. (C) Motion strongly impacts average gray-matter fALFF.
3.5 In-scanner motion is related to subject age, and failure to control for motion inflates estimates of the effect of age on connectivity
As in Van Dijk et al., relative mean displacement was our primary summary measure of motion. As expected, relative mean displacement was correlated with all motion measures evaluated (Supplementary Table 1).In the complete sample of 456 subjects, age was related to in-scanner head motion (r=-0.34, p=2.2×10⁻¹⁴, Figure 5A). Selection of a threshold for exclusion due to gross motion had predictable consequences on the proportion of the original sample retained, with smaller samples resulting from more stringent thresholds (Figure 5B). The selection of an exclusion threshold also had an impact on the correlation between motion and age: more rigorous exclusion thresholds ameliorated, but did not eliminate the correlation between age and motion. Indeed, correlations of r>0.10 between age and motion were present at all exclusion thresholds above 0.07mm relative mean displacement. However, a threshold of 0.07mm mean relative displacement would exclude 45% of the original sample, reducing the practical utility of such a strategy. In contrast to the age/motion-unrelated subsample used for the analyses above (Figure 5D), in the age/motion-related subsample (after exclusion of gross motion of mean relative displacement >0.55mm), the size of the correlation between age and motion remained quite significant (r=-0.34, p=7.13×10⁻¹³, Figure 5C).
In this age/motion-related subsample (Figure 6A) when motion was not accounted for, increased age was associated with enhanced connectivity between the PCC and the medial prefrontal cortex (14,812 2mm isotropic voxels; -2, 36, 18). Additionally, in this subsample subject age was associated with diminished connectivity in a large cluster including occipital and parietal regions close to the PCC (24,188 voxels; 8, -30, 24).These age effects remained significant but were attenuated in both the age/motion-regressed analysis (Figure 6B) where motion was included as a confounding variable in the group level analysis, as well as the age/motion-unrelated subsample (Figure 6C). In the motion regressed analysis, age was associated with increased connectivity with a reduced region of medial prefrontal cortex (3,117 voxels; -2, 40, 12) and left frontal pole (155 voxels; -20, 54, 8); connectivity declined with age in a subset of regions surrounding the PCC seed (3,136 voxels; -20, -8, 20) and in the right insula (1,107 voxels; 50, 6, 2). In the age/motion-unrelated sample, results were similar: there was increased connectivity with age in the medial prefrontal cortex (2,283 voxels; -2, 44, 2) and the right caudate (114 voxels; 14, 14, 0). Connectivity also diminished near the PCC seed in the age/motion-unrelated subsample in association with age, but only at subthreshold levels.
Figure 6.
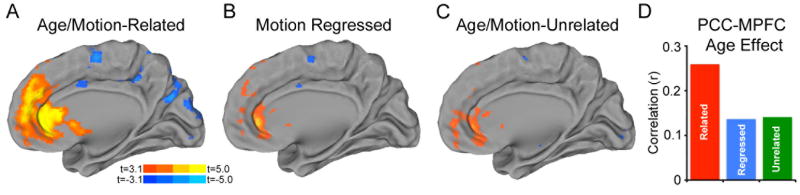
Effect of motion on estimates of age-related connectivity change from a posterior cingulate seed. In a sample of 421 subjects where age and motion were related, increasing subject age was associated with increased connectivity between the PCC and the MPFC (A). This effect, while still significantly present, was attenuated when motion was included as a confound regressor in the group level analysis (B) or when the age/motion-unrelated subsample of 348 subjects was used (C). The correlation of age with pairwise PCC-MPFC connectivity was reduced substantially when motion was taken into account (D).
When the pairwise correlation values between the PCC and MPFC were examined specifically (Figure 6D), the effect of age was also strongest in the age/motion-related sample (r=0.26,p=6.95×10⁻⁸).This effect was nearly halved in both the age/motion-unrelated subsample (r=0.14, p=0.0085) and in the age/motion-related subsample when motion was included in a partial correlation (r=0.14, p=0.0050).
4. Discussion
In this study we examined the effect of in-scanner head motion on measures of functional connectivity in a large sample of children and adolescents. After replicating the findings of Van Dijk et al., we conducted additional analyses and demonstrated that in-scanner motion influences multiple measures of connectivity beyond seed analyses. Additionally, we demonstrated that motion is highly related to subject age, and that motion can impact estimates of the relationship between connectivity and subject age. The results of this study establish that motion influences all common analyses of fcMRI data, and indicate that this confound is of particular importance for studies of neurodevelopment in youth.
4.1 Impact of motion on pairwise seed analyses
Using nearly identical analysis procedures, we replicated the findings of Van Dijk et al., showing that motion reduced within-network connectivity in specific seed-based brain networks. Additional analyses further characterized the effect of motion by using an expanded set of ROIs that cover the entire brain (Dosenbach et al., 2010), allowing quantification of the modulating effect of distance on the motion-connectivity relationship. This analysis showed that motion influences connectivity to a degree that is linearly related to inter-node Euclidean distance (Figure 1). For both positive and negative connections, motion increases the correlation for nodes that are closer together, but diminishes connectivity (even causing anticorrelations) for voxels that are farther apart. Van Dijk et al. (2011) compared local versus distant connectivity using a binary threshold of 12mm; our results suggest that motion transitions from causing increased connectivity to decreased connectivity at a much greater distance (96mm). Therefore, except for a minority of particularly distant connections (29.5%), motion will tend to increase connectivity between nodes. However, as large-scale brain networks involved in higher-order cognitive processes are modular (see below) and spatially distributed (Vincent et al., 2008), such long-range connections may be of particular interest. We suspect that the modulation of the effect of motion by distance is driven by the differential displacement of individual voxels in the brain during head motion: voxels that are close together will tend to move and disturb BOLD signal to a similar degree, whereas voxels that are far apart may move in substantially different ways given the pivot-action of rotations about the neck. Ongoing work explores this effect on a mechanistic basis with simulated and real data (Wolf et al., In Preparation).
4.2 Influence of motion on modularity
Brain networks are composed of pairwise relationships between multiple nodes (Bullmore and Sporns, 2009). However, relating these pairwise relationships to subject level data (age, symptoms, etc) can be challenging due to the proliferation of multiple comparisons associated with increasing number of nodes. Graphical measures such as modularity provide useful summary metrics of network topology (Rubinov and Sporns, 2010), and have been increasingly used to investigate brain connectivity in neuropsychiatric populations (Bassett et al., 2008; Lynall et al., 2010). Here we found that motion reduced network modularity (Figure 2). This effect follows from the distance-related action of motion described above: to the degree that network modules describe large-scale brain systems that are spatially distributed, motion's effects (increasing local connectivity and diminishing distant connectivity) would be expected to add noise and diminish modular organization. It should be noted that a paper published while this work was under review found similar results (Power et al., 2011). This effect is of particular importance for investigations of connectivity in youth (see section 4.4).
4.3 Impact of motion on dual-regression ICA and ALFF/fALFF
While seed-based connectivity analyses remain the most common way of approaching rs-fMRI data, alternative methods have seen wide use (Damoiseaux et al., 2006; Calhoun et al., 2009). Two of the most prominent alternative approaches are ICA and power spectrum based methods such as ALFF and fALFF. Previously, no study has examined the effect of in-scanner motion on either of these methods. In ICA of fcMRI data, the most common approach is TC-GICA, where all subjects' timeseries data are first temporally concatenated prior to performing a group-level ICA (Beckmann et al., 2005; Calhoun et al., 2001). Typically, multiple components resulting from TC-GICA are “noise” components, usually attributed to in-scanner motion or non-neuronal physiological signals arising from respiration or cardiovascular pulsations (Damoiseaux et al., 2006). As noise signals are split off into their own components, it has been postulated that ICA analyses may be less vulnerable to motion artifact; indeed, ICA has been used for single-subject denoising of artifactual signals induced by motion (Kochiyama et al., 2005; Liao et al., 2006).
However, TC-GICA does not provide an estimate of a given component's strength in an individual subject, which is often of interest for analyses of individual or between group-differences. In one approach that was implemented in this study, the strength of a group-level ICA component map is estimated in an individual subject using a two-stage spatio-temporal regression (“dual-regression”; Biswal et al., 2010; Filippini et al., 2009; Zuo et al., 2010b). However, this process ultimately treats the group ICA components as a complex, weighted seeds in a multiple regression not unlike traditional seed based methods, rendering the approach similarly vulnerable to systematic influence by in-scanner head motion. Our results indicate that motion had a marked impact on connectivity estimates produced by dual-regression ICA (Figure 3). While our results establish the effects of motion on dual-regression ICA, it should be noted that other methods exist for estimating component strength in individual subjects (Erhardt et al., 2010); future work is necessary to evaluate the relative susceptibility of different methods to the confounding effects of motion.
Power-spectrum metrics such as the amplitude of low-frequency fluctuation (ALFF) and the related fractional amplitude of low-frequency fluctuation (fALFF) represent a qualitatively different approach from either seed based analyses or ICA (Yang et al., 2007; Zou et al., 2008; Zuo et al., 2010b; Zang et al., 2007). Development of these methods was based on the original observation that most resting-state functional connectivity occurs at very low frequency (typically <0.1Hz) (Biswal et al., 1995).Subsequent reports illustrated that regions with a high ALFF/fALFF are typically cortical regions that also tend to have high levels of functional connectivity. Both ALFF and fALFF have been found to have good test-retest reliability (Zuo et al., 2010a). Thus, ALFF and fALFF provide voxelwise measures of the power of low-frequency oscillations, at a fraction of the processing time required for voxelwise connectivity analysis using traditional pairwise comparisons (Buckner et al., 2009; van den Heuvel et al., 2008). Due to such considerations, ALFF and fALFF have been increasingly used as part of both large-scale neuroimaging efforts and smaller studies of psychopathology (Zuo et al., 2010a; Biswal et al., 2010).However, the influence of head motion on ALFF or fALFF has not previously been investigated. We found that motion has an impact on ALFF but an even more marked influence on fALFF, reducing it throughout the cortex (Figure 4). This may occur in part because motion introduces high-frequency artifact into the data, altering the ratio of low frequency to high frequency signal that fALFF represents.
4.4 Implications for studies of neurodevelopment in youth
In-scanner head motion is particularly relevant for studies of neurodevelopment (Church et al., 2010). Although it is intuitively obvious, to our knowledge this study is the first to demonstrate that in-scanner motion is inversely correlated with subject age in youth (Figure 5). Accordingly, the average motion in this sample was higher than studies of adults such as Van Dijk et al., (2011); however, subject motion was quite similar to previously published report studying youth (Fair et al., 2008). The relationship between age and motion was present despite the use of multiple measures to reduce motion during data acquisition, including a mock-scanning procedure with real-time feedback as well as physical head stabilization. Importantly, this confound cannot practically be dealt with by simply excluding subjects with gross motion: in the sample of 421 subjects where gross motion was excluded using a typical threshold, mean relative displacement was still highly related to age (Figure 5C). Furthermore, use of a lower threshold does not obviate this confound, as motion was related to age above all but the most conservative (0.07 mm) exclusion threshold.The use of progressively more stringent exclusion thresholds is a relatively undesirable strategy, as it reduces sample size in a predictable fashion (Figure 5B).
Prior studies of neurodevelopment in youth have reported effects of age on connectivity that are qualitatively similar to the effects of motion described here (Fair et al., 2007; Fair et al., 2008; Dosenbach et al., 2010). In particular, development has been associated with “segregation and integration” of brain networks, with advancing age being correlated with increased long-range within-network connectivity and diminished short-range and out-of-network connectivity (Dosenbach et al., 2010; Fair et al., 2007; Fair et al., 2008; Fair et al., 2009). Importantly, these studies have rigorously matched age and motion. However, previous investigations have not reported how motion might influence estimates of the effect of subject age on connectivity. In order to directly investigate this, we compared connectivity between a PCC seed and the rest of the brain in three analyses (suggested by Church et al., 2010 and Van Dijk et al., 2011), including samples where age and motion were unrelated, age and motion were related, and age and motion were related but motion was regressed as a confound as part of the group-level analysis (Figure 6). Our findings replicate prior reports of developing connectivity in youth (Dosenbach et al., 2010; Fair et al., 2009), demonstrating that increasing age is associated with enhanced long-range connectivity (primarily between the PCC and MPFC) and diminished out-of-network (primarily short-range) connectivity. However, descriptive comparison of age-motion related, unrelated, and regressed samples demonstrated that the effect of age in the age/motion-related sample was nearly double the effect seen in the unrelated or regressed samples.These results are the direct consequence of the fact that motion and age can produce similar effects, and caution that not accounting for motion in studies of development will lead to inflated estimates of the effect of age.
4.5 Conclusions, limitations, and future directions
This study establishes that in-scanner motion impacts functional connectivity as measured by multiple common types of analyses. This is a particularly problematic confound for studies where motion is related to the effect of interest. While here we focused on the relevance of this issue for studies of neurodevelopment in youth, this problem is likely to also impact studies of psychopathology where disease state or symptom load may be associated with increased (or decreased) motion. This confound is particularly pernicious for studies where a diminished ability to remain still is inherently an effect of interest (e.g., attention-deficit hyperactivity disorder). In such situations, it may be difficult or even impossible to disentangle the confounding effects of motion from the effect of interest. In other situations, the effect of motion may be accounted for using matching or regression. Notably, two recent studies by Zuo et al. (2010, 2011) explicitly accounted for both linear effects of motion and higher-order effects (such as the temporal derivative of motion) in their group-level regression model. Further exploration of higher-order summary measures of motion is needed in future work. Nonetheless, both matching and regression approaches have their own limitations. Matching may introduce a new confound by potentially selecting for non-representative sub-populations. For example, by comparing unusually still children to relatively more motion-prone adults, potentially important developmental effects of interest may be obscured. Similarly, regression will reduce the ability to detect a significant effect in direct proportion to the strength of the correlation between motion and the effect of interest.
Notably, both motion matching and regression can only hope to control for linear effects. Van Dijk et al. demonstrated the presence of nonlinear effects in certain analyses, but not others. Replicating their results in part, we similarly did not find evidence for nonlinear effects on average frontoparietal network and default mode network connectivity. In addition, we did not find significant nonlinearities in the influence of motion on network modularity or average grey-matter ALFF/fALFF. The data from this study and Van Dijk et al. suggest that the presence of nonlinear effects may in some part be due to the spatial location of network nodes. Further work is needed to further define what nodes and pairwise relationships are most susceptible to nonlinear effects of motion.
Moving forward, as articulated previously (Van Dijk et al., 2011), a more desirable approach would not just account for motion but also reduce its occurrence in the scanner, and deploy processing techniques that minimize its effects. Improvements in modeling the effect of motion on the BOLD signal remain an active area of research (Tohka et al., 2008; Jo et al., 2010). In particular, given the results presented here, further mechanistic understanding of how motion impacts connectivity is necessary to model it more effectively.
In summary, the results of this study highlight the confounding effects of motion on common analyses of functional connectivity. They suggest that motion should be explicitly reported and accounted for in any comparison of connectivity between groups or across individuals. Such effects are of particular importance for studies of neurodevelopment in youth, where age and motion are highly correlated. A failure to account for the effects of motion may result in inflated estimates of connectivity change with age.
Supplementary Material
Effect of motion on dual-regression ICA, split by component-positive and component-negative voxels. Motion effects are primarily seen in component-positive voxels.
Correlation matrix of motion summary measures.
Box 1. Article Highlights.
In children and adolescents, motion and age are highly related.
Motion impacts multiple common measures of functional connectivity.
Failure to account for motion may inflate estimates of the effect of age.
Acknowledgments
Thanks to Monica Calkins, Jan Richard, and Rosetta Chiavacci for assistance with assessment and recruitment.
Financial Support: Supported by grants from the National Institute of Mental Health MH MH089983, MH089924, and T32 MH019112. Drs. Satterthwaite and Wolf were supported by APIRE and NARSAD.
Footnotes
Disclosures: Drs. Gur report investigator-initiated grants from Pfizer and AstraZeneca. All other authors report no disclosures.
Publisher's Disclaimer: This is a PDF file of an unedited manuscript that has been accepted for publication. As a service to our customers we are providing this early version of the manuscript. The manuscript will undergo copyediting, typesetting, and review of the resulting proof before it is published in its final citable form. Please note that during the production process errors may be discovered which could affect the content, and all legal disclaimers that apply to the journal pertain.
References
- Achard S, Salvador R, Whitcher B, Suckling J, Bullmore E. A resilient, low-frequency, small-world human brain functional network with highly connected association cortical hubs. J Neurosci. 2006;26:63–72. doi: 10.1523/JNEUROSCI.3874-05.2006. [DOI] [PMC free article] [PubMed] [Google Scholar]
- Andrews-Hanna JR, Snyder AZ, Vincent JL, Lustig C, Head D, Raichle ME, Buckner RL. Disruption of large-scale brain systems in advanced aging. Neuron. 2007;56:924–935. doi: 10.1016/j.neuron.2007.10.038. [DOI] [PMC free article] [PubMed] [Google Scholar]
- Bassett DS, Bullmore E, Verchinski BA, Mattay VS, Weinberger DR, Meyer-Lindenberg A. Hierarchical organization of human cortical networks in health and schizophrenia. J Neurosci. 2008;28:9239–9248. doi: 10.1523/JNEUROSCI.1929-08.2008. [DOI] [PMC free article] [PubMed] [Google Scholar]
- Beckmann CF, DeLuca M, Devlin JT, Smith SM. Investigations into resting-state connectivity using independent component analysis. Philos Trans R Soc Lond B Biol Sci. 2005;360:1001–1013. doi: 10.1098/rstb.2005.1634. [DOI] [PMC free article] [PubMed] [Google Scholar]
- Biswal B, Yetkin FZ, Haughton VM, Hyde JS. Functional connectivity in the motor cortex of resting human brain using echo-planar MRI. Magn Reson Med. 1995;34:537–541. doi: 10.1002/mrm.1910340409. [DOI] [PubMed] [Google Scholar]
- Biswal BB, Mennes M, Zuo XN, Gohel S, Kelly C, Smith SM, Beckmann CF, Adelstein JS, Buckner RL, Colcombe S, Dogonowski AM, Ernst M, Fair D, Hampson M, Hoptman MJ, Hyde JS, Kiviniemi VJ, Kötter R, Li SJ, Lin CP, Lowe MJ, Mackay C, Madden DJ, Madsen KH, Margulies DS, Mayberg HS, McMahon K, Monk CS, Mostofsky SH, Nagel BJ, Pekar JJ, Peltier SJ, Petersen SE, Riedl V, Rombouts SA, Rypma B, Schlaggar BL, Schmidt S, Seidler RD, Siegle GJ, Sorg C, Teng GJ, Veijola J, Villringer A, Walter M, Wang L, Weng XC, Whitfield-Gabrieli S, Williamson P, Windischberger C, Zang YF, Zhang HY, Castellanos FX, Milham MP. Toward discovery science of human brain function. Proc Natl Acad Sci U S A. 2010;107:4734–4739. doi: 10.1073/pnas.0911855107. [DOI] [PMC free article] [PubMed] [Google Scholar]
- Buckner RL, Sepulcre J, Talukdar T, Krienen FM, Liu H, Hedden T, Andrews-Hanna JR, Sperling RA, Johnson KA. Cortical hubs revealed by intrinsic functional connectivity: mapping, assessment of stability, and relation to Alzheimer's disease. J Neurosci. 2009;29:1860–1873. doi: 10.1523/JNEUROSCI.5062-08.2009. [DOI] [PMC free article] [PubMed] [Google Scholar]
- Bullmore E, Sporns O. Complex brain networks: graph theoretical analysis of structural and functional systems. Nat Rev Neurosci. 2009;10:186–198. doi: 10.1038/nrn2575. [DOI] [PubMed] [Google Scholar]
- Calhoun VD, Adali T, Pearlson GD, Pekar JJ. Spatial and temporal independent component analysis of functional MRI data containing a pair of task-related waveforms. Hum Brain Mapp. 2001;13:43–53. doi: 10.1002/hbm.1024. [DOI] [PMC free article] [PubMed] [Google Scholar]
- Calhoun VD, Liu J, Adali T. A review of group ICA for fMRI data and ICA for joint inference of imaging, genetic, and ERP data. Neuroimage. 2009;45:S163–S172. doi: 10.1016/j.neuroimage.2008.10.057. [DOI] [PMC free article] [PubMed] [Google Scholar]
- Church JA, Petersen SE, Schlaggar BL. The “Task B problem” and other considerations in developmental functional neuroimaging. Hum Brain Mapp. 2010;31:852–862. doi: 10.1002/hbm.21036. [DOI] [PMC free article] [PubMed] [Google Scholar]
- Damoiseaux JS, Rombouts SA, Barkhof F, Scheltens P, Stam CJ, Smith SM, Beckmann CF. Consistent resting-state networks across healthy subjects. Proc Natl Acad Sci U S A. 2006;103:13848–13853. doi: 10.1073/pnas.0601417103. [DOI] [PMC free article] [PubMed] [Google Scholar]
- Dosenbach NU, Nardos B, Cohen AL, Fair DA, Power JD, Church JA, Nelson SM, Wig GS, Vogel AC, Lessov-Schlaggar CN, Barnes KA, Dubis JW, Feczko E, Coalson RS, Pruett JR, Barch DM, Petersen SE, Schlaggar BL. Prediction of individual brain maturity using fMRI. Science. 2010;329:1358–1361. doi: 10.1126/science.1194144. [DOI] [PMC free article] [PubMed] [Google Scholar]
- Erhardt EB, Rachakonda S, Bedrick EJ, Allen EA, Adali T, Calhoun VD. Comparison of multi-subject ICA methods for analysis of fMRI data. Hum Brain Mapp. 2010 doi: 10.1002/hbm.21170. [DOI] [PMC free article] [PubMed] [Google Scholar]
- Fair DA, Cohen AL, Dosenbach NUF, Church JA, Miezin FM, Barch DM, Raichle ME, Petersen SE, Schlaggar BL. The maturing architecture of the brain's default network. Proceedings of the National Academy of Sciences. 2008;105:4028. doi: 10.1073/pnas.0800376105. [DOI] [PMC free article] [PubMed] [Google Scholar]
- Fair DA, Cohen AL, Power JD, Dosenbach NU, Church JA, Miezin FM, Schlaggar BL, Petersen SE. Functional brain networks develop from a “local to distributed” organization. PLoS Comput Biol. 2009;5:e1000381. doi: 10.1371/journal.pcbi.1000381. [DOI] [PMC free article] [PubMed] [Google Scholar]
- Fair DA, Dosenbach NU, Church JA, Cohen AL, Brahmbhatt S, Miezin FM, Barch DM, Raichle ME, Petersen SE, Schlaggar BL. Development of distinct control networks through segregation and integration. Proc Natl Acad Sci U S A. 2007;104:13507–13512. doi: 10.1073/pnas.0705843104. [DOI] [PMC free article] [PubMed] [Google Scholar]
- Filippini N, MacIntosh BJ, Hough MG, Goodwin GM, Frisoni GB, Smith SM, Matthews PM, Beckmann CF, Mackay CE. Distinct patterns of brain activity in young carriers of the APOE-epsilon4 allele. Proc Natl Acad Sci U S A. 2009;106:7209–7214. doi: 10.1073/pnas.0811879106. [DOI] [PMC free article] [PubMed] [Google Scholar]
- Fox MD, Raichle ME. Spontaneous fluctuations in brain activity observed with functional magnetic resonance imaging. Nat Rev Neurosci. 2007;8:700–711. doi: 10.1038/nrn2201. [DOI] [PubMed] [Google Scholar]
- Fox MD, Corbetta M, Snyder AZ, Vincent JL, Raichle ME. Spontaneous neuronal activity distinguishes human dorsal and ventral attention systems. Proc Natl Acad Sci U S A. 2006;103:10046–10051. doi: 10.1073/pnas.0604187103. [DOI] [PMC free article] [PubMed] [Google Scholar]
- Gur RC, Richard J, Hughett P, Calkins ME, Macy L, Bilker WB, Brensinger C, Gur RE. A cognitive neuroscience-based computerized battery for efficient measurement of individual differences: standardization and initial construct validation. J Neurosci Methods. 2010;187:254–262. doi: 10.1016/j.jneumeth.2009.11.017. [DOI] [PMC free article] [PubMed] [Google Scholar]
- Jenkinson M, Bannister P, Brady M, Smith S. Improved optimization for the robust and accurate linear registration and motion correction of brain images. Neuroimage. 2002;17:825–841. doi: 10.1016/s1053-8119(02)91132-8. [DOI] [PubMed] [Google Scholar]
- Jo HJ, Saad ZS, Simmons WK, Milbury LA, Cox RW. Mapping sources of correlation in resting state FMRI, with artifact detection and removal. Neuroimage. 2010;52:571–582. doi: 10.1016/j.neuroimage.2010.04.246. [DOI] [PMC free article] [PubMed] [Google Scholar]
- Kochiyama T, Morita T, Okada T, Yonekura Y, Matsumura M, Sadato N. Removing the effects of task-related motion using independent-component analysis. Neuroimage. 2005;25:802–814. doi: 10.1016/j.neuroimage.2004.12.027. [DOI] [PubMed] [Google Scholar]
- Liao R, McKeown MJ, Krolik JL. Isolation and minimization of head motion-induced signal variations in fMRI data using independent component analysis. Magn Reson Med. 2006;55:1396–1413. doi: 10.1002/mrm.20893. [DOI] [PubMed] [Google Scholar]
- Lynall ME, Bassett DS, Kerwin R, McKenna PJ, Kitzbichler M, Muller U, Bullmore E. Functional connectivity and brain networks in schizophrenia. J Neurosci. 2010;30:9477–9487. doi: 10.1523/JNEUROSCI.0333-10.2010. [DOI] [PMC free article] [PubMed] [Google Scholar]
- Nichols TE, Holmes AP. Nonparametric permutation tests for functional neuroimaging: a primer with examples. Hum Brain Mapp. 2002;15:1–25. doi: 10.1002/hbm.1058. [DOI] [PMC free article] [PubMed] [Google Scholar]
- Power JD, Barnes KA, Snyder AZ, Schlaggar BL, Petersen SE. Spurious but systematic correlations in functional connectivity MRI networks arise from subject motion. Neuroimage. 2011 doi: 10.1016/j.neuroimage.2011.10.018. [DOI] [PMC free article] [PubMed] [Google Scholar]
- Raichle ME, MacLeod AM, Snyder AZ, Powers WJ, Gusnard DA, Shulman GL. A default mode of brain function. Proc Natl Acad Sci U S A. 2001;98:676–682. doi: 10.1073/pnas.98.2.676. [DOI] [PMC free article] [PubMed] [Google Scholar]
- Rubinov M, Sporns O. Complex network measures of brain connectivity: uses and interpretations. Neuroimage. 2010;52:1059–1069. doi: 10.1016/j.neuroimage.2009.10.003. [DOI] [PubMed] [Google Scholar]
- Rubinov M, Sporns O. Weight-conserving characterization of complex functional brain networks. Neuroimage. 2011;56:2068–2079. doi: 10.1016/j.neuroimage.2011.03.069. [DOI] [PubMed] [Google Scholar]
- Satterthwaite TD, Wolf DH, Loughead J, Ruparel K, Valdez JN, Siegel SJ, Kohler CG, Gur RE, Gur RC. Association of enhanced limbic response to threat with decreased cortical facial recognition memory response in schizophrenia. Am J Psychiatry. 2010;167:418–426. doi: 10.1176/appi.ajp.2009.09060808. [DOI] [PMC free article] [PubMed] [Google Scholar]
- Smith SM. Fast robust automated brain extraction. Hum Brain Mapp. 2002;17:143–155. doi: 10.1002/hbm.10062. [DOI] [PMC free article] [PubMed] [Google Scholar]
- Smith SM, Fox PT, Miller KL, Glahn DC, Fox PM, Mackay CE, Filippini N, Watkins KE, Toro R, Laird AR, Beckmann CF. Correspondence of the brain's functional architecture during activation and rest. Proc Natl Acad Sci U S A. 2009;106:13040–13045. doi: 10.1073/pnas.0905267106. [DOI] [PMC free article] [PubMed] [Google Scholar]
- Smith SM, Miller KL, Salimi-Khorshidi G, Webster M, Beckmann CF, Nichols TE, Ramsey JD, Woolrich MW. Network modelling methods for FMRI. Neuroimage. 2011;54:875–891. doi: 10.1016/j.neuroimage.2010.08.063. [DOI] [PubMed] [Google Scholar]
- Tohka J, Foerde K, Aron AR, Tom SM, Toga AW, Poldrack RA. Automatic independent component labeling for artifact removal in fMRI. Neuroimage. 2008;39:1227–1245. doi: 10.1016/j.neuroimage.2007.10.013. [DOI] [PMC free article] [PubMed] [Google Scholar]
- van den Heuvel MP, Stam CJ, Boersma M, Hulshoff Pol HE. Small-world and scale-free organization of voxel-based resting-state functional connectivity in the human brain. Neuroimage. 2008;43:528–539. doi: 10.1016/j.neuroimage.2008.08.010. [DOI] [PubMed] [Google Scholar]
- van den Heuvel MP, Stam CJ, Kahn RS, Hulshoff Pol HE. Efficiency of functional brain networks and intellectual performance. J Neurosci. 2009;29:7619–7624. doi: 10.1523/JNEUROSCI.1443-09.2009. [DOI] [PMC free article] [PubMed] [Google Scholar]
- Van Dijk KR, Hedden T, Venkataraman A, Evans KC, Lazar SW, Buckner RL. Intrinsic functional connectivity as a tool for human connectomics: theory, properties, and optimization. J Neurophysiol. 2010;103:297–321. doi: 10.1152/jn.00783.2009. [DOI] [PMC free article] [PubMed] [Google Scholar]
- Van Dijk KR, Sabuncu MR, Buckner RL. The influence of head motion on intrinsic functional connectivity MRI. Neuroimage. 2011 doi: 10.1016/j.neuroimage.2011.07.044. [DOI] [PMC free article] [PubMed] [Google Scholar]
- Van Essen DC, Drury HA, Dickson J, Harwell J, Hanlon D, Anderson CH. An integrated software suite for surface-based analyses of cerebral cortex. J Am Med Inform Assoc. 2001;8:443–459. doi: 10.1136/jamia.2001.0080443. [DOI] [PMC free article] [PubMed] [Google Scholar]
- Vincent JL, Kahn I, Snyder AZ, Raichle ME, Buckner RL. Evidence for a frontoparietal control system revealed by intrinsic functional connectivity. J Neurophysiol. 2008;100:3328–3342. doi: 10.1152/jn.90355.2008. [DOI] [PMC free article] [PubMed] [Google Scholar]
- Vincent JL, Snyder AZ, Fox MD, Shannon BJ, Andrews JR, Raichle ME, Buckner RL. Coherent spontaneous activity identifies a hippocampal-parietal memory network. J Neurophysiol. 2006;96:3517–3531. doi: 10.1152/jn.00048.2006. [DOI] [PubMed] [Google Scholar]
- Wolf DH, Gur RC, Valdez JN, Loughead J, Elliott MA, Gur RE, Ragland JD. Alterations of fronto-temporal connectivity during word encoding in schizophrenia. Psychiatry Res. 2007;154:221–232. doi: 10.1016/j.pscychresns.2006.11.008. [DOI] [PMC free article] [PubMed] [Google Scholar]
- Woolrich MW, Ripley BD, Brady M, Smith SM. Temporal autocorrelation in univariate linear modeling of FMRI data. Neuroimage. 2001;14:1370–1386. doi: 10.1006/nimg.2001.0931. [DOI] [PubMed] [Google Scholar]
- Yang H, Long XY, Yang Y, Yan H, Zhu CZ, Zhou XP, Zang YF, Gong QY. Amplitude of low frequency fluctuation within visual areas revealed by resting-state functional MRI. Neuroimage. 2007;36:144–152. doi: 10.1016/j.neuroimage.2007.01.054. [DOI] [PubMed] [Google Scholar]
- Zang YF, He Y, Zhu CZ, Cao QJ, Sui MQ, Liang M, Tian LX, Jiang TZ, Wang YF. Altered baseline brain activity in children with ADHD revealed by resting-state functional MRI. Brain Dev. 2007;29:83–91. doi: 10.1016/j.braindev.2006.07.002. [DOI] [PubMed] [Google Scholar]
- Zhang Y, Brady M, Smith S. Segmentation of brain MR images through a hidden Markov random field model and the expectation-maximization algorithm. IEEE Trans Med Imaging. 2001;20:45–57. doi: 10.1109/42.906424. [DOI] [PubMed] [Google Scholar]
- Zou QH, Zhu CZ, Yang Y, Zuo XN, Long XY, Cao QJ, Wang YF, Zang YF. An improved approach to detection of amplitude of low-frequency fluctuation (ALFF) for resting-state fMRI: fractional ALFF. J Neurosci Methods. 2008;172:137–141. doi: 10.1016/j.jneumeth.2008.04.012. [DOI] [PMC free article] [PubMed] [Google Scholar]
- Zuo XN, Di Martino A, Kelly C, Shehzad ZE, Gee DG, Klein DF, Castellanos FX, Biswal BB, Milham MP. The oscillating brain: complex and reliable. Neuroimage. 2010a;49:1432–1445. doi: 10.1016/j.neuroimage.2009.09.037. [DOI] [PMC free article] [PubMed] [Google Scholar]
- Zuo XN, Kelly C, Adelstein JS, Klein DF, Castellanos FX, Milham MP. Reliable intrinsic connectivity networks: test-retest evaluation using ICA and dual regression approach. Neuroimage. 2010b;49:2163–2177. doi: 10.1016/j.neuroimage.2009.10.080. [DOI] [PMC free article] [PubMed] [Google Scholar]
- Zuo XN, Kelly C, Di Martino A, Mennes M, Margulies DS, Bangaru S, Grzadzinski R, Evans AC, Zang YF, Castellanos FX, Milham MP. Growing together and growing apart: regional and sex differences in the lifespan developmental trajectories of functional homotopy. J Neurosci. 2010;30:15034–15043. doi: 10.1523/JNEUROSCI.2612-10.2010. [DOI] [PMC free article] [PubMed] [Google Scholar]
- Zuo XN, Ehmke R, Mennes M, Imperati D, Castellanos FX, Sporns O, Milham MP. Network Centrality in the Human Functional Connectome. Cereb Cortex. 2011 doi: 10.1093/cercor/bhr269. [DOI] [PubMed] [Google Scholar]
Associated Data
This section collects any data citations, data availability statements, or supplementary materials included in this article.
Supplementary Materials
Effect of motion on dual-regression ICA, split by component-positive and component-negative voxels. Motion effects are primarily seen in component-positive voxels.
Correlation matrix of motion summary measures.