Abstract
We present a method for the stretching of chromatin molecules in nanofluidic channel width a cross-section of about 80×80 nm2, and hundreds of microns long. The stretching of chromatin to about 12 basepairs/nm enables location-resolved optical investigation of the nucleic material with a resolution of up to 6 kbp. The stretching is based on the equilibrium elongation that polymers experience when they are introduced into nanofluidic channels that are narrower than the Flory coil corresponding to the whole chromatin molecule. We investigate whether the elongation of reconstituted chromatin can be described by the de Gennes model. We compare nanofluidic stretching of bare DNA and chromatin of equal genomic length, and find that chromatin is 2.5 times more compact in its stretched state.
The central question in the analysis of chromatin is telling “what” is “where”. In the post-genome era the question of “what” is transitioning from the chemical identity of bases1 to the question of biological activity of known bases.2 We are particularly interested in the epigenetic information encoded in the local chromatin structure, especially the difference between open and closed chromatin and covalent modification of histone tails.3 While the majority of current studies investigate large cell population by utilizing chromatin immunoprecipatation protocols (ChIP) coupled with hybridization arrays or sequencing,4 our ultimate aim is the analysis of single, large chromatin molecules. We believe that such single-molecule analysis is necessary for studying epigenetic variability in heterogeneous samples, such as populations undergoing embryonic or cancer development.
The starting point for our analysis is the fluorescence in- situ hybridization technique (FISH), which employs fluorescent markers to indicate the presence of marks along chromatin molecules. The central limitation of FISH is the precision and reliability with which a spatial position in the sample can be attributed to a genetic location. Other researcherd have shown that stretching and linearizing chromosomes establishes a continuous mapping between spatial location and genomic location.5,6 The desired precision for data relevant to biological processes is at least one gene, or about 10,000 basepairs (bp) in humans. Due to the diffraction limit of optical microscopy of about 300 nm, that means that the chromatin has to be elongated to at least 30 bp/nm. For comparison, a mitotic chromosome has up to 20,000 bp/nm.
The idea of stretching nucleic acids prior to analysis has been widely exploited for the analysis of bare DNA. Mature techniques for DNA stretching are end-tethering, usually in connection with optical or magnetic tweezers,7,8 adsorption onto a hydrophobic or positively charged surface under flow,6 shear flow,9,10 and nanoconfinement.11 Stretching by nanoconfinement is the youngest of those techniques. Here, DNA is introduced into closed nanochannels with a cross-section comparable to a few persistence lengths or less, typically about 100×100 nm2, and hundreds of microns long. Balancing of contractile forces, due to the maximization of entropy by random walks, and expansive self-exclusion forces establishes a stretched equilibrium state around which the molecule can fluctuate. No external forces or motion of the molecule are required. The demonstrated feasibility of studying DNA undergoing enzymatic modification by a protein system inside nanochannels12 suggests that other protein-DNA complexes, such as chromatin, can also be observed in nanochannels.
While all of these DNA stretching techniques should be somewhat applicable to chromatin, we note that chromatin stretching is far less studied, with the notable exceptions of end-tethered stretching.13 The predominant stretching technique for epigenetic analysis is based on shearing whole cells after fixation, a technique with the apparent drawback of poor molecule to molecule repeatability.5 We show here that the method of stretching by confinement in a nanochannel can be extended from DNA to chromatin.
Nanofluidic devices were prepared on fused silica wafers using a previously published protocol.14 The device layout consisted of nanochannels with a cross-section of about 80×80 nm2 and 200 μm length that where connected to a microfluidic infrastructure.12 λ-DNA was blunted using T4 DNA polymerase (both New England Biolabs). Chromatin was reconstituted on this DNA using an unfractionated whole histone mixture (Sigma Aldrich, #9250) following a protocol by Steger et al.15 After reconstitution, the chromatin solution consisted of 0.4 μg/ml DNA, 0.4 μg/ml DNA histones, 40 ng/ml BSA, 100 mM NaCl, 23 mM HEPES, 4.8 mM DTT, 0.48 mM PMSF, 5 mM TrisHCl, 10 vol% Glycerol, and 0.05 vol% Nonidet P-40 substitute (Fluka, #74385). Chromatin was stained using YOYO-1 (Invitrogen) at 1:4 molar dye to basepair ratio. After injection into our devices, we raised the concentration of BSA to 5% by weight, and added β-mercaptoethanol to give an on-chip concentration of 2 vol%. For control experiments, λ-DNA with the same fluorescent staining was suspended in 2×TBE buffer with 0.25 vol% PVP (360 kDa, Sigma Aldrich) added. Nucleic acids were moved through the device by application of electric fields at the microfluidic reservoirs. Molecules were observed using an inverted fluorescence microscope with a 100×, 1.3 N.A. oil-immersion microscope objective, illumination from a metal halide lamp, and observation by an emCCD camera (all Nikon).
Figure 1A shows a nanoconfined chromatin molecule entering the field of view from the right. After the field is turned off, the molecule fluctuates freely within the channel. After re-application of the electric field, this time in opposite direction, the molecule moves out of the channel. For comparison, Figure 1B shows a bare DNA molecule inside a nanochanel, which is obviously more extended. We attribute the reduced brightness of chromatin to a probable sub-optimal staining of the highly constrained DNA within chromatin, the presence of chlorine ions that interfere with the dye, and a lower illumination intensity in that experiment, which was chosen to reduce bleaching and photodegradation.
Fig. 1.
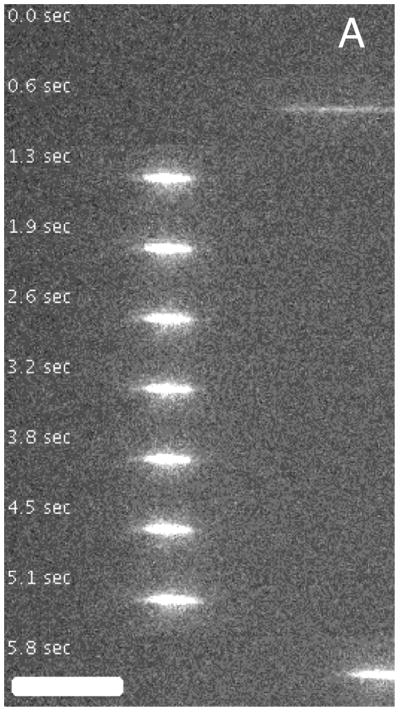
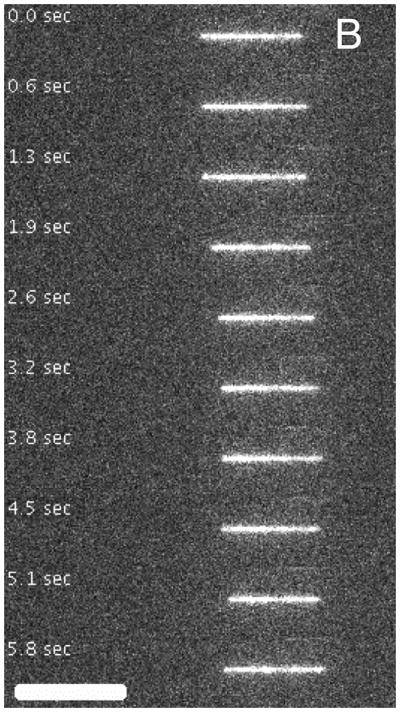
Time-lapse movies of chromatin assembled from λ-DNA (A) and λ-DNA (B) with equal number of basepairs in nanochannels with a cross-section of about 90 nm. The scale bars are 10 μm.
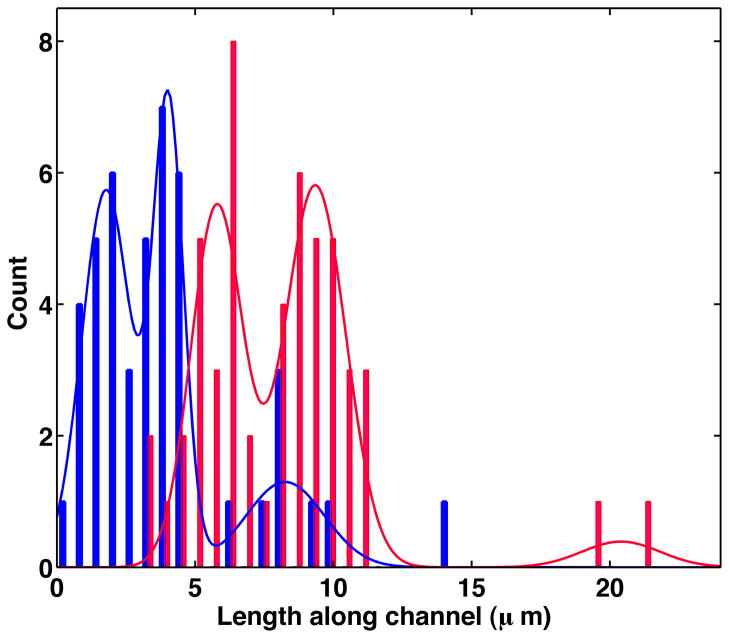
Lengths of confined chromatin and DNA were analyzed by fitting the fluorescence intensity along the polymer backbone to the sum of two error functions and of equal magnitude and opposite sign, as described in reference 11. Lengths obtained from individual movie frames were averaged for each individual molecule. The resulting histogram of DNA and chromatin lengths is shown in Figure 2. Peak positions were obtained by fitting Gaussian distributions to the histogram.
Fig. 2.
Histograms of observed molecule extensions along the nanochannel. Gaussian fits from which peak positions were determined are also indicated. Blue curves are for reconstituted chromatin on λ-DNA, and red curves for bare λ-DNA.
Although neat samples of λ-DNA were used, we find that the histogram of bare DNA lengths shows two main peaks at 9.3 μm and 5.8 μm, respectively. The peak at 9.3 μm is due to whole λ-DNA as previously reported.11 We can identify the shorter peak with sheared DNA, which can constitute about a quarter (number average, not weight average) of commercially available λ-DNA that is stored and handled in liquid samples. A third peak at 20.4 μm, which corresponds to λ-DNA dimers, is also present.
We find that the chromatin sample shows three peaks as well. In analogy to the bare λ-DNA sample, we argue that the dominant peak at 4.0 μm is the peak corresponding to whole molecules of reconstituted chromatin, while the smaller maxima at 1.8 μm and 8.2 μm correspond to fragments and poorly reconstituted molecules, respectively. We note that the increased relative width of the main peak in chromatin when compared to DNA may at least in part be due to the high stresses that the leading/trailing ends of chromatin experience during the insertion process into the nanochannels.
We now aim to determine whether the chromatin stretching agrees with a prediction according to the de Gennes model,16 which has been applied with considerable success.17 The model predicts an extension of the molecule along the channel on the order of
| (1) |
where ℓ is the length along the channel, L is the contour length, D is the geometric average of channel width and height, p is the persistence length, and w the effective polymer width. Since both chromatin and DNA were confined to identical channels, we can test whether the ratio of L(pw)1/3 of chromatin and DNA is consistent with the observed difference in elongation.
While the properties of the 30-nm chromatin fiber have received considerable interest, it serves as a poor model for our reconstituted chromatin in which linker DNA lengths probably are very heterogeneous, thus leading to a disordered 10-nm fiber. For such a fiber, we assume a p=30 nm.13 The excluded volume parameter is extraordinarily difficult to establish since it includes DNA-DNA, DNA-nucleosome, and nucleosome-nucleosome interactions. For the purpose of this mean-field approximation, we will simply assume that the excluded volume is formed by a tube enveloping neighboring nucleosomes (Fig. 3). The width of that tube should be either dominated by the width of the linker DNA at the salt concentration used in that experiment (~4 nm)18 or the size of the nucleosome widened by a contribution due to some adsorbed ions (Stern layer) and a Debye-Hueckel contribution. At most they should lead to a width of 10 nm. The contour length is obtained by considering the average density of basepairs contained in one linker-DNA/nucleosome pair over the length of one linker. With 146 bp per nucleosome and 50 pair bp linkers that yields a contour length that is about ¼ of that of bare DNA. We use parameters for bare DNA in 2× TBE (p = 50 nm, w = 9 nm) as described in reference 18. We neglect the effect of intercalating dyes in the above parameters since the ratio formed here is expected to be unaffected as long as the effect of dye intercalation is the same on chromatin and bare DNA.7,10,19 With the above parameters, we thus expect a ratio of chromatin to bare DNA lengths under nanoconfinement in channels of 0.3, which is apparently smaller than the experimental value of 0.4. However, we note that the difference between experiment and theory is likely due to a partial stripping of histones from DNA strands. Indeed, we observe two-level intensity profiles of the fluorescence intensity in a fair number of molecules, consistent with condensed and open regions along the molecule.
Fig. 3.
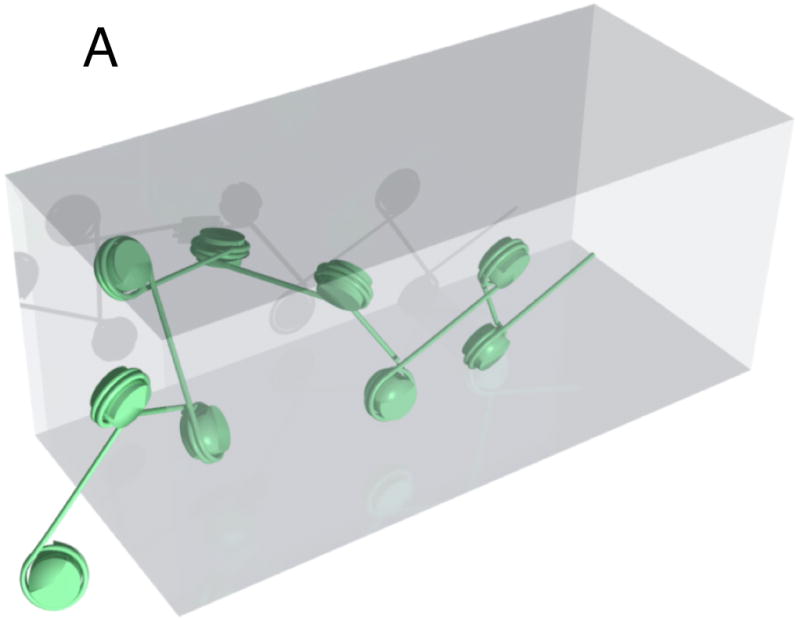
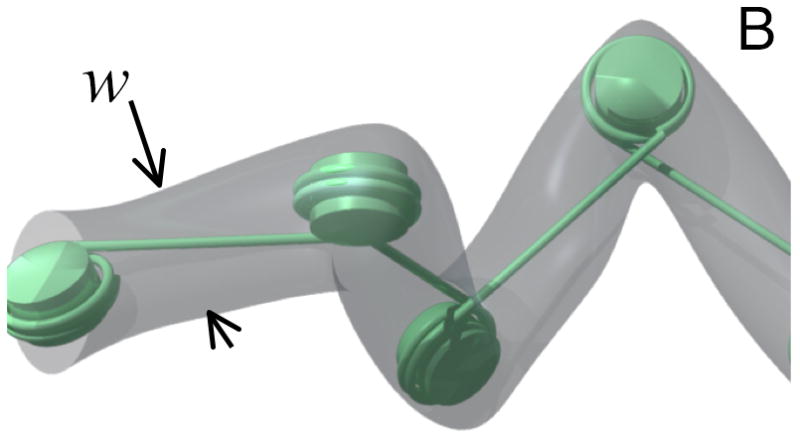
A) Physical model of nano-confined chromatin molecule. B) Schematic demonstrating the chosen effective width of chromatin.
In conclusion, we have shown that chromatin can be stretched in nanofluidic channels in a way similar to DNA, and that a common physical description based on the de Gennes model is plausible. We have also found that the stresses during channel insertion have to be carefully controlled to prevent stripping of histones from the chromatin fiber. We argue that our method has the potential to the basis of a FISH-like epigenetic analysis technique.
Acknowledgments
We acknowledge financial support from the NIH (1R21HG004383), and NC State University. This work was performed in part at the Cornell NanoScale Facility, a member of the National Nanotechnology Infrastructure Network, which is supported by the National Science Foundation (Grant ECS-0335765).
Notes and references
- 1.Venter JC, Adams MD, Myers EW, et al. Science. 2001;291:1304. [Google Scholar]; Lander ES, Linton LM, Birren B, et al. Nature. 2001;409:860–921. doi: 10.1038/35057062. [DOI] [PubMed] [Google Scholar]
- 2.Feingold EA, Good PJ, Guyer MS, et al. Science. 2004;306:636–404. [Google Scholar]
- 3.Taverna SD, Li H, Ruthenburg AJ, Allis CD, Patel DJ. Nat Struct Mol Biol. 2007;14:1025–1040. doi: 10.1038/nsmb1338. [DOI] [PMC free article] [PubMed] [Google Scholar]
- 4.Buck MJ, Lieb JD. Genomics. 2004;83:349–360. doi: 10.1016/j.ygeno.2003.11.004. [DOI] [PubMed] [Google Scholar]
- 5.Heng HHQ, Squire J, Tsui LC. Proc Natl Acad Sci USA. 1992;89:9509–9513. doi: 10.1073/pnas.89.20.9509. [DOI] [PMC free article] [PubMed] [Google Scholar]
- 6.Bensimon A, Simon A, Chiffaudel A, et al. Science. 1994;265:2096–2098. doi: 10.1126/science.7522347. [DOI] [PubMed] [Google Scholar]
- 7.Smith SB, Finzi L, Bustamante C. Science. 1992;258:1122–1126. doi: 10.1126/science.1439819. [DOI] [PubMed] [Google Scholar]
- 8.Smith SB, Cui YJ, Bustamante C. Science. 1996;271:795–799. doi: 10.1126/science.271.5250.795. [DOI] [PubMed] [Google Scholar]
- 9.Perkins TT, Smith DE, Larson RG, Chu S. Science. 1995;268:83–87. doi: 10.1126/science.7701345. [DOI] [PubMed] [Google Scholar]; Tegenfeldt JO, Bakajin O, Chou CF, et al. Physical Review Letters. 2001;86:1378–1381. doi: 10.1103/PhysRevLett.86.1378. [DOI] [PubMed] [Google Scholar]
- 10.Smith DE, Babcock HP, Chu S. Science. 1999;283:1724–1727. doi: 10.1126/science.283.5408.1724. [DOI] [PubMed] [Google Scholar]
- 11.Tegenfeldt JO, Prinz C, Cao H, et al. Proc Natl Acad Sci USA. 2004;101:10979–10983. doi: 10.1073/pnas.0403849101. [DOI] [PMC free article] [PubMed] [Google Scholar]
- 12.Riehn R, Lu MC, Wang YM, et al. Proc Natl Acad Sci USA. 2005;102:10012–10016. doi: 10.1073/pnas.0503809102. [DOI] [PMC free article] [PubMed] [Google Scholar]
- 13.Cui Y, Bustamante C. Proc Natl Acad Sci USA. 2000;97:127–132. doi: 10.1073/pnas.97.1.127. [DOI] [PMC free article] [PubMed] [Google Scholar]; Bennink ML, Leuba SH, Leno GH, Zlatanova J, de Grooth BG, Greve J. Nat Struct Biol. 2001;8:606–610. doi: 10.1038/89646. [DOI] [PubMed] [Google Scholar]
- 14.Riehn R, Austin RH, Sturm JC. Nano Letters. 2006;6:1973–1976. doi: 10.1021/nl061137b. [DOI] [PubMed] [Google Scholar]
- 15.Steger DJ, Eberharter A, John S, Grant PA, Workman JL. Proc Natl Acad Sci USA. 1998;95:12924–12929. doi: 10.1073/pnas.95.22.12924. [DOI] [PMC free article] [PubMed] [Google Scholar]
- 16.de Gennes PG. Scaling Concepts in Polymer Physics. Cornell University Press; 1979. [Google Scholar]; Schaefer DW, Joanny JF, Pincus P. Macromolecules. 1980;13:1280–1289. [Google Scholar]
- 17.Reisner W, Morton KJ, Riehn R, Wang YM, Yu ZN, Rosen M, Sturm JC, Chou SY, Frey E, Austin RH. Phys Rev Lett. 2005;94:196101. doi: 10.1103/PhysRevLett.94.196101. [DOI] [PubMed] [Google Scholar]; Reisner W, Beech JP, Larsen NB, Flyvbjerg H, Kristensen A, Tegenfeldt JO. Phys Rev Lett. 2007;99:058302. doi: 10.1103/PhysRevLett.99.058302. [DOI] [PubMed] [Google Scholar]; Levy SL, Mannion JT, Cheng J, Reccius CH, Craighead HG. Nano Letters. 2008;8:3839–3844. doi: 10.1021/nl802256s. [DOI] [PMC free article] [PubMed] [Google Scholar]
- 18.Schellman JA, Stigter D. Biopolymers. 1977;16:1415–1434;1. doi: 10.1002/bip.1977.360160704. [DOI] [PubMed] [Google Scholar]; Stigter D. Biopolymers. 1977;16:1435–1448. doi: 10.1002/bip.1977.360160705. [DOI] [PubMed] [Google Scholar]; Hsieh CC, Balducci A, Doyle PS. Nano Letters. 2008;8:1683–1688. doi: 10.1021/nl080605+. [DOI] [PubMed] [Google Scholar]
- 19.Perkins TT, Smith DE, Larson RG, Chu S. Science. 1995;268:83–87. doi: 10.1126/science.7701345. [DOI] [PubMed] [Google Scholar]; Bakajin OB, Duke TAJ, Chou CF, Chan SS, Austin RH, Cox EC. Physical Review Letters. 1998;80:2737–2740. [Google Scholar]


