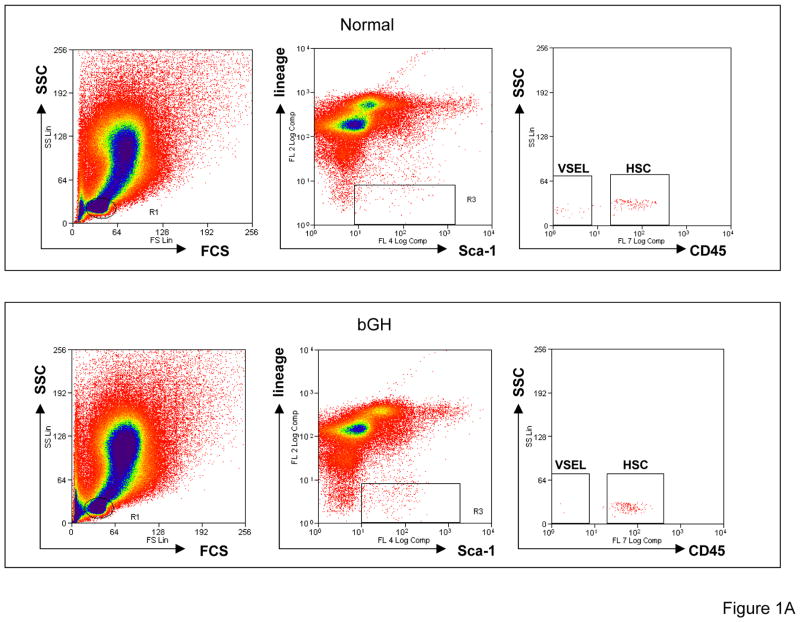
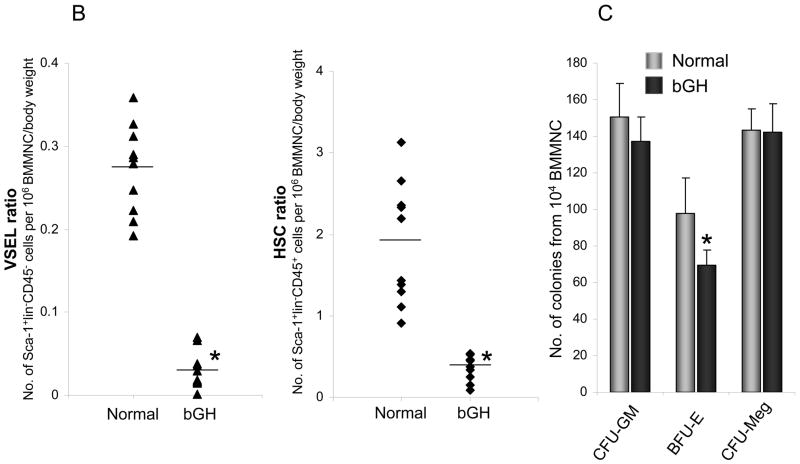
Figure 1. Increased number of VSELs and HSPCs in BM of bGH mice.
(A) Sorting of Sca-1+Lin−CD45− (VSELs) and Sca-1+Lin−CD45+ (HSCs) from mBM- derived MNCs by employing MoFlo High-Performance Cell Sorter. BMMNCs from region R1 are analyzed for Sca-1 and Lin expression. Sca-1+Lin− population which is included in region R2 is subsequently analyzed based on CD45 antigen expression and CD45− and CD45+ subpopulations visualized on dot plot, i.e., Sca-1+Lin−CD45− (VSELs) and Sca-1+Lin−CD45+ (HSCs). (B) The ratio for Sca-1+Lin−CD45− (VSELs) and Sca-1+Lin−CD45+ (HSCs) was evaluated as the number of events per 1×10⁶ BMMNC/body weight by employing LSR II FACS analyzer. Analysis of Variance (ANOVA) with Bonferroni’s Multiple Comparison Test *p<0.00001 as compared to normal counterparts. (C) The number of clonogenic BFU-E, CFU-GM and CFU-Meg from BM MNC isolated from 6 months old normal and bGH transgenic mice. Analysis of Variance (ANOVA) with Bonferroni’s Multiple Comparison Test *p<0.001 as compared to normal counterparts.


