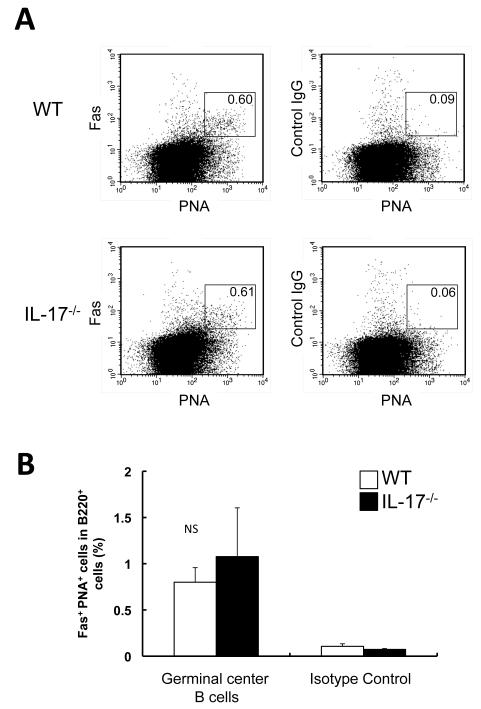
Figure 1. Proportion of PNA+ Fas+ B cells.
Single-cell suspensions were prepared from wild-type (WT) and IL-17−/− mice after immunization with OVA emulsified with alum. The proportion of PNA+ Fas+ cells in 7-aminoactinomycin D-negative B220+ cells was determined by flow cytometry. (A) Representative FACS results are shown. (B) The data show the mean + SEM. Open columns show WT mice (n=3), and closed columns show IL-17−/− mice (n=3).

