

Abstract
Metabolomic profiling offers direct insights into the chemical environment and metabolic pathway activities at sites of human disease. During infection, this environment may receive important contributions from both host and pathogen. Here we apply untargeted metabolomics approach to identify compounds associated with an E. coli urinary tract infection population. Correlative and structural data from minimally processed samples were obtained using an optimized LC-MS platform capable of resolving ∼2300 molecular features. Principal components analysis readily distinguished patient groups and multiple supervised chemometric analyses resolved robust metabolomic shifts between groups. These analyses revealed nine compounds whose provisional structures suggest candidate infection-associated endocrine, catabolic, and lipid pathways. Several of these metabolite signatures may derive from microbial processing of host metabolites. Overall, this study highlights the ability of metabolomic approaches to directly identify compounds encountered by, and produced from, bacterial pathogens within human hosts.
Keywords: integrated approach, LC-MS, untargeted urine metabolomics, urinary tract infection, Escherichia coli, infectious diseases
1. Introduction
Metabolomic profiling of patient samples offers insights into disease-associated metabolic pathway activities while avoiding the concern for species-specific responses in animal models. This approach has been recently adopted to study important human diseases in a variety of sample types including blood, urine, saliva, and cerebrospinal fluid 1-7. Results from these studies may reflect predisposing factors among patients with disease as well as the immediate response to disease. The small molecule signature detected in metabolomic studies arises from both local, tissue-based processes as well as systemic metabolic shifts. As the major excretory destination for the body's small molecules, the urinary metabolome is sensitive to all of these factors.
Urinary tract infection (UTI) is one of the most common infectious diseases in the world, afflicting 15 million women annually in the United States alone 8. Urinary metabolomic analysis of these patients offers the special opportunity to directly explore the host-pathogen interface of an active human infection.
Although several characteristic changes in urinary composition are used clinically in colorimetric “dipstick” analyses to help diagnose UTI, the underlying metabolomic changes are likely to be far more extensive. Uropathogenic Escherichia coli (E. coli), which account for the majority of UTI cases 9, exhibit a defined pathogenic metabolomic signature that may play an important role in their ability to infect human hosts 10-12. During infection, host responses also modify the infection environment and may determine infection outcome as well as the presence or absence of symptoms. Of note, endocrine hormones have emerged from these analyses as particularly interesting mediators in host-microbial interactions 13. In this context, urinary metabolomic analysis may provide important insights into human UTI pathophysiology as well as potentially associated conditions such as interstitial cystitis/painful bladder syndrome.
Patient-oriented studies typically require high analytic throughput and in the absence of prior UTI-associated urinary metabolome methodologies, we elected to develop an untargeted metabolomic profiling platform to compare patient urinary metabolomes. Because urinary metabolites in this patient population may derive from both systemic and local (urinary tract) sources, it was preferable to be sensitive to metabolites with a range of physical properties 14-15.
To maximize sensitivity while minimizing sample preparation artifact we used an LC-MS analytic platform for quantitative and qualitative analyses. Here we describe an integrated urinary metabolomics approach designed to yield pathway information using accessible instrumentation and informatics resources. To maximize pathway coverage, this approach is designed to be sensitive to small molecules exhibiting a broad range of physical properties. We found that recent advances in chromatography permit a notable expansion in the number of resolvable metabolomic features. The need to expand patient studies to large sample numbers led us to base this approach on a highly accessible hybrid linear iontrap/triple quadrupole mass spectrometer. The resulting workflow reflects these priorities and was robust and reproducible enough to yield plausible pathway data in a small patient study (Figure 1).
Fig 1.

A global metabolic profiling platform for human urine.
2. Materials and methods
2.1 Chemicals and reagents
LC grade acetonitrile was purchased from Fisher Scientific (Saint Louis, MO, USA); LC grade formic acid and other reagents were purchased from Sigma-Aldrich, Inc (Saint Louis, MO, USA); Water was purified with a Milli-Q purification system (Bedford, MA, USA). All other used reagents were all ACS grade reagents.
2.2 LC-MS system
Ultra-fast liquid chromatography (UFLC) (Shimadzu, Kyoto, Japan) consisted of two LC- 20AD XR pumps, a DGU-20A3 prominence vacuum degasser, an SIL-20AXR autosampler, a CTO-20A prominence column oven, and a CBM-20A communications bus module, coupled with a hybrid API 4000 QTrap (AB Sciex, Foster City, CA, USA) with an Turbo V ESI ionization source interface, and a computer platform equipped with UFLC-MS/MS Solution Analyst software version 1.5.1 (AB Sciex, Foster City, CA, USA) was used for data acquisition and preprocessing.
Chromatographic separation was performed on an Ascentis Express phenyl-hexyl column (100 mm × 2.0 mm, 2.7 μm, Shimadzu) under gradient LC programming with water containing 0.1% formic acid and acetonitrile containing 0.1% formic acid as mobile phases. The flow rate was set at 0.35 mL/min and the gradient elution program ranged from 2% to 35% acetonitrile in 23 minutes, then increased to 98% in 10 minutes. 5 μl of injection volume were used for all cases. The column eluent was directed into the mass spectrometer without split. Two other chromatographic columns were assessed using the same protocol: a Shim-pack XR-ODS column (100 mm × 2.0 mm, 2.2 μm, Shimadzu) and a Betasil C18 Column (100 mm × 2.1 mm, 5.0 μm, Thermo Scientific). Urine samples were analyzed by UFLC/MS system in negative ionization mode with an electrospray ionization voltage of -4500 V, nebulizer gas (air) and turbo gas (air) settings at 60 and 60 psi, and a turbosource gun temperature of 600°C. The curtain gas (nitrogen) was set at 35 psi, the collision cell pressure at low or high mode for different purposes. Full scan analysis was performed in the enhance mass spectrometry (EMS) mode using the electrospray ionization technique with coverage of mass range: 50 to 1000 Da by using scan rate of 1000/min, and the MS/MS screening was accomplished in the combinational mode of EMS_IDA_EPS.
2.3 Study subjects and sampling
Urine samples from female patients at the University of Washington, Seattle, WA with acute uncomplicated cystitis using previously described symptoms of dysuria, urinary frequency, or urinary urgency with a concentration of uropathogens in the urine of ≥1×10² colony-forming units (CFU/mL) 16. Urine culture findings in these patients consisted of E. coli only (n= 4), mixed Gram positives (MGP) (n=5) or a combination of MGP and E.coli (n=5). 0.1× volume of Sigma FAST protease inhibitor solution (Sigma, St. Louis, MO) was added to freshly voided urines prior to clinical centrifugation to remove cellular material and the supernatant was frozen at -80 C. Urine supernatants from asymptomatic control subjects (n=8) were obtained at Washington University, St. Louis, MO without additional diagnostic testing. This study was conducted according to the principles expressed in the Declaration of Helsinki. These studies were approved by the Institutional Review Boards of the University of Washington or Washington University. All patients provided written informed consent for the collection of samples and subsequent analysis.
2.4 Sample preparation
Urine samples were thawed on ice and centrifuged (23008×g for 10 min) at 4 C. 200 μl of supernatant was diluted with 1 volume of LC grade of H2O, and filtered (MillexGP, 0.22 μm) before LC/MS analysis. Quality control (QC) samples were prepared by pooling equal volume of each analyzed sample.
2.5 Chemometric Analysis
LC/MS spectra were processed as deconvoluted and integrated peaks using the Automated Mass Spectral Deconvolution System (Analyst software v 1.5.1 and Markerview software v 1.2.0) within the 50-1000 m/z mass ranges from retention times of 2-35 min to generate multivariate data matrices. Chemometric analyses were performed using SIMCA-P+ version 12.0.1 (Umetrics) with unsupervised principal components analysis (PCA), supervised partial least square discriminate analysis (PLS-DA) and orthogonal partial least square discriminate analysis (OPLS-DA). Variables were scaled to a Pareto distribution to ensure equal contributions from each variable to the models. Before performing chemometric analyses, these missing values were imputed based on the average metabolite signal level across all subjects. If the mean metabolite signal measure across samples was greater than 100,000 cps, then zero was imputed, otherwise one half of the minimum measure for that sample was imputed and non-rational cases were excluded by Simca-P software. To provide an overview of the data we used Cluster 3.0 software 17 and Java treeview (http://jtreeview.sourceforge.net) to plot a heatmap with log 2 transformation of normalized, median-centered data prior to clustering 18. z-score analysis scaled each metabolite according to a reference distribution. Control samples were designated as the reference distribution and a mean and standard deviation was determined for each metabolite signal. UTI patient spectral features were then centered and scaled by controls' mean and standard deviation. This allows us to express how UTI patient metabolites deviate from those of controls according to the z-score equation (z-scores = [x-mean (controls samples)]/standard derivation (controls samples)) 3. Normalization of differentially expressed metabolites and pathway analysis was performed using the Metaboanalyst platform (www.metaboanalyst.ca) 19.
2.6 Statistical Analysis
Statistical differences in metabolite expression between the patients and controls were calculated using one-way ANOVA and Tukey's test. Statistical differences are considered significant when the test p value is less than 0.05. The whiskers-box plot were adopted to clarify the metabolite expression level between groups; bars: median; boxes: 25–75% quartiles; whiskers: min-to-max observation.
3. Results
In this work, we aimed to develop a high-throughput, integrated approach to global urinary metabolic profiling for translational metabolic studies. Therefore, we emphasized platform validation and pilot application of analytical and chemometric methods. Our efforts focused upon development and validation of the LC/MS-based metabolic profiling, chemometric analysis of the results to identify discriminatory metabolites, identification of these metabolites and correlation to metabolic pathways. A small number of clinical cases were used as representative samples to validate this methodological platform in preparation for large-scale metabolomic analyses.
3.1 Optimization of LC/MS-based global metabolite profiling
Effective global metabolomic profiling requires that an array of analytical variables be optimized for sensitivity, reproducibility, and throughput. Accordingly, we used quality control samples to refine an approach that uses minimal sample preparation and emphasizes chromatographic separation. These methods are based upon the ABI QTrap 4000 mass spectrometer, a widespread instrument for small molecule analysis.
To analyze minimally-processed urine samples while also minimizing the suppressive effects of urinary salts, diluted and filtered urine was injected directly on-column and the first 2 minutes of isocratic 98% H2O was diverted to waste. The column temperature was set at 40 °C, based on considering chromatographic features and stability of urine. The classic mobile phase pair (H2O and acetonitrile) was adopted. A range of formic acid concentration (1, 0.1, vs. 0.01%) was tested. Optimal peak resolution and shape was observed with 0.1% formic acid. A flow rate of 0.35 mL/min was found to be optimal for peak sensitivity and resolution in this study.
The LC column chemistry field continues to develop and provide new options for profiling of complex biological samples. We selected Betasil C18 (100 mm × 2.1 mm, 5.0 μm, Thermo Scientific), Shim-pack XR-ODS column (100 mm × 2.0 mm, 2.2 μm, Shimadzu), and a Fused-Core® phenyl-hexyl column (100 mm × 2.0 mm, 2.7 μm, Ascentis Express, Supelco) for evaluation. QC sample analysis revealed substantial differences among these columns that are evident in basic peak integration chromatograms (Fig 2). The Ascentis Express phenyl-hexyl column shows the best chromatographic features (Fig 2A) when compared to the Shim- pack XR-ODS column (100 mm × 2.0 mm, 2.2 μm, Shimadzu) (Fig 2B) and the Betasil C18 column (100 mm × 2.1 mm, 5.0 μm) (Fig 2C) based on intensity and number of the detected metabolite features in the contour plot. Approximately 2300 metabolite features with acceptable mass-retention time tolerance and peak definition were identified using the Fused-Core® phenyl-hexyl column, compared with 1900 features using the Shim-pack XR-ODS and 1600 using the Betasil C18 column. Based on these differences in sensitivity and resolution (Fig 3), we selected the Fused-Core® phenyl-hexyl column for urinary metabolite profiling in this study. An optimized gradient elution was adopted to achieve better separation with high resolution.
Fig 2. Typical base peak intensity (BPI) chromatograms and contour plots of a urine sample analyzed with different LC columns.

(A) Ascentis Express phenyl-hexyl (100 mm × 2.0 mm, 2.7 μm, Supelco) (B) Shim-pack XR-ODS (100 mm × 2.0 mm, 2.2 μm, Shimadzu); (C) Betasil C18 (100 mm × 2.1 mm, 5.0 μm). BPI chromatograms are depicted at left and at right are relative contour plots with ion signal intensity represented by a color scale from light blue (low) to red (high).
Fig 3. Comparison of extracted ion chromatograms (XIC) ofm/z539.0-539.5 from different column types. Green.
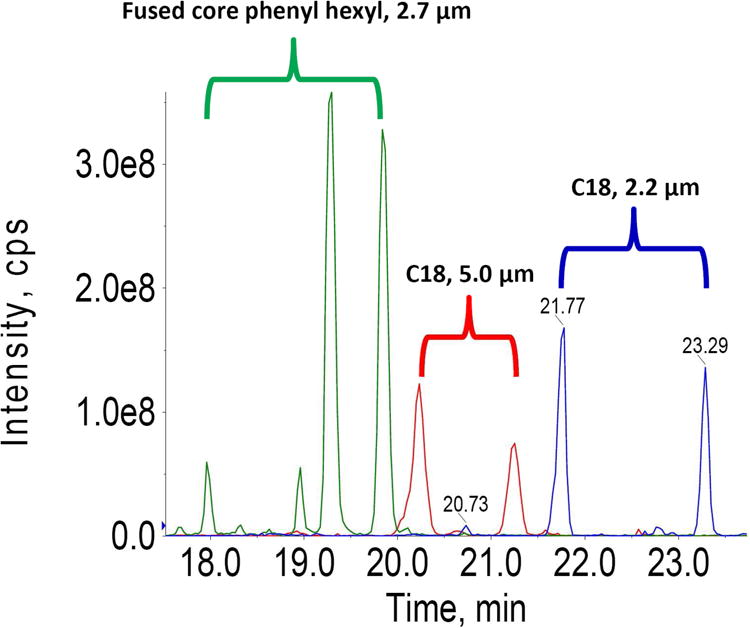
The fused core phenyl-hexyl column resolves four well-defined metabolite features; Red: The Betasil C18 column (100 mm × 2.1 mm, 5.0 μm, Thermo Scientific) resolves two metabolite features; Blue: The Shim-pack XR-ODS column (100 mm × 2.0 mm, 2.2 μm, Shimadzu) exhibits prolonged retention and resolves two metabolite features. The highest peak intensity was observed with the fused core phenyl-hexyl column, which is nearly twice that of the Shim-pack XR-ODS column, and four times that from the Betasil C18 column.
For acquiring high throughput, standardized global metabolite profiling of urine, mass spectrometry analysis in both positive and negative ionization modes were compared. BPI chromatograms (Fig 4) from positive ionization data revealed poor ionization of metabolite features and a high background noise compared to the low noise and abundant metabolite features evident in negative ionization mode data. Given this study's emphasis on comparing a maximal number of spectral features from minimally processed urine samples, we adopted the negative ionization mode for subsequent method optimization.
Fig 4. Typical positive and negative ionization mode BPI chromatograms of a urine sample analyzed under otherwise identical LC/MS conditions.
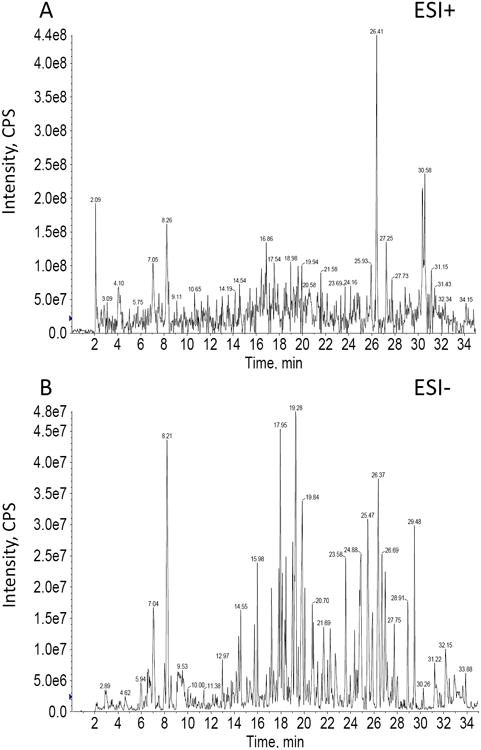
Although overall signal intensity is higher in positive mode, more metabolite features were distinguished in negative ionization mode.
Fundamental mass spectrometry parameters were optimized for negative ionization mode. The ionization source voltage between -4000 and -4500 V was screened for a typical low molecular weight metabolite range (50–1000 Da). The result (supplemental Fig 1) indicated that a source voltage of -4500 V was sufficient to produce parent ions in the ES- mode for detected metabolite pool. The gun temperature of the turbo source (supplemental Fig 2) and the pressures for nebulizer gas (air), turbo gas (air, supplemental Fig 3), and curtain gas (nitrogen, supplemental Fig 4) were further adjusted to optimize ionization, sensitivity, resolution and noise level. The resulting parameters were an electrospray ionization voltage of -4500 V, turbo source gun temperature of 600°C, and nebulizer, turbo, and curtain gasses of 60, 60, and 35 psi, respectively. The collision cell pressure was adjusted depending upon the application (full scan or fragment scan). Full scan analysis was performed in the instrument's linear ion trap mode (EMS mode) with a mass range of 50-1000 Da and MS/MS acquisition was performed in the combinational mode of the EMS_IDA_EPS by selectively locking metabolite features. When optimized UFLC chromatography produced lower peak widths, the mass spectrometer was allowed to acquire data faster. The faster duty cycle of the Qtrap instrumentation should allow rapid data collection and good quality MS/MS analysis. In this study, the scan rate was optimized at 1000 Da/S for full scan, 4000 Da/S for fragment scan. Data were collected with escalating collision energy, at 5 eV for parent ion information and range of 15–80 eV for fragment ion information. Resolution was greater than 5000 in both high and low collision energy modes. The Qtrap instrument was switching with a frequency of 4000 Da/S and we could see that the frequency was sufficiently rapid to keep the chromatographic information while still obtaining good MS/MS data.
Having selected optimal chromatographic and ionization conditions above, we evaluated reproducibility of the optimized profiling procedure. Six injections of QC samples were analyzed prior to sample analyses. Additionally, a QC injection was run once for every ten samples injected. A total of ten QC sample injections were performed within a 48-hour period. The retention time and peak area of visible peaks varied within the R.S.D. range of 0.05–0.1%, within the generally acceptable range of retention time and peak area variability for large-scale sample analysis. Results of this analysis in Fig 5 demonstrate that overlaid chromatograms are characterized by high reproducibility and stability throughout the run time. Quantitative demonstration of high reproducibility is supported by a proofed score scatter plot of the pooled QC sample resulting obtained by PCA (R2Y (cum): 0.82; Q2 (cum): 0.55)
Fig 5. Reproducibility with repeated measures.

(A) Global overlay of BPI chromatograms from a pooled QC sample; (B) Local zoom overviews of the overlaid BPI chromatogram; (C) Score scatter plots of PCA analyses of pooled QC samples alongside analyzed samples.
3.2 Global metabolic phenotype of urine
Metabolic signal profiles were pretreated using Markerview v.1.2 to deconvolute, align and integrate peak signals by pre-defining the resolution (20 ppm), time tolerance (0.2 min) and mass tolerance (0.5 Da). A data matrix of metabolite signals was created composed of 2366 metabolite signals. Reproducibility of metabolite signals was confirmed by repeated runs of ten QC samples within 48 hours. 83% of metabolite signals exhibited CV% (coefficient of variance) of less than 30%, which accounted for nearly 95% of summed responses. Thus, most metabolite signals revealed acceptable reproducibility and stability in the LC/MS profiling analyses. QC sample-centered clustering was also evident in the PCA score plot (supplemental Fig 5), consistent with robust reproducibility of this global metabolic profiling platform.
To determine whether this optimized UFLC/MS-based urinary global profiling platform can distinguish individual differences, we then analyzed urine samples from a group of urinary tract infection (UTI) patients and asymptomatic controls. PCA analysis of these samples (Fig 6) showed that metabolic phenotypes of UTI patients were well-differentiated from asymptomatic controls. Furthermore, PCA also revealed differences within the UTI patient group based on diagnostic culture results (E.coli, mixed Gram positives, or both) suggesting that this method is sensitive to pathophysiologic metabolomic differences. The results from this methodologically investigation will require further validation with a larger patient sample from an ongoing prospective patient study before pursuing these as informative or useful disease-based biomarkers. Given the high prevalence and known significance of E.coli urinary tract infection, we elected to use these patients in subsequent supervised analyses.
Fig 6. Phenotypic differentiation of urine from control subjects and UTI associated with E.coli, mixed Gram positives, or both from urinary culture.

(A) 2D score scatter plot resulting from PLS-DA analysis; (B) 3D score scatter plot resulting from PLS-DA analysis.
3.3 Chemometric analysis of the urinary metabolome
Chemometric analysis is a critical step in metabolomic analyses and the differential features extracted from global metabolomics. Data can differ markedly depending on which approach is selected. In these analyses, we use a consensus-based assessment derived from multiple pattern recognition approaches to identify metabolic features that differentiate E.coli UTI patients from asymptomatic controls.
Prior to chemometric analyses, raw data was normalized by Pareto mode scaling. The resulting global dataset was described by: i) a heatmap with pre-transformation of Log2 (Fig 7A); ii) z-score plot (Figs 7B and C) and iii) volcano plot (Fig 7D). Each analysis and visualization displays distinct metabolic information differentiating the E.coli UTI patient and control sample groups. The z-score plots revealed particularly robust metabolic alterations in UTI patients with E.coli UTI (z-score range: –4 to 12) (Fig 7B and C). Differentiation of UTI and control-associated metabolites was achieved by the volcano plot, which is color-coded to show metabolites that are higher or lower in UTI samples. Clear differentiation of metabolic signature between patients and controls was also evident by supervised PLS_DA (Fig 7E) and OPLS_DA (Fig 7F) analyses. R2Y (cum) and Q2 (cum) were utilized to describe the proportion of variance in Y explained and predicted by the model, respectively. In the PLS_DA model, the first two principal components, R2Y (cum) and Q2 (cum), are 0.89 and 0.56 and increase to 0.96 and 0.72 upon inclusion of the third principal component (supplemental Fig 6A). In the OPLS-DA model, the first two principal components are 0.89 and 0.68 (supplemental Fig 6B). These results show that the plotted PLS_DA and OPLS_DA models could reliably differentiate metabolites, as is also supported by the 3D visualized score plots (supplemental Fig 7).
Fig 7. Global metabolic urinary phenotype differentiation of E.coli UTI patients from controls.

(A) Heat map derived from unsupervised hierarchical clustering of metabolite signals (rows) grouped by sample type (columns); (B) Z-score plot for reference group (controls); (C) Z-score plot for the metabolites normalized to the mean of the control samples; (D) Volcano plot mapped by the log2 mean value of patients/controls vs p value of t-test of patients vs controls (x: log 2 mean value of patients/controls; y: p value of t-test of patients vs controls); Metabolites with significantly higher and lower levels among E.coli UTI patients are enclosed by the red or blue squares, respectively. (E) Scatter score plot resulting from PLS_DA model; (F) Scatter score plot resulting from OPLS_DA model. Further goodness of fit analysis for PLS_DA and OPLS_DA are provided in Supplemental Fig 6.
Many methods have been proposed for differential metabolite (biomarker) discovery. To evaluate the differentially-expressed metabolites, three approaches were adopted: the loading plot (Fig 8A), S-plot (OPLS-DA model) (Fig 8B) and variable importance in projection (VIP) plot (Fig 7C). The loading plot depicted 14 metabolite ions with a significant contribution to differentiating UTI patients to controls (Fig 8A). 12 differential metabolite ions were suggested by S-plot (Fig 8B). A total 13 metabolites were revealed in the VIP plot with a high VIP value (not less than 3) (Fig 8C). A consensus list of biomarker candidates was generated by selecting metabolites identified by each method. The Venn diagram in Fig 8D shows how this consensus list was populated from three approaches to biomarker discovery. Nine consensus metabolite features were selected as differential metabolites for further study.
Fig 8. Multiple discovery and validation measures contribute to consensus identification of UTI-associated metabolites.
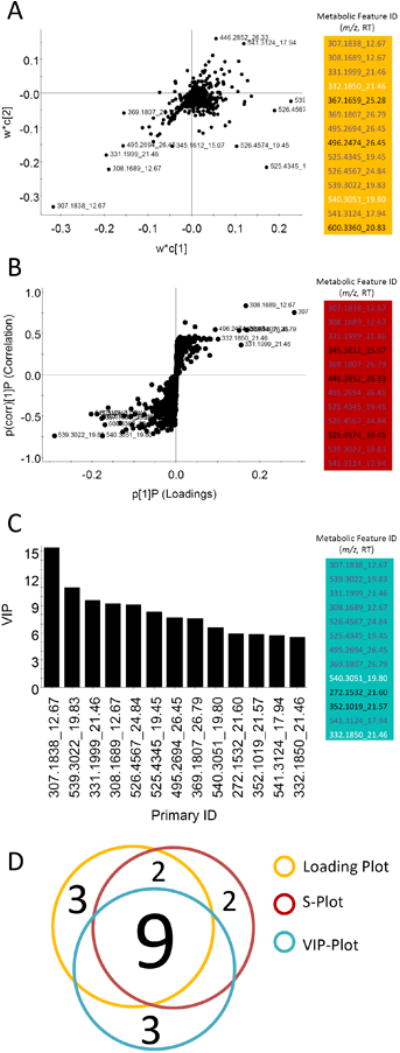
(A) 14 differentiable metabolites were confirmed by loading plot analysis of OPLS_DA data. (B) The S-plot analysis of the same OPLS_DA data identifies 12 differentiable metabolites. (C) VIP plot of data from the OPLS model identifies 13 metabolites shared with either the loading and/or S-plots. (D) A Venn diagram depicts contributions from these three analyses to the consensus list of differentiated metabolites.
3.4 Differential metabolite identification
The nine consensus metabolites were the subject of an identification process that first used MS-based database searches, then MS/MS analyses to differentiate among candidates, followed by further database and literature searches. The metabolite identification process is illustrated here for the m/z 539.28 ion. To determine molecular weight and to generate proposed formulae for the differentially-expressed metabolite of MW 540.28, a higher resolution mass measurement was acquired (Fig 9A). These data suggested the formula C27H40O11 (Fig 9B). Next, the MS/MS product ion spectrum was used to provide additional structural information (Fig 9C). The information obtained as above was used to search Pub Compound (pubchem.ncbi.nlm.nih.gov), the human metabolome database (http://www.hmdb.ca), Chemspider (www.chemspider.com), and METLIN Metabolite Database (http://metlin.scripps.edu). These analyses resulted in a match to tetrahydroaldosterone-3-glucuronide (Fig 9D). Fragmentation pathways suggested by the negative ion MS/MS product ion spectrum of the [M-H]- precursor ion at at m/z 539.28 (Fig 9E) are consistent with this glucuronidated steroid. The ion fragment peaks at m/z 521 and m/z 509 are consistent with losses of water and formaldehyde (CH2O), respectively. The fragments at m/z 479 and m/z 363 are attributed to further losses of COCH3OH and a molecule of glucuronic acid, respectively. Figs 9F and 9G further illustrate how this metabolite feature was consistently decreased in UTI patients. Eight other metabolites were identified using this process of mass spectrometric analyses, database searching and literature matching. This diversified, mass spectrometry-based effort identified the nine metabolites as diphosphomevalonate, tetrahydroaldosterone-3-glucuronide, 21-hydroxypregnenolone, N-acetylneuraminic acid, 3-carboxy-1-hydroxypropyl-ThPP, desmosine, pregnanediol-3-glucuronide, 6-keto-prostaglandin F1a, and cortolone-3-glucuronide (Table 2). Their VIP values range from 5.73 to 15.42. A Kegg (Kyoto Encyclopedia of Genes and Genomes) pathway database search preliminarily correlated our nine differential metabolites to terpenoid backbone biosynthesis, pentose and glucuronate interconversions & starch and sucrose metabolism, steroid hormone biosynthesis, amino sugar and nucleotide sugar metabolism, citrate cycle (TCA cycle), amino acids and amino acid conjugates metabolism and arachidonic acid metabolism (Table 2).
Fig 9. Identification of tetrahydroaldosterone-3-glucuronide as a differentiable metabolite in E.coli UTI.
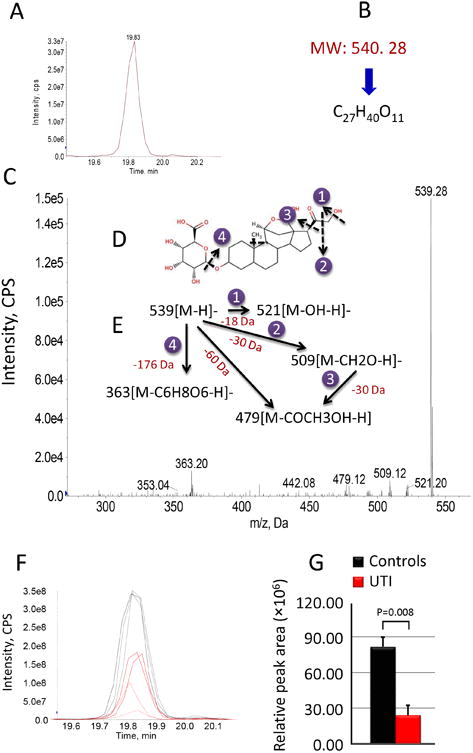
(A) The extracted ion chromatogram for m/z 539.28 (B) The matched formula confirmed by MS and MS/MS analysis. (C) MS/MS spectrum. (D) The chemical structure of tetrahydroaldosterone-3-glucuronide. (E) Proposed fragmentation pathway based on collisionally induced dissociation (CID). (F) Overlaid chromatograms reveal the relative distribution of tetrahydroaldosterone-3-glucuronide between controls and E.coli UTI patients. (G) A bar plot of relative tetrahydroaldosterone-3-glucuronide levels between controls and E.coli UTI patients.
Table 2. Summary of differentiated metabolites.
| # | parent ions | Retention time (min) | VIP | formula | metabolite ID | metabolic Pathway | HMDB ID | PubChem ID | KEGG ID | p value1 | trends2 |
|---|---|---|---|---|---|---|---|---|---|---|---|
| 1 | 307.18 | 12.67 | 15.42 | C6H14O10P2 | diphosphomevalonate | terpenoid backbone biosynthesis | HMDB01090 | 516 | C01143 | <0.05 | increase |
| 2 | 539.28 | 19.83 | 10.97 | C27H40O11 | tetrahydroaldosterone-3-glucuronide | pentose and glucuronate interconversions & Starch and sucrose metabolism | HMDB10357 | 167918 | C03033 | <0.05 | decrease |
| 3 | 331.19 | 21.46 | 9.57 | C21H32O3 | 21-hydroxypregnenolone | steroid hormone biosynthesis | HMDB04026 | 440705 | C05485 | <0.05 | increase |
| 4 | 308.16 | 12.67 | 9.25 | C11H19NO9 | N-acetylneuraminic acid | amino sugar and nucleotide sugar metabolism | HMDB00230 | 439197 | C00270 | <0.05 | increase |
| 5 | 526.45 | 24.84 | 9.14 | C16H25N4O10P2S | 3-carboxy-1-hydroxypropyl-ThPP | citrate cycle (TCA cycle) | HMDB06744 | 440649 | C05381 | <0.05 | decrease |
| 6 | 525.43 | 19.45 | 8.28 | C24H40N5O8 | desmosine | amino acids and amino acid conjugates metabolism | HMDB00572 | 25435 | - | <0.05 | increase |
| 7 | 495.26 | 26.45 | 7.67 | C27H44O8 | pregnanediol-3-glucuronide | pentose and glucuronate interconversions & starch and sucrose metabolism | HMDB10318 | 123796 | C03033 | <0.05 | decrease |
| 8 | 369.18 | 26.79 | 7.57 | C20H34O6 | 6-keto-prostaglandin F1a | arachidonic acid metabolism | HMDB02886 | 5280888 | C05961 | <0.05 | increase |
| 9 | 541.31 | 17.94 | 5.73 | C27H42O11 | cortolone-3-glucuronide | pentose and glucuronate interconversions & starch and sucrose metabolism | HMDB10320 | 125853 | C03033 | <0.05 | decrease |
It is considered as significant difference in this study when P value is less than 0.05
Urinary level in patients with UTI when comparing with controls.
3.5 Enrichment and topology analyses of metabolic pathways
To identify the most relevant pathways in this study we used MetPA (Metabolomic Pathway Analysis, http://metpa.metabolomics.ca) 20-22, a web-based tool that combines results from pathway enrichment analyses with results from pathway topology analyses 19. Relative levels for each of the nine differential metabolites were uploaded to the MetPA platform. First, relative peak areas were normalized by Pareto scaling in accordance with previous chemometric analysis. Compound ID associations were determined by matching to HMDB, PubChem, and Kegg. In this study, the Homo sapiens (human) [80 pathways] was selected for further pathways enrichment and topology analyses. The nine differential metabolites were all well matched to specific ID numbers that serve as barcodes for pathways searching by HMDB, PubChem, and Kegg.
Next, pathway enrichment and pathways topology analyses were performed. Seven pathways were identified, authenticated and ranked by calculating pathway impact. The top-ranking pathway is the TCA cycle, followed by terpenoid backbone biosynthesis, amino sugar and nucleotide sugar metabolism, starch and sucrose metabolism & pentose and glucuronate interconversions, arachidonic acid metabolism and steroid hormone biosynthesis (Fig 10A). Six of the nine differentiated metabolites were supported by these the known pathway analyses. Of these, 3-carboxy-1-hydroxypropyl-ThPP (Fig 10B) and tetrahydroaldosterone-3-glucuronide (Figs 10E and G), were significantly lower (p<0.05) in UTI patients while diphosphomevalonate (Fig 10C), N-acetylneuraminic acid (Fig 10D), 6-keto-prostaglandin F1a (Fig 10F), and 21-hydroxypregnenolone (Fig 10H) were significantly (p<0.05) higher in UTI patients. Variations in these metabolites were associated with perturbations in TCA cycle, pentose and glucuronate interconversions & starch and sucrose metabolism, terpenoid backbone biosynthesis, amino sugar and nucleotide sugar metabolism, arachidonic acid metabolism, and steroid hormone biosynthesis.
Fig 10. Pathway enrichment and topology analysis.
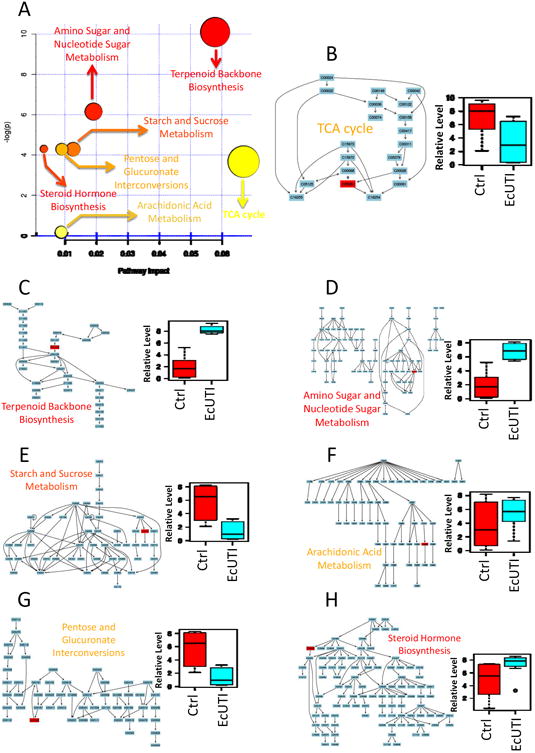
A. Summary of pathway impact based on KEGG pathway networks; (B) TCA cycle with a bar plot of 3-carboxy-1-hydroxypropyl-ThPP (p<0.05); (C) Terpenoid backbone biosynthesis with a bar plot of diphosphomevalonate (p<0.05); (D) Amino sugar and nucleotide sugar metabolism with a bar plot of N-acetylneuraminic acid (p<0.05); (E) Starch and sucrose metabolism with a bar plot of tetrahydroaldosterone-3-glucuronide (p<0.05); (F) Arachidonic acid metabolism with a bar plot of 6-keto-prostaglandin F1a (p<0.05); (G) Pentose and glucuronate interconversions with a bar plot of tetrahydroaldosterone-3-glucuronide (p<0.05); (H) Steroid hormone biosynthesis with bar plot of 21-hydroxypregnenolone (p<0.05). Ctrl\: controls; EcUTI: E.coli UTI patient.
4. Discussions and Conclusion
Here we describe an integrated approach to identify characteristic urinary metabolomic changes in patients with E. coli urinary tract infection. Because urinary metabolomic characterization in UTI patients is largely unexplored, this approach was designed to be sensitive to as many analyte types as possible while permitting a degree of sample throughput necessary for a patient-oriented study. We also sought to use methods and analytic resources that are accessible enough to permit application to other urological conditions that may benefit from a similar discovery effort. The resulting workflow reflects these priorities and was robust and reproducible enough to yield pathway data in a small patient study.
This approach reflected the goal of using widely available instrumentation with minimally-processed urinary specimens in which loss of molecular diversity was minimized. UTI patient specimens were simply centrifuged to remove cellular debris and frozen with a protease inhibitor to minimize artifactual post-collection proteolysis by inflammatory infiltrates. Thawed samples were diluted in water and filtered to avoid clogging and ion suppression. Optimal performance of the phenyl-hexyl column with these complex samples likely reflects the mixed normal and reversed phase character of this column chemistry with additional improvements deriving from the Fused-Core® column particles. This combination of stationary phase chemistry and particle construction was superior to the 2.2 μm particle C18 UPLC column of similar dimensions and was run below the typical ultrahigh pressure regimen, making this protocol accessible to more researchers. The hybrid linear ion trap/triple quadrupole mass spectrometer was sufficient to provide reproducible chemometric data while also providing useful data for structural characterization using MS/MS. The triple quadrupole mode also permits rapid construction of multiple reaction monitoring assays for validation studies on the same instrument without changing chromatographic or ionization parameters. Overall, the analytical setup was rapid and reproducible as judged by systematic quality control (QC) sample analysis.
Where multiple discovery analyses could be applied to chemometric data we selected differentially-expressed metabolites by consensus from three different methods to diminish the impact of method-associated biases. This reduced the number of candidate differential metabolites from 19 identified by all three methods combined to a consensus list of nine. While reasonable metabolites may have been excluded, we felt this conservative approach was justified for initial investigation with a relatively small patient sample. Mass and fragmentation analysis with reference to metabolomic databases (Figure 9, see Table 2) were used to identify the nine consensus metabolites differentiating the UTI and control groups. MetPA assigned six associated metabolic pathways to these nine structures (Figure 10). Among these pathways, the most consistently represented metabolite class–steroid derivatives- was also the most surprising. Two metabolites involved in steroid hormone biosynthesis were both higher in the UTI group while all three glucuronated steroid metabolites were lower. While this pattern could represent host responses designed to increase steroid hormone levels during infection, it may partially reflect a bacterial metabolic contribution from the pathogen.
Although E. coli are not known to synthesize steroid hormones, they are known to possess a glucuronidase capable of degrading glucuronidated compounds, suggesting a possible endocrine interaction between host and pathogen. N-acetylneuraminic acid (NANA), representing amino sugar metabolic pathways was present at higher levels in the UTI group and may also represent direct contributions from both host and pathogen. Free urinary N-acetylneuraminic acid maybe released from proteins, glycolipids, and mucinsat the bladder surface. E. coli can also synthesize NANA as a virulence-associated capsule component. Alternatively, E. coli possess NANA-uptake systems designed to scavenge and metabolize free sialic acid from their surroundings 23. Elevated NANA may serve as an environmental cue or even a metabolic substrate for urinary pathogens.
Consistent with tissue degradation as a urinary NANA source is increased urinary desmosine, an amino acid conjugate not formed de novo as a small molecule but rather from lysyl oxidase-mediated lysine crosslinking in connective tissue. Free desmosine is released when proteases such as neutrophil elastase degrade elastin or collagen 24, 25. In UTI patients, inflammatory cell activation in bladder tissue is the likely origin of this metabolite. Elevated urinary desmosine has been observed in cystic fibrosis, where it may derive from infection-associated lung inflammation 26.
A priori, metabolomic analysis involving an infectious process would be expected to identify inflammation response-associated molecules and pathways. Consistent with this expectation, we observed elevated levels of an arachidonic acid pathway member, 6-keto-prostaglandin F1a, in UTI patients. This is a degradation product of the more unstable prostacyclin PGI2 which exerts anti-inflammatory effects similarly to glucocorticoids 27.
Together this work describes an integrated approach to understanding the urinary metabolomic changes that accompany a common infectious disease. The methods and instrumentation used are highly accessible and identified consistent and plausible results. Correlational data obtained from this initial study were interpreted cautiously by consensus scoring and yielded a set of plausible and, in many cases related, metabolites. Pathway analysis revealed both expected UTI associations, such as activation of inflammatory mediators, and unexpected associations such as steroid biosynthesis and degradation pathways. These results provide additional insights into human infection pathogenesis in addition to identifying metabolomic alterations from urinary tract bacteria that may complicate unrelated urinary metabolomic analyses
Supplementary Material
Table 1. Study subjects.
| Characteristics | Controls (n=8) | patients (E.coli) (n=4) | Patients (mixed Gram positives) (n=5) | Patients (E.coli and mixed Gram positives) (n=5) |
|---|---|---|---|---|
| age (range, year) | 26-40 | 20-30 | 20-30 | 20-30 |
| culture results (# of bacteria) | N/A | 10ˆ4-10ˆ5 | 10ˆ3-10ˆ5 | 10ˆ3-10ˆ5 for E.coli; 10ˆ-10ˆ5 for MGP |
Acknowledgments
We thank Marsha Cox for processing patient specimens, the late Walter Stamm for his role in facilitating this collaboration, and Scott Hultgren for helpful discussions and sample storage. Jeffrey P. Henderson, M.D., Ph.D. holds a Career Award for Medical Scientists from the Burroughs Wellcome Fund and was also supported through NIH grants K12 HD001459-09, P30 HL101263-01, U54 AI057160 and U01DK082315 with mass spectrometry also supported by RR00954, DK20579, and DK5634.
Footnotes
The authors have no conflict of interest
References
- 1.Holmes E, Loo RL, Stamler J, Bictash M, Yap IK, Chan Q, Ebbels T, De Iorio M, Brown IJ, Veselkov KA, Daviglus ML, Kesteloot H, Ueshima H, Zhao L, Nicholson JK, Elliott P. Human metabolic phenotype diversity and its association with diet and blood pressure. Nature. 2008;453:396–400. doi: 10.1038/nature06882. [DOI] [PMC free article] [PubMed] [Google Scholar]
- 2.Yap K, Brown IJ, Chan Q, Wijeyesekera A, Garcia-Perez I, Bictash M, Loo RL, Chadeau-Hyam M, Ebbels T, De Iorio M, Maibaum E, Zhao L, Kesteloot H, Daviglus ML, Stamler J, Nicholson JK, Elliott P, Holmes E. J Proteome Res. 2010;9:6647–6654. doi: 10.1021/pr100798r. [DOI] [PMC free article] [PubMed] [Google Scholar]
- 3.Sreekumar A, Poisson LM, Rajendiran TM, Khan AP, Cao Q, Yu J, Laxman B, Mehra R, Lonigro RJ, Li Y, Nyati MK, Ahsan A, Kalyana-Sundaram S, Han B, Cao X, Byun J, Omenn GS, Ghosh D, Pennathur S, Alexander DC, Berger A, Shuster JR, Wei JT, Varambally C, Beecher C, Chinnaiyan AM. Nature. 2009;457:910–914. doi: 10.1038/nature07762. [DOI] [PMC free article] [PubMed] [Google Scholar] [Research Misconduct Found]
- 4.Lewis GD, Wei R, Liu E, Yang E, Shi X, Martinovic M, Farrell L, Asnani A, Cyrille M, Ramanathan A, Shaham O, Berriz G, Lowry PA, Palacios IF, Taşan M, Roth FP, Min J, Baumgartner C, Keshishian H, Addona T, Mootha VK, Rosenzweig A, Carr SA, Fifer MA, Sabatine MS, Gerszten RE. J Clin Invest. 2008;118:3503–3512. doi: 10.1172/JCI35111. [DOI] [PMC free article] [PubMed] [Google Scholar]
- 5.Kim K, Aronov P, Zakharkin SO, Anderson D, Perroud B, Thompson IM, Weiss RH. Mol Cell Proteomics. 2009;8:558–570. doi: 10.1074/mcp.M800165-MCP200. [DOI] [PMC free article] [PubMed] [Google Scholar]
- 6.Wei J, Xie G, Zhou P, Shi P, Qiu Y, Zheng X, Chen T, Su M, Zhao A, Jia W. Int J Cancer. 2010 Dec 28; doi: 10.1002/ijc.25881. Epub ahead of print. [DOI] [PubMed] [Google Scholar]
- 7.Wikoff WR, Pendyala G, Siuzdak G, Fox HS. J Clin Invest. 2008;118:2661–2669. doi: 10.1172/JCI34138. [DOI] [PMC free article] [PubMed] [Google Scholar]
- 8.Griebling TL. DHHS, PHS, NIH, NIDDK. NIH publication; 2007. Urinary tract infection in women, Urologic Diseases in America. [Google Scholar]
- 9.Johnson JR. Clin Microbiol Rev. 1991;4:80–128. doi: 10.1128/cmr.4.1.80. [DOI] [PMC free article] [PubMed] [Google Scholar]
- 10.Henderson JP, Crowley JR, Pinkner JS, Walker JN, Tsukayama P, Stamm WE, Hooton TM, Hultgren SJ. PLoS Pathog. 2009;5:e1000305. doi: 10.1371/journal.ppat.1000305. [DOI] [PMC free article] [PubMed] [Google Scholar]
- 11.Lauridsen MB, Bliddal H, Christensen R, Danneskiold-Samsøe B, Bennett R, Keun H, Lindon JC, Nicholson JK, Dorff MH, Jaroszewski JW, Hansen SH, Cornett C. J Proteome Res. 2010;9:4545–4553. doi: 10.1021/pr1002774. [DOI] [PubMed] [Google Scholar]
- 12.Yap IK, Angley M, Veselkov KA, Holmes E, Lindon JC, Nicholson JK. J Proteome Res. 2010;9:2996–3004. doi: 10.1021/pr901188e. [DOI] [PubMed] [Google Scholar]
- 13.Rumbaugh KP. Anal Bioanal Chem. 2007;387:425–435. doi: 10.1007/s00216-006-0694-9. [DOI] [PubMed] [Google Scholar]
- 14.Want EJ, Wilson ID, Gika H, Theodoridis G, Plumb RS, Shockcor J, Holmes E, Nicholson JK. Nat Protoc. 2010;5:1005–1018. doi: 10.1038/nprot.2010.50. [DOI] [PubMed] [Google Scholar]
- 15.Qiu Y, Cai G, Su M, Chen T, Liu Y, Xu Y, Ni Y, Zhao A, Cai S, Xu LX, Jia W. J Proteome Res. 2010;9:1627–1634. doi: 10.1021/pr901081y. [DOI] [PubMed] [Google Scholar]
- 16.Czaja CA, Stamm WE, Stapleton AE, Roberts PL, Hawn TR, Scholes D, Samadpour M, Hultgren SJ, Hooton TM. J Infect Dis. 2009;200:528–536. doi: 10.1086/600385. [DOI] [PMC free article] [PubMed] [Google Scholar]
- 17.de Hoon MJL, Imoto S, Nolan J, Miyano S. Bioinformatics. 2004;20:1453–1454. doi: 10.1093/bioinformatics/bth078. [DOI] [PubMed] [Google Scholar]
- 18.Eisen MB, Spellman PT, Brown PO, Botstein D. Proc Natl Acad Sci U S A. 1998;95:14863–14868. doi: 10.1073/pnas.95.25.14863. [DOI] [PMC free article] [PubMed] [Google Scholar]
- 19.Xia J, Psychogios N, Young N, Wishart DS. Nucleic Acids Res. 2009;37(Web Server issue):W652–W660. doi: 10.1093/nar/gkp356. [DOI] [PMC free article] [PubMed] [Google Scholar]
- 20.Goeman JJ, Buhlmann P. Bioinformatics. 2007;23:980–987. doi: 10.1093/bioinformatics/btm051. [DOI] [PubMed] [Google Scholar]
- 21.Hummel M, Meister R, Mansmann U. Bioinformatics. 2008;24:78–85. doi: 10.1093/bioinformatics/btm531. [DOI] [PubMed] [Google Scholar]
- 22.Aittokallio T, Schwikowski B. Briengs in Bioinformatics. 2006;7:243–255. doi: 10.1093/bib/bbl022. [DOI] [PubMed] [Google Scholar]
- 23.Severi E, Hood DW, Thomas GH. Microbiology. 2007;153:2817–2822. doi: 10.1099/mic.0.2007/009480-0. [DOI] [PubMed] [Google Scholar]
- 24.Bruce MC, Poncz L, Klinger JD, Stern RC, Tomashefski JF, Jr, Dearborn D. Am Rev Respir Dis. 1985;132:529–535. doi: 10.1164/arrd.1985.132.3.529. [DOI] [PubMed] [Google Scholar]
- 25.Bhattacharjee S, Pennathur S, Byun J, Crowley J, Mueller D, Gischler J, Hotchkiss RS, Heinecke JW. Arch Biochem Biophys. 2001;395:69–77. doi: 10.1006/abbi.2001.2557. [DOI] [PubMed] [Google Scholar]
- 26.Goldstein RA, Starcher BC. J Clin Invest. 1978;61:1286–1290. doi: 10.1172/JCI109045. [DOI] [PMC free article] [PubMed] [Google Scholar]
- 27.Wilson SM, Shen P, Rider CF, Traves SL, Proud D, Newton R, Giembycz MA. J Immunol. 2009;183:6788–6799. doi: 10.4049/jimmunol.0902738. [DOI] [PubMed] [Google Scholar]
Associated Data
This section collects any data citations, data availability statements, or supplementary materials included in this article.