

Abstract
Purpose
Excess histone deacetylase (HDAC) activity can induce hypoacetylation of histone and non-histone protein substrates, altering gene expression patterns and cell behavior potentially associated with malignant transformation. However, HDAC expression and protein acetylation have not been studied in the context of breast cancer progression.
Experimental Design
We performed immunohistochemistry (IHC) to assess expression levels of acetylated histone H4 (ac-H4), ac-H4K12, ac-tubulin, HDAC1, HDAC2 and HDAC6 in 58 breast specimens with synchronous normal epithelium (N), ductal carcinoma in situ (DCIS), and invasive ductal carcinoma (IDC) components. Differences in IHC scoring between groups were tested for significance using non-parametric tests.
Results
From N to DCIS, there was marked reduction in histone acetylation (p<0.0001). Most cases showed similar levels of acetylation in DCIS and IDC, although some showed further reduction of ac-H4 and ac-H4K12 from DCIS to IDC. Expression of HDACs 1, 2, and 6 were also significantly reduced but by a smaller magnitude. Greater reductions of H4 acetylation and HDAC1 levels were observed from N to DCIS in ER-negative compared to ER-positive, and in high grade tumors compared to non-high grade tumors.
Conclusion
Overall, there was a global pattern of hypoacetylation associated with progression from N to DCIS to IDC. Paradoxically, this was associated with reduction in HDAC expression levels, suggesting that this hypoacetylation pattern reflects a change in the balance between HDAC and histone acetyltransferase (HAT) catalytic activities. These findings also suggest that the reversal of this hypoacetylation in DCIS and IDC could be an early measure of HDAC inhibitor activity.
Keywords: acetylation, histone deacetylase, ductal carcinoma in situ, immunohistochemistry, tumor progression
Introduction
It is commonly thought, but not yet clinically proven, that epigenetic silencing of tumor suppressor genes through the mechanism of histone deacetylation and DNA methylation is an early hallmark of malignancy. Since the 1996 discovery of the first mammalian histone deacetylase (1), 11 different zinc-dependent histone deacetylases (HDACs) have been identified and nearly a dozen different HDAC inhibitors have emerged into clinical development (2). Intracellular overexpression of HDACs can cause hypoacetylation of histones (H4, H3, H2A, H2B) and non-histone proteins (e.g. α-tubulin, p53, MyoD, E2F, ataxia-telangiectasia mutant, and heat shock protein 90), altering gene expression and cell phenotype. In 2006 the first HDAC inhibitor, suberoylanilide hydroxamic acid (SAHA, vorinostat) was FDA approved for the treatment of cutaneous T-cell lymphoma. There are now more than 30 clinical trials in the United States evaluating the clinical efficacy of this HDAC inhibitor against various malignancies including breast cancer. However, a major challenge to broadening oncology applications for this and other HDAC inhibitors is the identification of cancer biomarkers predictive of HDAC inhibitor efficacy and/or potentially useful for monitoring its antitumor activity.
Among class I HDACs (HDACs 1, 2, 3, 8), nuclear localized HDAC1 and HDAC2 are believed to regulate most of the observed changes in histone acetylation, which largely involves H4 lysine (K) residues 5, 8, 12, and 16; with K12 acetylation appearing to be one of the more sensitive indicators of HDAC inhibition (2–6). Among class IIA (HDACs 4, 5, 7, 9), class IIB (HDACs 6, 10), and class IV (HDAC 11) HDACs, the best studied is HDAC 6 which is unique among all zinc-dependent HDACs because of its novel protein structure and primary cytoplasmic localization. Such localization functions to deacetylate substrates like the microtubule component α-tubulin and thereby regulate cytoskeletal and dynein motor controlled cell migration, protein trafficking and misfolded protein accumulation within the aggresome (7).
A few reports have correlated HDAC expression levels with clinical prognosis in patients with invasive cancers including breast cancer (8–22), while others have compared histone acetylation patterns with expression of individual cancer genes (23, 24). To date however, there has not been any description of how global patterns of histone acetylation or HDAC expression levels might differ between normal epithelium and either pre-neoplastic (e.g. in situ) or fully malignant epithelial lesions arising in the same organ. The present study was undertaken to immunohistochemically assess cellular levels of histone H4 and nonhistone (α-tubulin) protein acetylation, as well as nuclear and cytoplasmic HDAC (HDAC1, 2, 6) protein expression in archived breast surgical samples containing synchronous normal mammary epithelium, ductal carcinoma in situ (DCIS), and invasive ductal carcinoma (IDC).
Materials and Methods
Case selection
As part of an IRB-approved research protocol, 61 formalin-fixed paraffin-embedded (FFPE) breast tissues with synchronous normal breast epithelium (N), in situ (DCIS) and invasive ductal cancer (IDC) were selected from pathology archives at the University of California, San Francisco. 3 cases were excluded because of inadequate quality of the samples, reducing the study number to 58 cases. All tumors were from female patients, and all cases contained N, DCIS, and IDC in the same section. Histologic grades were determined by Scarff-Bloom-Richardson (SBR) grade system for IDC, and by nuclear grade for DCIS. Two normal breast samples from reduction mammoplasties were used as positive controls.
Assay development of immunohistochemistry (IHC)
Three breast cancer cell lines, MCF7 (estrogen receptor alpha (ER) positive, progesterone receptor (PR) positive, human epidermal growth receptor type 2 (HER2) negative), SKBR3 (ER-negative, PR-negative, HER2-positive), and MDA231 (ER-negative, PR-negative, HER2-negative), were treated with 5 μM SAHA for 24 hours. These cell lines were used for IHC assay development and for Western blotting to validate the IHC assay.
Whole cell lysates used for Western blotting were prepared by harvesting cells in a buffer containing 50 mM Tris (pH 7.5), 100 mM NaCl and 2% SDS followed by a brief sonication to shear chromatin. Equal protein aliquots were combined with 2X Laemmli buffer (20 mM Tris pH 6.8, 2% SDS, 20% glycerol and 40 mM beta mercaptoethanol), heated to 95 °C for 5 minutes, electrophoresed using 4–12% gradient gels (Invitrogen), transferred to nitrocellulose (Amersham Bioscience) and probed with specific antibodies at 1:1000 dilution in hybridization buffers of 20 mM Tris pH7.5, 130 mM NaCl, 0.05% Tween-20 with 5% non-fat milk. Horseradish peroxidase (HRP) coupled goat anti-mouse (BioRad, Hercules, CA) was used for detection of bound antibodies by the manufacturer’s chemiluminescence enhancement procedure. Antibodies used included α-tubulin (Sigma), acetylated α-tubulin (Sigma), acetylated H4 (Upstate) or K12-acetylated H4 (Cell Signaling Technology, Danvers, MA).
IHC assays to detect protein acetylation and HDAC expression levels were developed using cell buttons prepared from 3 breast cancer cell lines described above. The cell lines treated with SAHA showed marked increased acetylation levels for ac-H4, particularly in MCF7, and for ac-H4K12 in all 3 cell lines to the same degree. Tubulin acetylation level was also increased with SAHA treatment of all 3 cell lines. Expression levels of all 3 HDACs did not show any change after SAHA treatment in any of cell lines. SAHA-treated MCF7 cells were chosen as the standard positive control, and the same cells unexposed to primary antibody were used as the standard negative control. IHC results with cell lines were validated by Western blotting (Fig. 1).
Fig. 1.

Inhibition of intracellular histone H4 and α-tubulin acetylation by SAHA. Human breast cancer cell lines SKBR3, MDA231 and MCF7 were treated for 24 h with indicated doses of the pan-HDAC inhibitor, SAHA. Cell lysates and cell button sections were probed for total and K12 specific H4 acetylation as well as acetylated α-tubulin as described in Materials and Methods. Dose-dependent increases in ac-H4, ac-H4K12 and ac-tubulin as detected by Western blotting are shown in the 3 cell lines. Increased expression after SAHA treatment for ac-H4 in MCF7 is shown by immunohistochemistry (original magnification, ×200).
IHC staining
Staining was performed on 5μm FFPE tissue sections using the streptavidin-biotin peroxidase method. Antibodies and dilutions used were determined as assay was developed: anti- acetyl-Histone H4 (Upstate 06-598, Lake Placid, NY, USA) at 1:100 dilution; Histone H4 (acetyl K12) (Abcam ab1761, Cambridge, MA, USA) at 1:75; Anti-Acetylated Tubulin (Sigma-Aldrich T7451, St Louis, MO, USA) at 1:400; Anti-HDAC1 (Upstate 06-720) at 1:50; HDAC2 (H-54) (Santa-Cruz Biotechnology sc-7899, Santa Cruz, CA, USA) at 1:50; HDAC6 (H-300) (Santa-Cruz Biotechnology sc-11420) at 1:100. Paraffin sections were dewaxed with xylene and passed through series of ethanol. Antigen retrieval was achieved using pressure-cooking in 10mM citrate buffer at pH 6.0 for all six antibodies. Slides were blocked in 3% H2O2 in PBS and avidin-biotin blocking reagent for ac-H4K12 and ac-tubulin, and then incubated with the primary antibodies. Binding of primary antibodies was detected by incubation with a biotinylated secondary antibody followed by avidin-biotin-horse radish peroxidase (ABC-HRP). Staining was completed with incubation with DAB/H2O2, counterstained with hematoxylin, and mounted.
IHC scoring
IHC slides were evaluated blindly by two authors (JS and YYC) without clinical and pathological information, or treatment status for cell lines. For staining with all 6 antibodies, “H-score” was used to evaluate intensity and fraction of positive cells as previously described (25). Intensity was scored from 0 to 3, with 0 presenting no staining, 1 weak, 2 moderate, and 3 strong staining. The intensity and fraction of positive cells in each slide was recorded and the H-score was calculated as a sum of the intensity of staining multiplied by percentage of stained cells for each intensity, where 0 means absence of staining and 300 is the highest score. All scores are listed in Supplemental Table 1 along with clinical and pathological data.
ER/PR/HER2 status evaluation
ER and PR status were considered clinically positive when greater than or equal to 1% of tumor nuclei were stained regardless of intensity. ER and PR were also scored using H-score for normal epithelium, DCIS, and IDC components separately. ER- or PR-negative cases in which less than 1% of cells were stained could be scored greater than 1 by H-score. HER2 was scored by criteria established by the HercepTest (DAKO), using a 0–3 scale, based on staining intensity in at least 10% of cells. Tumor cells with staining intensity 0 and 1 were considered negative for HER2 protein overexpression; those with intensity 2 were regarded indeterminate; and those with staining intensity 3 were considered positive. FISH analysis was performed on all cases showing score 2 by IHC. For FISH analysis, cases showing a ratio of HER2:centromere 17 copy number > 2.2 were considered positive for gene amplification, 1.8–2.2 were considered equivocal, and < 1.8 were considered negative.
Statistical analysis
Regression analysis and non-parametric Spearman rank correlation with significance at the 0.05 level was used to evaluate the correlation between antibodies. All data were stratified by ER status (positive vs. negative), PR status (positive vs. negative), HER2 status (positive vs. negative), SBR grades for IDC (1/2 vs. 3), nuclear grades for DCIS (low/intermediate vs. high), and age (≤ 50 vs. > 50), in each component for each antibody. A non-parametric test for non-normalized distribution of H-scores was used to compare changes in IHC markers: Mann-Whitney U test to test differences in H-scores between clinical subgroups, and Wilcoxon signed rank test to test between normal and DCIS and between DCIS and IDC for all paired samples. Significance was established at a p-value of < 0.05. All statistical analyses were performed by StatView version 5.0.1 (SAS Institute Inc).
Results
Clinical and pathological characteristics
Clinical and pathological characteristics of 58 cases, selected for concurrent normal epithelium, DCIS, and IDC, are shown in Table 1. The mean age was 53 years (range 25 to 81). 21 cases were negative for ER, PR, and HER2. Invasive cancer and DCIS showed the same grade in 35 cases, and in all but two of the remaining cases, DCIS was a single grade higher than the paired IDC. If nuclear grade alone was considered, invasive cancer and the DCIS component matched in 45 cases.
Table 1.
Clinical and pathological characteristics (n=58)
| No. of patients | (%) | |
|---|---|---|
| Age (y) | ||
| ≤ 50 | 24 | (41) |
| > 50 | 34 | (59) |
| ER | ||
| positive | 35 | (60) |
| negative | 23 | (40) |
| PR | ||
| positive | 32 | (55) |
| negative | 26 | (45) |
| HER2 | ||
| positive | 5 | (9) |
| negative | 52 | (89) |
| equivocal | 1 | (2) |
| IDC grade* | ||
| 1 | 15 | (26) |
| 2 | 23 | (40) |
| 3 | 20 | (34) |
| DCIS grade | ||
| low | 5 | (9) |
| intermediate | 21 | (36) |
| high | 32 | (55) |
| Invasive cancer size | ||
| T1 (≤ 2cm) | 44 | (76) |
| T2 (> 2, ≤ 5cm) | 14 | (24) |
| Lymph node metastasis | ||
| negative | 41 | (71) |
| positive | 17 | (29) |
| Stage | ||
| I | 36 | (62) |
| II | 19 | (33) |
| III | 3 | (5) |
tumor grade for invasive component by the Scarff-Bloom-Richardson system
Acetylation levels
Antibodies specific for acetylated lysine residues on histone H4, histone H4K12, and α-tubulin were used to assess levels of nuclear and cytoplasmic protein acetylation immunohistochemically. As expected, staining patterns for ac-H4 and ac-H4K12 were nuclear, while ac-tubulin was cytoplasmic. Overall, normal ductal epithelium showed stronger staining than either DCIS or IDC (Fig. 2). The majority of cases showed similar levels of staining in DCIS and invasive cancer, although some showed a further reduction from DCIS to invasive cancer (Table 2, Fig. 3, Fig. 4).
Fig. 2.

Acetylation and HDAC expression in normal breast epithelium, DCIS, and IDC. The three different histologic components with the 6 antibodies are shown for one representative case (#38). Ac-H4, ac-H4K12, HDAC1, and HDAC2 show nuclear staining, while ac-tubulin and HDAC6 show cytoplasmic staining with substantial heterogeneity in background staining (original magnification, ×400).
Table 2.
Acetylation and HDAC expression by immunohistochemistry
| ac-H4 | ac-H4K12 | ac-tubulin | HDAC1 | HDAC2 | HDAC6 | |||||||
|---|---|---|---|---|---|---|---|---|---|---|---|---|
| score§ | p * | score | p | score | p | score | p | score | p | score | p | |
| normal | 280 | < 0.0001 | 240 | < 0.0001 | 288 | < 0.0001 | 285 | < 0.0001 | 280 | < 0.0001 | 290 | < 0.0001 |
| DCIS | 180 | 73 | 250 | 270 | 233 | 250 | ||||||
| IDC | 150 | 0.0211 | 53 | 0.0003 | 233 | 0.0005 | 268 | 0.0046 | 190 | 0.0033 | 210 | < 0.0001 |
median H-score
Wilcoxon signed rank test for difference between paired components
Fig. 3.
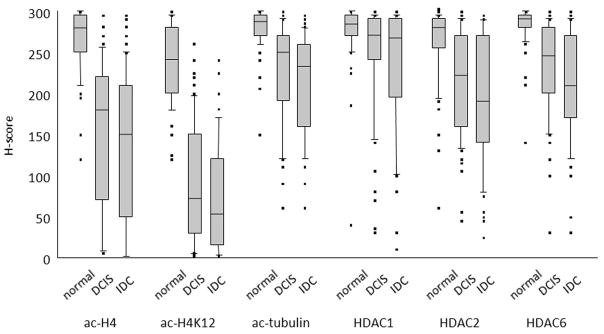
Distribution of staining by H-score. Box plot distributions are shown for normal epithelium, DCIS, and IDC. Plots show median (horizontal line), 25%–75% range (boxes), 10%–90% range (vertical lines), and outlier cases (individual points).
Fig. 4.
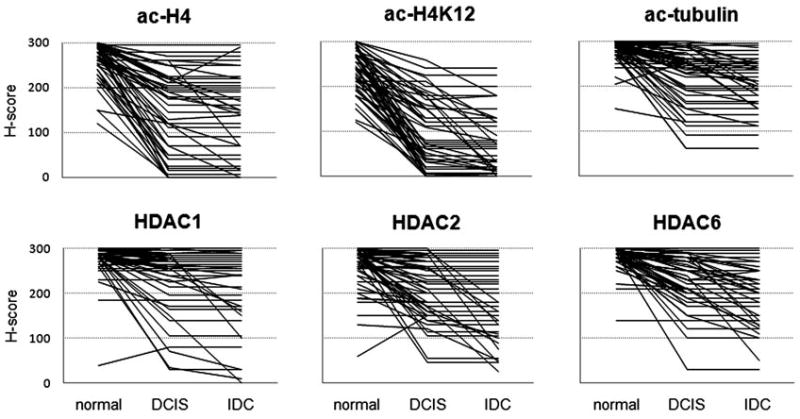
Patterns of biomarker expression during tumor progression. Each line represents the H-score for an individual case for normal epithelium, DCIS, and invasive cancer.
For ac-H4 the median H-score was reduced from 280 to 180 (36% reduction from normal to DCIS), and further reduced to 150 in IDC (46% reduction from normal to IDC). For H4K12, there was an even greater reduction (240 to 73 to 53, 70% and 78% reduction, respectively). For tubulin, the changes associated with breast cancer progression were of much smaller magnitude (288 to 250 to 233, 14% and 19% reduction). These changes were all significant by Wilcoxon signed rank test.
Within individual cases, H-scores for ac-H4 and ac-H4K12 were correlated in normal epithelium, DCIS, and IDC (R2 = 0.129, 0.199, and 0.359, respectively; all p < 0.01 by Spearman rank correlation; see also Supplemental Table 2). Ac-tubulin staining showed no correlation with either ac-H4 or ac-H4K12.
HDAC levels
Antibodies specific for HDACs 1, 2, and 6 were used to assess total cellular expression levels. As expected, HDACs 1 and 2 showed nuclear staining, while HDAC6 showed cytoplasmic staining in all samples (Fig. 2). Overall, HDAC expression also showed stronger staining for normal epithelium than for either DCIS or IDC (Table 2, Fig. 3, Fig. 4). The magnitude of the reduction in HDAC expression was generally less than that for histone acetylation. HDAC2 and HDAC6 showed greater reductions from normal (median 17% and 14% for DCIS, 32% and 28% for invasive cancer) than HDAC1 (5% and 6%). In all three HDACs expression, there was a significant reduction from normal to DCIS and from DCIS to IDC.
Interestingly, there was no correlation between HDAC1, HDAC2, and HDAC6 expression within cases. There was a weak but significant correlation between H-scores for ac-H4 and HDAC1 among all epithelial components (R2 = 0.045, 0.133, and 0.216 respectively, for normal epithelium, DCIS, and IDC; all p < 0.005).
Association with Phenotype
Other markers of tumor aggressiveness (hormone receptor status, invasive grade, DCIS grade and HER2 status) were tested for interaction with alterations in acetylation and HDAC staining. We tested whether cases with these additional markers showed differences in their patterns of acetylation or HDAC expression compared to cases without these markers.
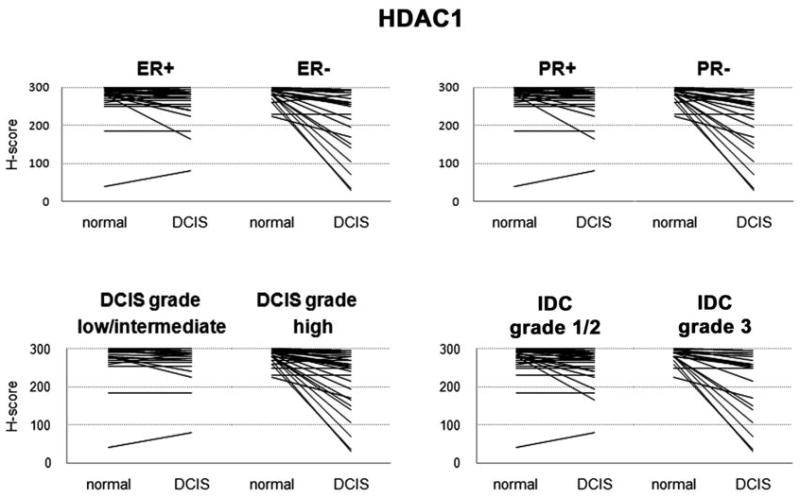
Overall, there was greater reduction from normal to DCIS/invasive cancer in the more aggressive phenotypes (ER negative, PR negative, high invasive grade, high DCIS grade) in acetylation levels (H4, H4K12, and α-tubulin) and HDAC1, but not in HDAC2 or HDAC6. For example, as described above, a distinct subset of cases showed marked reduction in HDAC1 expression from normal to DCIS (Supplemental Fig. 1); most of these cases were ER-negative, PR-negative, IDC grade 3, and DCIS high grade, and the differences between these positive vs. negative cases were all significant by nonparametric Mann-Whitney U test. Quantitation of ER and PR staining by H-score confirmed these observations. The rank correlations between H-score of ER and ac-H4, ac-H4K12, and HDAC1 were all significantly correlated, similar to analyses using dichotomized hormone receptor status.
5 HER2-positive cases were analyzed; 3 cases were ER-positive and 2 cases were ER-negative. Changes in H-scores of all 6 markers from normal to DCIS and from DCIS to IDC showed no significant differences, with the exception of HDAC6, which showed significant difference from normal to DCIS. Similarly, magnitude of changes in H-scores with cancer progression did not differ by age group (≤ 50 vs. > 50) for all 6 markers.
Discussion
In recent years, there has been a growing interest in and appreciation for the role of epigenetic regulation in cancer development. One critical epigenetic pathway involves the modulation of gene expression through the control of histone acetylation, with the extent of histone acetylation determined by the balance between the activities of histone deactylases (HDACs) and histone acetyl transferases (HATs). In some cancers lacking any genetic mutations, abnormal gene silencing has nevertheless been observed in conjunction with gene promoter methylation and histone deacetylation (26). This observation is rationale for studying the use of histone deacetylase inhibitors as novel anticancer agents. In breast cancer models, HDAC inhibitors can reactivate ERα transcription in the presence of a methylated and transcriptionally silenced ER gene (27). However, there are likely many estrogen independent pathways affected by HDAC inhibitors since ER-negative breast and other cancers respond clinically to HDAC inhibitors (28).
Our study was designed to determine whether the acetylation of both histone and non-histone substrates of HDACs, as well as HDAC expression, differed with breast cancer progression. The present study focused on three of the most representative HDACs (HDAC1, 2 and 6) and two of the most abundantly expressed substrates of these HDACs (ac-H4 and ac-tubulin). There has been very limited study of any of these biomarkers either in in vitro or in vivo studies. Further, there have been no prior evaluations of these biomarkers in the context of breast cancer progression and with regard to ER status and other clinical factors.
In the present study, acetylation of H4, H4K12, and α-tubulin were markedly reduced in DCIS and IDC relative to synchronous normal breast epithelium. Hypoacetylation of both H4 and H4K12 were highly correlated, confirming that nonspecific hypoacetylation was conferred, given that the anti-ac-H4 antibody detects acetylation at any of four lysines (K5, K8, K12, and K16) in the N-terminus of histone H4, whereas anti-ac-H4K12 antibodies specifically detect acetylation of the lysine 12 residue of H4. It has also been suggested that specific H4 lysines show ordered acetylation and deacetylation (3–6). Although the present study was not designed to detect preferential or ordered acetylation of specific lysines on H4 or other histones, this would be an interesting area for further research into specific epigenetic changes accompanying breast cancer progression. Taken together, the present results show that histone H4 hypoacetylation accompanies breast cancer progression from normal epithelium to invasive cancer. Moreover, the greatest change in H4 hypoacetylation occurs at the transition from normal to DCIS, suggesting that this is an early event in the cancer pathway.
Changes in histone H3 and H4 acetylation levels with tumor progression have been reported in other tumor types, although these reports are inconsistent. In squamous cell carcinoma of the esophagus, hypoacetylation of histone H4 was seen in tumors of more advanced stage, whereas increased acetylation was associated with better prognosis (23). In prostate cancer histone H3K9 acetylation decreased from benign hyperplasia to intraepithelial neoplasia and prostate adenocarcinoma (29). Higher acetylation levels of H3K9, H3K18, and H4K12 were similarly associated with better prognosis in this study (30). Other tumor types have shown changes in the opposite direction. Acetylation of histone H3K9 and histone H4K8 was higher in hepatocellular carcinoma than in normal or cirrhotic precursor lesions (24). In contrast to esophageal and prostate cancer, a better prognosis was seen in patients with decreased H3K9 acetylation in lung adenocarcinoma (31). Such heterogeneous results may reflect differing mechanisms of carcinogenesis in different tumor types and may be due to either specificity of acetylation targets or a range of baseline acetylation levels among organs.
Expression of all 3 HDACs decreased with tumor progression while acetylation also decreased, which was unexpected. One possible explanation for this observation is an alteration in the relative activities of both histone acetylase (HAT) and HDAC with breast cancer progression. HAT is an enzyme which modifies chromatin structure and transcriptional activities by acetylating histone. Thus, substrate acetylation levels reflect the combined activity levels of HDAC and HAT. Several proteins and genes, such as p300, BRCA2, hMOF, AIB1, and CREB-binding protein, have been reported to have intrinsic HAT activity and altered levels of their expression have been reported in variety of cancers including breast cancer (12, 34–42). In colorectal cancer, synchronous upregulation of HDAC1, p300, and CREB-binding protein has been demonstrated (12). Improved assays allowing direct measures of HDAC and HAT activities, rather than protein content, would enable better determination of the general affects of malignant progression on HAT and HDAC function, as well as correlation with acetylated protein changes.
We stratified the cohort into clinically meaningful subgroups to determine whether there existed an association between clinically validated breast cancer subtypes and the epigenetic markers studied. Interestingly, reduction in HDAC 1 expression associated with cancer progression from normal to DCIS and from DCIS to IDC was significantly larger in ER-negative compared to ER-positive, PR-negative compared to PR-positive, and high grade tumors to non-high grade tumors. HDAC6 expression was significantly reduced in high grade DCIS tumors compared to non-high grade DCIS. In contrast, published studies of HDAC expression in other solid tumors have shown opposite findings (11–18, 24). The association between tumor progression and HDAC expression levels has been studied in colorectal cancer, where up-regulation of HDAC 1 and 2 expression was observed at the polyp stage during the colorectal cancer progression (13). In prostate cancer, HDAC1 levels were low in normal and in benign hyperplasia whereas higher levels were observed even in intraepithelial neoplasia and the highest expression in invasive cancer especially androgen refractory aggressive tumors (15). However, in breast cancer, also it has been shown that HDAC6 expression is more prevalent in less advanced, less aggressive tumors (small, ER-positive, low tumor grade) and associated with better survival (8, 9), in concordance with the findings in our study.
Quantitation of IHC staining is dependent on the scoring method used, and may in part account for the variation among studies. Many biomarkers show heterogeneity of staining within a sample for both intensity and fractions of stained cells. An H-score was used for this study, as we felt that it was important to account for changes in both intensity and prevalence of staining. This method detects a broad range of expression, and is useful for development of IHC assays in which predefined thresholds are not available. Later studies may use biologically derived cut-points, or may apply quantitative digital image analysis (29). In the current study, not only was the intensity decreased from normal epithelium to DCIS/IDC, but also the fraction of positive cells decreased, so the reduction in H-score was more reliable than scoring of intensities alone. The reproducibility of the H-scores was validated in this study by staining duplicate samples to rule out intra- and inter-run variability. In addition, inter-observer and intra-observer variability in scoring were found to be negligible.
In conclusion, we found that the IHC staining of ac-H4, ac-H4K12, ac-tubulin, HDAC1, HDAC2, and HDAC6 was highest in normal epithelium, with a significant reduction in IHC staining accompanying the progression to DCIS and IDC. Ac-H4 and ac-H4K12 showed greatest reduction from normal epithelium to DCIS. All 6 biomarkers evaluated in this study were reduced among all subgroups, which supports the possible efficacy of HDAC inhibitor therapy across all ER and HER2 subsets. Clinical trials are critical to determine how effectively HDAC inhibitors could reverse the hypoacetylation observed in tumor, particularly if the proper response biomarkers are applied. Acetylation levels of histone and tubulin could both predict response and assess degree of response to HDAC targeted drug therapies. Furthermore, some epigenetic markers may be clinically relevant prognostic factors as well. We have initiated a window trial of SAHA in both ER-positive and ER-negative DCIS where histone acetylation levels of both H4 and H4K12 will be measured at baseline and following therapy. The primary outcome of interest will be to determine if a short course of HDAC inhibitors can reduce proliferation (Ki67) in DCIS, and whether degree of hypoacetylation is associated with magnitude of change in Ki67. Such clinical trials will provide important insight into how HDAC inhibitors could reverse the hypoacetylation observed in carcinogenesis, and which groups of patients might benefit most from this treatment. Our findings suggest that HDAC targeted therapy may have a role in treatment of preinvasive cancers. Further, HDAC may be a novel target for future prevention studies.
Supplementary Material
Acknowledgments
Komen Foundation, CA-367763, and Merck & Co., Inc.
We thank Ms. Loretta Chan and Dr. Frederick Baehner of UCSF Helen Diller Family Comprehensive Cancer Center Immunohistochemistry Core, and the Cancer Center Breast Oncology Program Tissue Core for their help with these experiments. We also thank Dr. Dan Moore for review of the statistical analyses.
Footnotes
Statement of Translational Relevance
Biomarkers which are able to evaluate response to histone deacetylase (HDAC) inhibitors have not yet been identified. In this study, baseline levels of candidate markers for assessment of tumor response to HDAC inhibitor treatment are evaluated in invasive and in situ disease. This is the first study to show significant changes in histone acetylation levels in the course of tumor progression from normal breast epithelium to in situ and invasive ductal carcinoma. Based on our findings, HDAC inhibitors will be expected to reverse hypoacetylation levels observed even in early stages of breast cancer progression. Since ER-negative cases also showed hypoacetylation changes during histologic progression from normal epithelium to cancer, our data support that HDAC inhibitors might be a treatment option for ER-negative breast cancer patients as well.
References
- 1.Taunton J, Hassig CA, Schreiber SL. A mammalian histone deacetylase related to the yeast transcriptional regulator Rpd3p. Science. 1996;272:408–11. doi: 10.1126/science.272.5260.408. [DOI] [PubMed] [Google Scholar]
- 2.Drummond DC, Noble CO, Kirpotin DB, Guo Z, Scott GK, Benz CC. Clinical development of histone deacetylase inhibitors as anticancer agents. Annu Rev Pharmacol Toxicol. 2005;45:495–528. doi: 10.1146/annurev.pharmtox.45.120403.095825. [DOI] [PubMed] [Google Scholar]
- 3.Ren C, Zhang L, Freitas MA, Ghoshal K, Parthun MR, Jacob ST. Peptide mass mapping of acetylated isoforms of histone H4 from mouse lymphosarcoma cells treated with histone deacetylase (HDACs) inhibitors. J Am Soc Mass Spectrom. 2005;16:1641–53. doi: 10.1016/j.jasms.2005.06.001. [DOI] [PMC free article] [PubMed] [Google Scholar]
- 4.Su X, Zhang L, Lucas DM, et al. Histone H4 acetylation dynamics determined by stable isotope labeling with amino acids in cell culture and mass spectrometry. Anal Biochem. 2007;363:22–34. doi: 10.1016/j.ab.2006.12.031. [DOI] [PMC free article] [PubMed] [Google Scholar]
- 5.Zhang L, Su X, Liu S, et al. Histone H4 N-terminal acetylation in Kasumi-1 cells treated with depsipeptide determined by acetic acid-urea polyacrylamide gel electrophoresis, amino acid coded mass tagging, and mass spectrometry. J Proteome Res. 2007;6:81–8. doi: 10.1021/pr060139u. [DOI] [PMC free article] [PubMed] [Google Scholar]
- 6.Fraga MF, Ballestar E, Villar-Garea A, et al. Loss of acetylation at Lys16 and trimethylation at Lys20 of histone H4 is a common hallmark of human cancer. Nat Genet. 2005;37:391–400. doi: 10.1038/ng1531. [DOI] [PubMed] [Google Scholar]
- 7.Matthias P, Yoshida M, Khochbin S. HDAC6 a new cellular stress surveillance factor. Cell Cycle. 2008;7:7–10. doi: 10.4161/cc.7.1.5186. [DOI] [PubMed] [Google Scholar]
- 8.Zhang Z, Yamashita H, Toyama T, et al. HDAC6 expression is correlated with better survival in breast cancer. Clin Cancer Res. 2004;10:6962–8. doi: 10.1158/1078-0432.CCR-04-0455. [DOI] [PubMed] [Google Scholar]
- 9.Saji S, Kawakami M, Hayashi S, et al. Significance of HDAC6 regulation via estrogen signaling for cell motility and prognosis in estrogen receptor-positive breast cancer. Oncogene. 2005;24:4531–9. doi: 10.1038/sj.onc.1208646. [DOI] [PubMed] [Google Scholar]
- 10.Krusche CA, Wulfing P, Kersting C, et al. Histone deacetylase-1 and -3 protein expression in human breast cancer: a tissue microarray analysis. Breast Cancer Res Treat. 2005;90:15–23. doi: 10.1007/s10549-004-1668-2. [DOI] [PubMed] [Google Scholar]
- 11.Choi JH, Kwon HJ, Yoon BI, et al. Expression profile of histone deacetylase 1 in gastric cancer tissues. Jpn J Cancer Res. 2001;92:1300–4. doi: 10.1111/j.1349-7006.2001.tb02153.x. [DOI] [PMC free article] [PubMed] [Google Scholar]
- 12.Ishihama K, Yamakawa M, Semba S, et al. Expression of HDAC1 and CBP/p300 in human colorectal carcinomas. J Clin Pathol. 2007;60:1205–10. doi: 10.1136/jcp.2005.029165. [DOI] [PMC free article] [PubMed] [Google Scholar]
- 13.Huang BH, Laban M, Leung CH, et al. Inhibition of histone deacetylase 2 increases apoptosis and p21Cip1/WAF1 expression, independent of histone deacetylase 1. Cell Death Differ. 2005;12:395–404. doi: 10.1038/sj.cdd.4401567. [DOI] [PubMed] [Google Scholar]
- 14.Weichert W, Roske A, Niesporek S, et al. Class I Histone Deacetylase Expression Has Independent Prognostic Impact in Human Colorectal Cancer: Specific Role of Class I Histone Deacetylases In vitro and In vivo. Clin Cancer Res. 2008;14:1669–77. doi: 10.1158/1078-0432.CCR-07-0990. [DOI] [PubMed] [Google Scholar]
- 15.Halkidou K, Gaughan L, Cook S, Leung HY, Neal DE, Robson CN. Upregulation and nuclear recruitment of HDAC1 in hormone refractory prostate cancer. Prostate. 2004;59:177–89. doi: 10.1002/pros.20022. [DOI] [PubMed] [Google Scholar]
- 16.Sasaki H, Moriyama S, Nakashima Y, et al. Histone deacetylase 1 mRNA expression in lung cancer. Lung Cancer. 2004;46:171–8. doi: 10.1016/j.lungcan.2004.03.021. [DOI] [PubMed] [Google Scholar]
- 17.Weichert W, Roske A, Gekeler V, et al. Histone deacetylases 1, 2 and 3 are highly expressed in prostate cancer and HDAC2 expression is associated with shorter PSA relapse time after radical prostatectomy. Br J Cancer. 2008;98:604–10. doi: 10.1038/sj.bjc.6604199. [DOI] [PMC free article] [PubMed] [Google Scholar]
- 18.Weichert W, Roske A, Gekeler V, et al. Association of patterns of class I histone deacetylase expression with patient prognosis in gastric cancer: a retrospective analysis. Lancet Oncol. 2008;9:139–48. doi: 10.1016/S1470-2045(08)70004-4. [DOI] [PubMed] [Google Scholar]
- 19.Sharma D, Blum J, Yang X, Beaulieu N, Macleod AR, Davidson NE. Release of methyl CpG binding proteins and histone deacetylase 1 from the Estrogen receptor alpha (ER) promoter upon reactivation in ER-negative human breast cancer cells. Mol Endocrinol. 2005;19:1740–51. doi: 10.1210/me.2004-0011. [DOI] [PubMed] [Google Scholar]
- 20.Zhou Q, Atadja P, Davidson NE. Histone deacetylase inhibitor LBH589 reactivates silenced estrogen receptor alpha (ER) gene expression without loss of DNA hypermethylation. Cancer Biol Ther. 2007;6:64–9. doi: 10.4161/cbt.6.1.3549. [DOI] [PubMed] [Google Scholar]
- 21.Dokmanovic M, Marks PA. Prospects: histone deacetylase inhibitors. J Cell Biochem. 2005;96:293–304. doi: 10.1002/jcb.20532. [DOI] [PubMed] [Google Scholar]
- 22.Hubbert C, Guardiola A, Shao R, et al. HDAC6 is a microtubule-associated deacetylase. Nature. 2002;417:455–8. doi: 10.1038/417455a. [DOI] [PubMed] [Google Scholar]
- 23.Toh Y, Ohga T, Endo K, et al. Expression of the metastasis-associated MTA1 protein and its relationship to deacetylation of the histone H4 in esophageal squamous cell carcinomas. Int J Cancer. 2004;110:362–7. doi: 10.1002/ijc.20154. [DOI] [PubMed] [Google Scholar]
- 24.Bai X, Wu L, Liang T, et al. Overexpression of myocyte enhancer factor 2 and histone hyperacetylation in hepatocellular carcinoma. J Cancer Res Clin Oncol. 2008;134:83–91. doi: 10.1007/s00432-007-0252-7. [DOI] [PMC free article] [PubMed] [Google Scholar]
- 25.Allred DC, Harvey JM, Berardo M, Clark GM. Prognostic and predictive factors in breast cancer by immunohistochemical analysis. Mod Pathol. 1998;11:155–68. [PubMed] [Google Scholar]
- 26.Jones PA, Baylin SB. The fundamental role of epigenetic events in cancer. Nat Rev Genet. 2002;3:415–28. doi: 10.1038/nrg816. [DOI] [PubMed] [Google Scholar]
- 27.Yang X, Ferguson AT, Nass SJ, et al. Transcriptional activation of estrogen receptor alpha in human breast cancer cells by histone deacetylase inhibition. Cancer Res. 2000;60:6890–4. [PubMed] [Google Scholar]
- 28.Munster P, Marchion D, Bicaku E, et al. Phase I trial of histone deacetylase inhibition by valproic acid followed by the topoisomerase II inhibitor epirubicin in advanced solid tumors: a clinical and translational study. J Clin Oncol. 2007;25:1979–85. doi: 10.1200/JCO.2006.08.6165. [DOI] [PubMed] [Google Scholar]
- 29.Mohamed MA, Greif PA, Diamond J, et al. Epigenetic events, remodeling enzymes and their relationship to chromatin organization in prostatic intraepithelial neoplasia and prostatic adenocarcinoma. BJU Int. 2007;99:908–15. doi: 10.1111/j.1464-410X.2006.06704.x. [DOI] [PubMed] [Google Scholar]
- 30.Seligson DB, Horvath S, Shi T, et al. Global histone modification patterns predict risk of prostate cancer recurrence. Nature. 2005;435:1262–6. doi: 10.1038/nature03672. [DOI] [PubMed] [Google Scholar]
- 31.Barlesi F, Giaccone G, Gallegos-Ruiz MI, et al. Global histone modifications predict prognosis of resected non small-cell lung cancer. J Clin Oncol. 2007;25:4358–64. doi: 10.1200/JCO.2007.11.2599. [DOI] [PubMed] [Google Scholar]
- 32.Zhang Y, Kwon S, Yamaguchi T, et al. Mice lacking histone deacetylase 6 have hyperacetylated tubulin but are viable and develop normally. Mol Cell Biol. 2008;28:1688–701. doi: 10.1128/MCB.01154-06. [DOI] [PMC free article] [PubMed] [Google Scholar]
- 33.Boyault C, Sadoul K, Pabion M, Khochbin S. HDAC6, at the crossroads between cytoskeleton and cell signaling by acetylation and ubiquitination. Oncogene. 2007;26:5468–76. doi: 10.1038/sj.onc.1210614. [DOI] [PubMed] [Google Scholar]
- 34.Muraoka M, Konishi M, Kikuchi-Yanoshita R, et al. p300 gene alterations in colorectal and gastric carcinomas. Oncogene. 1996;12:1565–9. [PubMed] [Google Scholar]
- 35.Fan S, Ma YX, Wang C, et al. p300 Modulates the BRCA1 inhibition of estrogen receptor activity. Cancer Res. 2002;62:141–51. [PubMed] [Google Scholar]
- 36.Isharwal S, Miller MC, Marlow C, Makarov DV, Partin AW, Veltri RW. p300 (histone acetyltransferase) biomarker predicts prostate cancer biochemical recurrence and correlates with changes in epithelia nuclear size and shape. Prostate. 2008;68:1097–104. doi: 10.1002/pros.20772. [DOI] [PMC free article] [PubMed] [Google Scholar]
- 37.Siddique H, Zou JP, Rao VN, Reddy ES. The BRCA2 is a histone acetyltransferase. Oncogene. 1998;16:2283–5. doi: 10.1038/sj.onc.1202003. [DOI] [PubMed] [Google Scholar]
- 38.Pfister S, Rea S, Taipale M, et al. The histone acetyltransferase hMOF is frequently downregulated in primary breast carcinoma and medulloblastoma and constitutes a biomarker for clinical outcome in medulloblastoma. Int J Cancer. 2008;122:1207–13. doi: 10.1002/ijc.23283. [DOI] [PubMed] [Google Scholar]
- 39.List HJ, Reiter R, Singh B, Wellstein A, Riegel AT. Expression of the nuclear coactivator AIB1 in normal and malignant breast tissue. Breast Cancer Res Treat. 2001;68:21–8. doi: 10.1023/a:1017910924390. [DOI] [PubMed] [Google Scholar]
- 40.Henke RT, Haddad BR, Kim SE, et al. Overexpression of the nuclear receptor coactivator AIB1 (SRC-3) during progression of pancreatic adenocarcinoma. Clin Cancer Res. 2004;10:6134–42. doi: 10.1158/1078-0432.CCR-04-0561. [DOI] [PubMed] [Google Scholar]
- 41.Luo JH, Xie D, Liu MZ, et al. Protein expression and amplification of AIB1 in human urothelial carcinoma of the bladder and overexpression of AIB1 is a new independent prognostic marker of patient survival. Int J Cancer. 2008;122:2554–61. doi: 10.1002/ijc.23399. [DOI] [PubMed] [Google Scholar]
- 42.Liu MZ, Xie D, Mai SJ, et al. Overexpression of AIB1 in nasopharyngeal carcinomas correlates closely with advanced tumor stage. Am J Clin Pathol. 2008;129:728–34. doi: 10.1309/QMDTL82JKEX6E7H2. [DOI] [PubMed] [Google Scholar]
- 43.Verdel A, Curtet S, Brocard MP, et al. Active maintenance of mHDA2/mHDAC6 histone-deacetylase in the cytoplasm. Curr Biol. 2000;10:747–9. doi: 10.1016/s0960-9822(00)00542-x. [DOI] [PubMed] [Google Scholar]
- 44.Kawai H, Li H, Avraham S, Jiang S, Avraham HK. Overexpression of histone deacetylase HDAC1 modulates breast cancer progression by negative regulation of estrogen receptor alpha. Int J Cancer. 2003;107:353–8. doi: 10.1002/ijc.11403. [DOI] [PubMed] [Google Scholar]
- 45.Hu P, Kinyamu HK, Wang L, Martin J, Archer TK, Teng C. Estrogen induces estrogen-related receptor alpha gene expression and chromatin structural changes in estrogen receptor (ER)-positive and ER-negative breast cancer cells. J Biol Chem. 2008;283:6752–63. doi: 10.1074/jbc.M705937200. [DOI] [PubMed] [Google Scholar]
Associated Data
This section collects any data citations, data availability statements, or supplementary materials included in this article.