Abstract
Compared to single energy CT, which only provides information for x-ray linear attenuation coefficients, dual-energy CT is able to obtain both the electron density and effective atomic number for different materials in a quantitative way. In this study, as an alternative to dual-energy CT, a novel quantitative imaging method based on phase contrast CT is presented. Rather than requiring two projection data sets with different x-ray energy spectra, diffraction-grating-based phase contrast CT is capable of reconstructing images of both linear attenuation and refractive index decrement from the same projection data using a single x-ray energy spectra. From the two images, quantitative information of both the electron density and effective atomic number can be extracted. Two physical phantoms were constructed and used to validate the presented method. Experimental results demonstrate that (1) electron density can be accurately determined from refractive index decrement through a linear relationship, and (2) the effective atomic number can be explicitly derived from the ratio of the linear attenuation to refractive index decrement using a power function plus a constant. The presented method will provide insight into the technique of material separation and find its use in medical and industrial applications.
1. Introduction
X-ray computed tomography (CT) is an imaging modality that is able to reconstruct an image of the distribution of linear attenuation coefficients within the scanned object. The linear attenuation coefficient describes how much a material attenuates the intensity of the incident x-ray beam of a certain energy, and its difference over different types of materials provides the contrast needed for the task of material separation in medical diagnosis, luggage inspection and other applications. However, the fact that materials of different chemical compositions may possess quite similar linear attenuation coefficients significantly limits the capability of single energy CT-based material differentiation. This problem is mostly caused by the dependence of linear attenuation coefficient on two more basic physical quantities, electron density, ρe, and the effective atomic number, Zeff. The poor soft tissue contrast in CT is partially a result of the fact that various tissues may have similar attenuation properties, despite having different ρe or Zeff. This calls for the capability of decomposing the linear attenuation coefficient into ρe and Zeff. In addition, quantitative information about ρe and Zeff is quite valuable in many applications. For instance, ρe plays a key role in treatment planning in image-guided radiation therapy, while Zeff serves as a very important index for explosive detection.
Dual-energy CT, as a solution to reconstruct the distribution of both ρe and Zeff, was proposed in the 1970s (Alvarez and Macovski 1976) and has been used in related applications. The image object is scanned with x-ray beams of different energy spectra. With two sets of measurements available, ρe and Zeff can be extracted mathematically. The difference between the two energy spectra dictates the quality of the solutions of ρe and Zeff; namely, the more similar the two x-ray spectra, the more the results suffer from noise. Ideally, the two x-ray beams would be monochromatic at two different energies to ensure the best separability, which would be available only at synchrotron facilities (Torikoshi et al 2003).
In this paper, an innovative quantitative imaging method using phase contrast CT is presented as an alternative to dual-energy CT for the calculation of ρe and Zeff. In recent years, phase contrast x-ray imaging and its CT counterpart (Davis et al 1995, Wilkins et al 1996, Chapman et al 1997, Momose et al 1996, Dilmanian et al 2000, Pfeiffer et al 2006, 2007) have been developed by taking advantage of the wave properties of x-rays. By reconstructing the decrement of the real part of the index of refraction in different materials from projection data, which is directly correlated with electron density (Bech et al 2009), phase contrast CT offers a new contrast mechanism for material differentiation. In addition to phase contrast information, the same acquired projection data set can be used to reconstruct attenuation coefficients as well. Thus, the differential phase contrast experimental setup provides multiple imaging contrast mechanisms and enables extraction of mutual information from them. In this paper, we will present how to use the two contrast mechanisms, x-ray attenuation and phase contrast, to simultaneously extract the electron density and effective atomic number for accurate material classifications. As a result, differential phase contrast CT offers a new solution for quantitative measurement of the electron density and effective atomic number. The key difference between the presented method and dual-energy CT is that the former can extract both the electron density and effective number from the same projection data set using a single x-ray spectrum, i.e. there is no need for a separate projection data set with a different energy spectrum.
2. Methods
2.1. Basic physical principles
The behavior of an x-ray when passing through an object is determined by the refractive index of the object. The refractive index is described by n = 1 − δ + iβ. The decrement of the real part of the refractive index, δ, describes the x-ray phase shift, whereas the imaginary part, β, describes the attenuation and is proportional to the linear attenuation coefficient, μ, by μ = 4πλ−1β. In conventional x-ray CT, only μ (or β equivalently) of the object is measured, while in phase contrast CT, one is able to obtain information for both δ and β. δ is related to the electron density, ρe, and energy, E, according to
| (1) |
where r0 = 2.82 × 10⁻¹⁵ m is the classical radius of the electron, ħ is the reduced Planck constant and c is the speed of light. It is easily seen that ρe can be directly retrieved from δ through a linear relationship.
Once the electron density information is known, the effective atomic number Zeff can be extracted from the attenuation coefficient μ. In the diagnostic x-ray energy range, the x-ray linear attenuation of an object at a certain energy E is composed mainly of two parts: the photoelectric cross section σpe and the scattering cross section σsc. A mathematical description of the x-ray linear attenuation coefficient is given by
| (2) |
where ρ, NA and A are the mass density, Avogadro’s number and atomic mass, respectively. σpe is approximated as
| (3) |
where m is a constant. σsc is described as a combination of the Compton and coherent scattering cross sections as
| (4) |
where ΦKN(E) and Φcoh(Z, E) are the Klein–Nishina cross section and the coherent scattering cross section, respectively. By making use of the expression of the electron density ρe = ρNAZ/A, equation (2) can be rewritten as
| (5) |
where K is a constant. If the contribution of coherent scattering to the total x-ray attenuation is negligible, equation (5) is further reduced to
| (6) |
In order to separate Z information from ρe, an index is proposed as the ratio between μ and δ:
| (7) |
where p and q are constants, n = m − 1 is a constant, and energy-related terms may be taken as constants because the x-ray energy spectrum is fixed for a given scan. Equation (7) reveals that the μ/δ ratio is related to Z of a certain material (replaced by Zeff for compositions) in an explicit functional form, i.e. a power function plus a constant, and such a relationship can be used to measure Zeff for scanned materials.
2.2. Experimental phantoms and data acquisition system
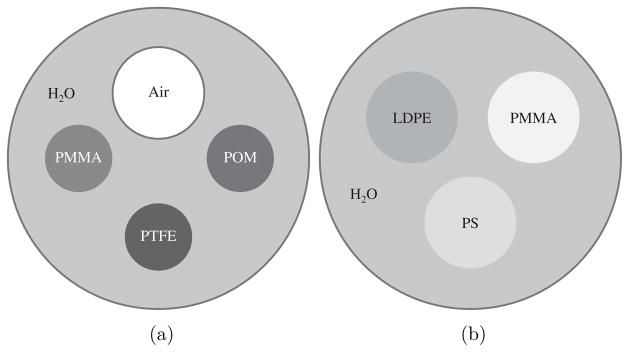
Two contrast phantoms containing several types of plastic were constructed for quantitative measurement and evaluation. The cross sections of the two contrast phantoms are shown in figure 1. In the first phantom, the PTFE (polytetrafluroethylene), PMMA (poly(methyl methacrylate)) and POM (polyoxymethylene) rods are all 4.76 mm in diameter; the air-filled tube has an inner diameter of 6.60 mm and a wall thickness of 0.80 mm, and the phantom chamber has an inner diameter of 25.4 mm and a wall thickness of 1.55 mm. In the second phantom, the LDPE (low density polyethylene), PS (polystyrene) and PMMA rods are all 6.2 mm in diameter, and the phantom chamber has an inner diameter of 22.2 mm and a wall thickness of 1.65 mm. The chemical formulae of the materials used in the two phantoms are listed in table 1, and it is from the chemical compositions of these materials that the Zeff values are calculated.
Figure 1.

Illustrations of the two experimental phantoms. In the first phantom (a), three plastic rods and one air-filled plastic tube were placed in a water-filled plastic cylinder. In the second phantom (b), three plastic rods were placed in a water-filled plastic cylinder.
Table 1.
The chemical formulae of the materials used for quantitative measurements.
| Water | PMMA | POM | PTFE | LDPE | PS | |
|---|---|---|---|---|---|---|
| Chemical formula | H2O | (C5O2H8)n | (CH2O)n | (C2F4)n | (C2H4)n | (C8H8)n |
The phantoms were scanned by an experimental phase contrast imaging system constructed at the University of Wisconsin-Madison. The system uses the previously reported grating interferometer method (Weitkamp et al 2005) to obtain the phase shift of x-rays as they propagate through a sample of interest.
The system subcomponents used in the experimental setup include x-ray gratings, a rotating-anode x-ray tube, a flat-panel x-ray detector and a rotating motion stage to enable tomographic acquisitions. The x-ray tube used is a Varian G1592 with a 1.2 mm nominal focal spot size, which is connected to a CPI Indico 100 generator. The detector is a Radicon Shad-o-Box 2048, with 48 × 48 μm2 pixels across a 1024 × 2048 array. The three gratings are fabricated using the techniques described in the literature (David et al 2007). The first grating, labeled G0, is an absorption grating with a pitch of 37 μm and a duty cycle of 40.5%, which divides the x-ray beam exiting from the tube into an array of spatially coherent line sources, allowing the use of large focal spot (≈1 mm) x-ray sources. The second grating, G1, is a phase grating with a pitch of 8 μm and a duty cycle of 50%, fabricated using a wet-etch procedure in Si. G1 is designed to introduce a π phase shift at the mean energy of the x-ray beam for half of the incident x-rays. The final grating, G2, is an absorption grating with a pitch of 4.5 μm and a duty cycle of 50%, fabricated the same way as G1, but with the additional step of electroplating gold into the grating slits. This grating acts as an analyzer so that the replicated fringe pattern from G1 is converted to an intensity distribution at the detector plane. The fringe pattern occurs with a spatial period of 4.5 μm, which is too small to be resolved directly. In order to measure intensity modulation at the detector plane, a phase stepping approach is used (Weitkamp et al 2005, Pfeiffer et al 2006, 2007). In this work, eight phase steps were used, sampled over the 4.5 μm period.
The scan was performed in a CT acquisition mode, in which 360 projections were taken at 1° increments with eight phase steps per projection. Each projection had an exposure time of approximately 80 s. The tube voltage was set to 40 kVp, with a continuous tube current of 10 mA. The source-to-isocenter distance was 1561 mm, and the source-to-detector distance was 1882 mm.
As a result of the cone beam geometry of the imaging system, both the attenuation and phase contrast images are reconstructed by FDK-type reconstruction algorithms (Feldkamp et al 1984). However, the reconstruction of the attenuation image is done by directly applying the FDK algorithm commonly used in attenuation CT, whereas the phase contrast image is reconstructed by extending a fan beam reconstruction algorithm for differential phase contrast CT to the 3D case (Qi and Chen 2008). The reconstructed image matrix is 400 × 400 × 400, with a voxel size of (100 μm)3 for the first phantom, and 500 × 500 × 250, with a voxel size of (80 μm)3 for the second.
3. Results
3.1. Reconstructed images
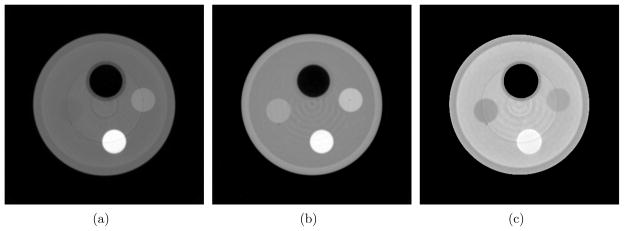
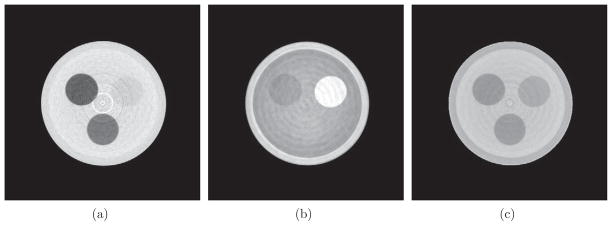
Reconstructed images of μ and δ, along with the image of their ratio, for the two phantoms are shown in figures 2 and 3. As introduced in the previous section, the δ and μ/δ images essentially give the distribution of ρe and Zeff, respectively. One of the most striking differences across the μ, δ and μ/δ images comes from the PMMA rod. There is little contrast between PMMA and the water in the μ image, due to the fact that their μ values are very close at the beam energy used. However, the PMMA-to-water contrast is larger in both the δ and μ/δ images. More interestingly, the contrast is reversed in these two images. This observation explains why their μ values are similar: μ is determined by both ρe and Zeff. This demonstrates the importance of obtaining both ρe and Zeff information. In figure 3, the δ image shows little contrast between the PS rod and the surrounding water. In this case, the ρe provides limited contrast to differentiate PS from water; however, the μ and μ/δ images considerably enhance the PS-to-water contrast due to the pronounced difference of Zeff between the two materials. This further demonstrates the need to simultaneously have both ρe and Zeff for better material differentiation capabilities.
Figure 2.

The images of three different physical quantities obtained from a differential phase contrast CT scan of the first phantom. From left to right are the images of μ (display window: [0 0.85] cm−1), δ (display window [0 0.53] ×10−6) and μ/δ (display window [0 1.70] ×105 cm−1), respectively. The arrangement of the phantom materials is shown in figure 1(a).
Figure 3.

The images of three different physical quantities obtained from a differential phase contrast CT scan of the second phantom. From left to right are the images of μ (display window [0.20 0.40] cm−1), δ (display window [0.20 0.35] ×10−6) and μ/δ (display window [0 1.70] × 105 cm−1), respectively. The arrangement of the phantom materials is shown in figure 1(b).
3.2. Quantitative measurement of ρe
A comparison was made between the electron densities derived from the CT images and reference electron densities. The reference ρe values were calculated by the equation ρe = ρNAZ/A. The electron densities from the CT images were determined by the following steps.
ROIs were selected within each material in the slice image and the mean δ values were measured.
The mean x-ray beam energy was calibrated by finding which energy gives a calculated electron density of water using equation (1) which is equal to its reference electron density.
The electron densities of the other materials were calculated using the calibrated x-ray beam energy and equation (1).
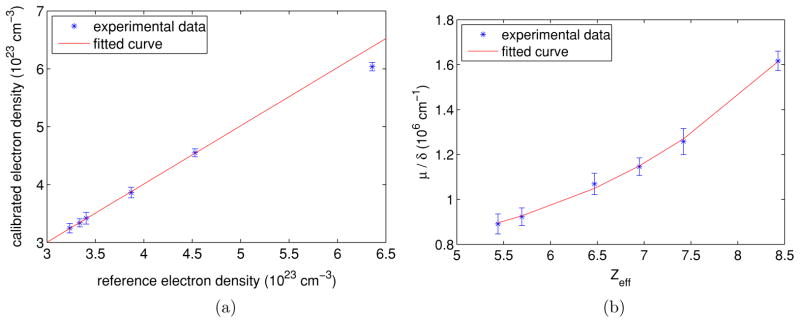
The electron density values measured from the CT images as well as the corresponding reference values are listed in table 2 and plotted in figure 4(a). The standard deviation of the electron density values within the selected ROI is used as an error estimate. The plot shows a linear relationship for the first five materials, while the slope decreases for PTFE. This decrease could be caused by (1) uncertainty of the exact mass densities for the phantom materials, which are needed for the calculation of reference ρe; (2) pronounced beam hardening effects for high-Z materials (PTFE in this case) due to the polychromatic nature of the x-ray beam used.
Table 2.
Quantitative measurement results for the reconstructed images of both attenuation contrast and phase contrast. and are reference electron density and calibrated electron density, respectively.
| μ(cm−1) | δ (10−6) | (1023 cm−3) | (1023 cm−3) | μ/δ (105 cm−1) | Zeff | |
|---|---|---|---|---|---|---|
| Water | 0.361 | 0.287 | 3.34 | 3.34 | 1.26 | 7.42 |
| PMMA | 0.355 | 0.332 | 3.87 | 3.86 | 1.07 | 6.47 |
| POM | 0.448 | 0.391 | 4.53 | 4.55 | 1.15 | 6.95 |
| PTFE | 0.839 | 0.519 | 6.36 | 6.04 | 1.62 | 8.43 |
| LDPE | 0.254 | 0.285 | 3.23 | 3.25 | 0.891 | 5.44 |
| PS | 0.277 | 0.300 | 3.40 | 3.42 | 0.923 | 5.70 |
Figure 4.

Plots of quantitative measurements for different materials and fitted curves. In (a) data points from left to right are LDPE, water, PS, PMMA, POM and PTFE, respectively; the fitted curve is a straight line for all data points except PTFE. In (b), data points from left to right are LDPE, PS, PMMA, POM, water and PTFE, respectively; a curve in the form of equation (7) was fitted over all data points. (a) versus (b) μ/δ versus Zeff.
All data points except PTFE were fitted to a linear function, i.e. by a least-squares fit, and the fitted line is shown in figure 4(a). The parameters of the fitted line are a = 1.0055 and b = −0.0123 × 1023 cm−1, and the correlation coefficient between the experimental and fitted data points is 0.9998. This demonstrates the quantitative accuracy of phase contrast CT in the measurement of electron density.
3.3. Quantitative relationship between μ/δ and Zeff
The effective atomic number Zeff was calculated by the following equation (Spiers 1946):
| (8) |
where fi is the fraction of the total number of electrons associated with each element, and Zi is the atomic number of each element. The values of μ/δ and Zeff are tabulated in table 2 and plotted in figure 4(b). The standard deviation of μ/δ values within the selected ROI is used as an error estimate. In order to determine the quantitative relationship between Zeff and μ/δ, a nonlinear optimization was applied to achieve a least-squares fit of all data points to the function form in equation (7). The fitted curve is shown in figure 4(b). The parameters were n = 3.906, p = 21.19 cm−1 and q = 7.375 × 105 cm−1. The correlation coefficient between the experimental and fitted data points was 0.9991. The fitted curve agrees well with the experimental data points. The agreement between the experimental data points and the fitted curve proves the validity of equation (7); furthermore, it demonstrates that Zeff can be quantitatively measured from phase contrast CT images using a simple function in the form of a power function plus a constant.
4. Discussions
In this study, we hypothesized that the x-ray attenuation caused by coherent scattering could be ignored, because coherent scatter accounts for only about 10% of the total interactions for the mean beam energy (≈28 keV) used in this experiment. Additionally, as a higher x-ray beam energy is used, which is the future direction of this technique to improve photon statistics, the relative contribution from coherent scattering will decrease further. Our hypothesis was validated by the excellent agreement between the proposed model (equation (7)) and the experimental data points, as shown in figure 4(b).
The proposed model demonstrated its accuracy in describing the relationship between μ/δ and Zeff for the group of materials being studied under certain experimental conditions; for other materials under different conditions, the parameters of the model may vary, and the model may need modification to incorporate new physical effects. For example, for high-Z materials which have photoelectric absorption edges within the x-ray energy spectrum, a more complex functional form would be necessary.
5. Conclusion
A novel quantitative imaging method using phase contrast CT is presented. By conducting a scan of a contrast phantom using a differential phase contrast CT setup, the method is validated to be able to provide quantitative information for both ρe and Zeff. ρe can be calculated from δ through a linear relationship; Zeff is proven to relate to μ/ρ through a simple function, and therefore can be explicitly derived. Although a grating-based differential phase contrast CT setup is employed for experimental validation, the method of obtaining the electron density and effective atomic number is also applicable to the other types of x-ray phase contrast CT systems (e.g., diffraction enhanced imaging, in-line holography and others). For a comprehensive investigation on determination of the effective atomic number, a wider Z range of materials need to be studied, and beam hardening should be carefully dealt with to find a more accurate description of the relationship between μ/δ and Zeff. In conclusion, phase contrast CT shows promise for quantitative imaging of the electron density and effective atomic number, and as a result, offers an alternative to dual-energy CT for applications related to material differentiation.
References
- Alvarez RE, Macovski A. Energy-selective reconstructions in x-ray computerised tomography. Phys Med Biol. 1976;21:733–44. doi: 10.1088/0031-9155/21/5/002. [DOI] [PubMed] [Google Scholar]
- Bech M, Jensen TH, Feidenhans’l R, Bunk O, David C, Pfeiffer F. Soft-tissue phase-contrast tomography with an x-ray tube source. Phys Med Biol. 2009;54:2747–53. doi: 10.1088/0031-9155/54/9/010. [DOI] [PubMed] [Google Scholar]
- Chapman D, Thomlinson W, Johnston RE, Washburn D, Pisano E, Gmur N, Zhong Z, Menk R, Arfelli F, Sayers D. Diffraction enhanced x-ray imaging. Phys Med Biol. 1997;42:2015–25. doi: 10.1088/0031-9155/42/11/001. [DOI] [PubMed] [Google Scholar]
- David C, Bruder J, Rohbeck T, Grüzweig C, Kottler C, Diaz A, Bunk O, Pfeiffer F. Fabrication of diffraction gratings for hard x-ray phase contrast imaging. Microelec Eng. 2007;84:1172–7. [Google Scholar]
- Davis TJ, Gao D, Gureyev TE, Stevenson AW, Wilkins SW. Phase-contrast imaging of weakly absorbing materials using hard x-rays. Nature. 1995;373:595–8. [Google Scholar]
- Dilmanian FA, Zhong Z, Ren B, Wu XY, Chapman LD, Orion I, Thomlinson WC. Computed tomography of x-ray index of refraction using the diffraction enhanced imaging method. Phys Med Biol. 2000;45:933–46. doi: 10.1088/0031-9155/45/4/309. [DOI] [PubMed] [Google Scholar]
- Feldkamp LA, Davis LC, Kress JW. Practical cone-beam algorithm. J Opt Soc Am A. 1984;1:612–9. [Google Scholar]
- Momose A, Takeda T, Itai Y, Hirano K. Phase-contrast x-ray computed tomography for observing biological soft tissues. Nat Med. 1996;2:473–5. doi: 10.1038/nm0496-473. [DOI] [PubMed] [Google Scholar]
- Pfeiffer F, Weitkamp T, Bunk O, David C. Phase retrieval and differential phase-contrast imaging with low-brilliance x-ray sources. Nat Phys. 2006;2:258–61. [Google Scholar]
- Pfeiffer F, Kottler C, Bunk O, David C. Hard x-ray phase tomography with low-brilliance sources. Phys Rev Lett. 2007;98:108105. doi: 10.1103/PhysRevLett.98.108105. [DOI] [PubMed] [Google Scholar]
- Qi Z, Chen G-H. Direct fan-beam reconstruction algorithm via filtered backprojection for differential phase-contrast computed tomography. X-ray Opt Instrum. 2008;2008:835172. [Google Scholar]
- Spiers FW. Effective atomic number and energy absorption in tissues. Br J Radiol. 1946;19:52–63. doi: 10.1259/0007-1285-19-218-52. [DOI] [PubMed] [Google Scholar]
- Torikoshi M, Tsunoo T, Sasaki M, Endo M, Noda Y, Ohno Y, Kohno T, Hyodo K, Uesugi K, Yagi N. Electron density measurement with dual-energy x-ray CT using synchrotron radiation. Phys Med Biol. 2003;48:673–85. doi: 10.1088/0031-9155/48/5/308. [DOI] [PubMed] [Google Scholar]
- Weitkamp T, Diaz A, David C, Pfeiffer F, Stampanoni M, Cloetens P, Zeigler E. X-ray phase imaging with a grating interferometer. Opt Express. 2005;12:6296–304. doi: 10.1364/opex.13.006296. [DOI] [PubMed] [Google Scholar]
- Wilkins SW, Gureyev TE, Gao D, Pogany A, Stevenson AW. Phase-contrast imaging using polychromatic hard x-rays. Nature. 1996;384:335–8. [Google Scholar]


