

Abstract
Antigen binding to the B cell receptor (BCR) triggers both BCR signaling and endocytosis. How endocytosis regulates BCR signaling remains unknown. Here we report that BCR signaling is not extinguished by BCR endocytosis, rather BCR signaling initiated at the plasma membrane continued as the BCR trafficked intracellularly with the sequential phosphorylation of kinases. Blocking BCR endocytosis resulted in the recruitment of both proximal and downstream kinases to the plasma membrane where mitogen-activated protein (MAP) kinases were hyper-phosphorylated and Akt and its downstream target Foxo were hypo-phosphorylated leading to the dysregulation of gene transcription controlled through these pathways. Thus the cellular location of the BCR serves to compartmentalize kinase activation to regulate the outcome of signaling.
Introduction
The binding of antigen to the B cell receptor (BCR) results in the assembly of a multicomponent signaling complex that ultimately triggers the transcription of a variety of genes through the activation of at least four major signaling pathways including the mitogen-activated protein (MAP) kinase and Akt signaling pathways1. Antigen binding also triggers the endocytosis of the BCR and its trafficking to specialized intracellular compartments in which antigen processing occurs2. At present, many of the components of the BCR signaling pathway and their interactions have been described and the trafficking of the BCR into antigen processing compartments has been mapped out in some detail. However, what is not known is the temporal and spatial relationship between the endocytosis of the BCR and the assembly of active signaling complexes and whether BCR endocytosis plays a role in determining the outcome of signaling
The BCR is composed of a membrane form of immunoglobulin (Ig) noncovalently associated with a disulfide-linked heterodimer of two integral membrane proteins, Igα and Igβ3. Igα and Igβ have in their cytoplasmic domains immunoreceptor tyrosine activation motifs (ITAMs) that are phosphorylated by Src family protein tyrosine kinases (PTKs) upon antigen binding resulting in the activation and recruitment of Syk4, 5. These early events trigger phosphorylation of a number of downstream substrates including adaptor molecules that are necessary for the activation of key effector enzymes6. Once activated the effector enzymes generate small molecule second messengers that activate additional effector enzymes to amplify the signal from the BCR ultimately triggering the transcription of genes associated with B cell activation. The temporal regulation of the activation of many components of the BCR signaling pathways have been described, however, where in the B cell these signaling events occur and whether the location of the BCR influences the outcome of signaling are not known.
Results from a variety of studies have established that the internalization and proper trafficking of the BCR into antigen processing compartments requires BCR signaling7. Using a combination of mice deficient in various components of the BCR signaling pathway and inhibitors of BCR signaling components evidence has been provided that a number of PTKs, adaptors and effector enzymes are required for internalization of the BCR and for efficient antigen processing and presentation8–15. Collectively, these studies highlight the importance of BCR signaling to trigger BCR internalization and trafficking. However, it is not known whether the endocytosed BCR continues to actively signal and if the intracellular location of the BCR influences the quality of the transmitted signal. In fact, internalization of the BCR has been suggested to function to extinguish active signaling16.
The endosomal system, at one time regarded as a simple pathway for the degradation or recycling of internalized cell surface receptors, is now widely recognized as an essential site of signal transduction for a number of receptors17, 18. Two well studied receptors, epidermal growth factor receptor (EGFR) and the nerve growth factor (NGF) receptor, TrKA, initiate signaling at the cell surface and continue to signal in endosomes following internalization19, 20. For these receptors optimum signaling is only achieved upon internalization. Indeed, a number of components that regulate signaling are only present on endosomes21. It has also been shown that the signals transmitted from endosomes are distinct from those that emanate from the cell surface. TrKA activates the Ras pathway transiently at the plasma membrane whereas once internalized to endosomes TrKA induces sustained MAPK activation22. In addition, in immune cells, Toll-like receptor 4 (TLR4) has been shown to activate two different signaling pathways sequentially, first inducing TIRAP-MyD88 signaling at the plasma membrane and then, following endocytosis, activating TRAM-TRIF signaling from early endosomes23. To date, intracellular signaling of the BCR has not been described and it is not clear if full BCR signaling also requires endocytosis.
Here we show that BCR signaling was initiated at the plasma membrane with the recruitment and phosphorylation of the early proximal kinases Lyn and Syk and continued after the BCR was endocytosed and trafficked through early TfR+ endosomes to late LAMP1+ endosomes and multivesicular compartments with the recruitment and phosphorylation of downstream kinases, initially cRaf and subsequently Erk, p38 and Jnk. Blocking BCR internalization using a highly specific inhibitor of endocytosis resulted in the recruitment of both proximal and downstream kinases to the plasma membrane where kinase phosphorylation was dysregulated leading to hyper-phosphorylation of MAP kinases and hypo-phosphorylation of Akt and its downstream target Foxo and dysregulation of gene transcription. These data present a new view of the control of the outcome of BCR signaling in which endocytosis does not function to extinguish signaling but rather serves to regulate kinase phosphorylation to appropriately activate target gene transcription.
Results
Temporal and spatial patterns of kinase activation
We first used transmission electron microscopy (TEM) to obtain a high-resolution map of the antigen-induced internalization of the BCR. To do so, mouse splenic B cells were incubated with rat antibodies specific for mouse IgM conjugated to electron-dense magnetic beads for various lengths of time, fixed and imaged. At time 0 the BCRs were distributed over the plasma membrane (Fig. 1a). Within 2 min of crosslinking BCRs were present both in coated pits at the cell surface and in early endosomes immediately under the plasma membrane ranging in size from 50 to 100 nm. By 10 min most BCRs were internalized and present both in early and in larger late endosomes. By 20–45 min after crosslinking the internalized BCRs accumulated intracellularly in approximately 200 – 500 nm large multivesicular compartments (Fig. 1a).
Figure 1. Spatial distribution of proximal and downstream phospho-kinases following BCR crosslinking.

(a) Mouse splenic B cells were incubated with rat antibodies specific for mouse IgM conjugated to magnetic beads for 15 min on ice. Cells were either fixed directly (0 min) or incubated at 37°C for the indicated times, fixed and imaged by TEM. Dense black dots represent the BCR indicated by white arrows. 10–15 grids were analyzed and representative images are given. Scale bars represent 500nm.
(b) Mouse splenic B cells were fixed, permeabilized and stained with Cy5-anti-IgM to detect the BCR and antibodies specific for p-Lyn, p-c-Raf, or p-JNK followed by Alexa 488-conjugated secondary antibodies (0 min). Alternatively, cells were treated with Cy5-anti-IgM to label and crosslink the BCR and incubated at 37°C for the indicated times, fixed, permeabilized and stained with antibodies specific for p-Lyn, p-c-Raf, or p-JNK followed by Alexa 488-conjugated secondary antibodies. Shown are the merged confocal images of Alexa 488 (green) and Cy5 (red) with DIC images. In the panel below each image, an intensity analysis of the p-kinase (green) and BCR (red) is given for representative cells in the plane of the image in the direction shown by the red arrow. The x-axis represents the distance of the red arrow, approximately 6 μm and the y-axis represents the fluorescent intensities of Alexa-488 (green) and Cy5 (red) from 0 to 4095 on a 12-bit scale. Approximately 100 cells were analyzed in eight different experiments and representative images are given. The results of similar analyses for p-Erk and p-p38 are given in Supplementary Fig. 1.
To determine when and where various kinases in the BCR signaling cascades were phosphorylated, mouse splenic B cells were either untreated (0 min) or incubated at 37°C with Cy5-conjugated F(ab′)2 goat antibodies specific for mouse IgM (Cy5-anti-IgM), to both label and crosslink the BCRs, for various lengths of time up to 30 min. The cells were fixed, permeabilized and stained with primary antibodies specific for phosphorylated-Lyn (p-Lyn) as a marker for a kinase activated early in the BCR signaling pathway, p-c-Raf as an intermediate kinase or p-Jnk, as a kinase activated late in the pathway. Primary antibodies were detected by Alexa 488-conjugated secondary antibodies and the cells analyzed by confocal microscopy (Fig. 1b). We quantified the fluorescence intensity of Cy5 and Alexa 488 for each image. In addition, at each time point we calculated a Pearson’s colocalization coefficient for phosphorylated kinases and the BCR (Fig. 2). Prior to the addition of the Cy5-anti-IgM at 0 min there was little detectable p-Lyn, p-c-Raf or p-Jnk in the B cells. Thirty sec following BCR crosslinking p-Lyn was first detected and it colocalized with the BCR at the plasma membrane. Within two min p-Lyn and the BCR appeared to be present in more punctate structures possibly vesicles that appeared inside the cell just under the plasma membrane. At 5 min a portion of p-Lyn continued to colocalize with the BCR at the plasma membrane and with the internalized BCR. By 30 min the p-Lyn signal decreased significantly and was nearly undetectable, whereas the majority of BCR that was inside the cell in large multi-vesicular compartments as observed by TEM (Fig. 1a), did not colocalize with p-Lyn (Figs. 1b, 2).
Figure 2. Colocalization of proximal and downstream phospho-kinases with the BCR.

The colocalization of the p-kinases and BCRs in the images of a large number of cells treated as described in Fig. 1b was analyzed. The Pearson’s colocalization coefficient is plotted for pkinases and the BCRs versus time calculated as mean ± SEM by intensity correlation analysis between Alexa 488 and Cy5. Each symbol represents the analysis of an individual cell and approximately 15–22 cells were analyzed at each time point.
A different pattern was observed for p-c-Raf. In a majority of cells initial detection of p-c-Raf occurred later than p-Lyn, approximately 2 min following BCR crosslinking, and colocalized with the BCR at the plasma membrane and possibly in vesicles underneath the plasma membrane (Figs. 1b and 2). At 15 min p-c-Raf continued to accumulate inside the cell and to colocalize with the BCR. By 30 min the p-c-Raf signal decreased significantly but that remaining was colocalized with the internalized BCR, observed by TEM to be in late endosomes and multivesicular compartments (Fig. 1a). Thus, p-c-Raf appeared later in the BCR trafficking pathway as compared to p-Lyn and accumulated in intracellular compartments in which p-Lyn was not present. Phosphorylated forms of Erk, a kinase directly downstream of c-Raf, also first appeared at approximately 2 min after BCR crosslinking at the plasma membrane and in vesicles inside the cell underneath the membrane and colocalized with the BCR (Supplementary Fig. 1 and Fig. 2). At 15 min p-Erk also continued to accumulate inside the cell and colocalized with the BCR but unlike p-c-Raf, p-Erk did not decrease with time and at 30 min remained colocalized with the BCR.
A still different pattern was observed for p-Jnk. A small amount of p-Jnk was first detected approximately 5 min after BCR crosslinking and colocalized with the BCR in intracellular vesicles (Figs. 1b, 2). Phospho-Jnk persisted and remained associated with internalized BCR through 30 min when the internalized BCR was observed by TEM in late endosomes and multivesicular compartments (Fig. 1a). Phospho-p38 showed a similar pattern and colocalized with the BCR almost exclusively in large multivesicular bodies 30 min after BCR crosslinking (Supplementary Fig. 1 and Fig. 2).
The subcellular compartments in which phosphorylated kinases were colocalized with the BCRs were further characterized. Cells were incubated for various times with anti-IgM, permeabilized and stained with Alexa 647-labeled phospho-kinase-specific antibodies and Alexa 488- conjugated antibodies specific for the transferrin receptor (TfR) to mark early endosomes or Alexa 488-conjugated antibodies specific for LAMP1 to mark late endosomal and multivesicular compartments. The confocal images were merged and the intensities of the phosphorylated kinases and BCRs across the cells were quantified (Fig. 3a). Pearson’s colocalization coefficients for phosphorylated kinases and the BCRs were also determined (Fig. 3b). The majority of the BCR colocalized with TfR+ vesicles 5–7 min following crosslinking and at 15 min was concentrated in LAMP1+ compartments (data not shown). At 7 min following BCR crosslinking most internalized p-Lyn was in TfR+ vesicles but not in LAMP1+ vesicles (Fig. 3a, b). Analysis of p-Syk showed a pattern similar to that of p-Lyn. By 15 min when the BCR had trafficked to LAMP1+ compartments, p-Lyn and p-Syk were nearly undetectable (data not shown). Seven min following BCR crosslinking both p-c-Raf and p-Erk were detected in TfR+ endosomes (Fig. 3a, b). By 15 min only a portion of p-c-Raf colocalized with LAMP1 but the majority of p-Erk was concentrated in LAMP1+ compartments (Fig. 3a, b). A pattern similar to p-Erk was observed for p-p38 and p-Jnk. P-Erk, p-p38 and p-Jnk continued to be colocalized with the BCR in LAMP1+ compartments even 45 min following BCR crosslinking (Supplementary Fig. 1).
Figure 3. Colocalization of p-kinases with TfR and LAMP1 following BCR crosslinking.

(a) Mouse splenic B cells were incubated with anti-IgM at 37°C for the indicated times. Cells were fixed, permeabilized and stained with antibodies specific for TfR or LAMP1 followed by Alexa 488-conjugated secondary antibodies (green) and with phospho-kinase specific antibodies followed by secondary antibodies conjugated to Alexa 647 (red). Shown are the confocal images of Alexa 488 and Alexa 647 merged with DIC images. In the adjacent panel to the right of each image intensity analyses of Alexa 488 (green) and Alexa 647 (red) in representative cells in the direction shown by the red arrow are given. The x-axis represents the distance of the red arrow, approximately 6μm, and the y-axis represents the fluorescent intensities of Alexa-488 (green) and Alexa 647 (red) from 0 to 4095 on a 12-bit scale. Approximately 50 cells were analyzed in three different experiments and representative images are given. (b) The Pearson’s colocalization coefficient is given for p-kinase and TfR and LAMP1.
We carried out TEM to obtain a higher resolution image of the subcellular location of phosphorylated kinases (Fig. 4). Cells were treated with anti-IgM for various times up to 45 min. At the end of incubation cells were fixed, permeabilized, and stained with antibodies specific for p-Syk, p-Erk, p-p38, and p-Jnk followed by horseradish peroxidase (HRP)-labeled secondary antibodies and developed with DAB. Phosphorylated kinases were not detectable in unstimulated cells (0 min time point). Within 3 min of BCR crosslinking p-Syk was detected at the plasma membrane and just beneath the plasma membrane in approximately 50–100 nm small vesicles. By 10 min majority of p-Syk was detected in intracellular vesicles. By 20 min the majority of cells showed no p-Syk. In the few cells that p-Syk was detected at 20 min, p-Syk was in large late endosomes and not in multi-vesicular compartments. In contrast, p-Erk, p-p38 and p-Jnk were detected exclusively in intracellular vesicles approximately 100–200 nm by 10–20 min. By 45 min phosphorylated forms of all three MAP kinases appeared to accumulate in 200–500 nm large vesicles that showed multivesicular morphology.
Figure 4. TEM images of the temporal and spatial distribution of the phosphorylation of kinases in the BCR signaling pathway.

Mouse splenic B cells were incubated with anti-IgM for the indicated times, fixed, permeabilized and stained with antibodies specific for p-Syk, p-Erk, p-p38 and p-Jnk followed by HRP-conjugated secondary antibodies and developed with DAB. Dense black areas shown by arrows represent p-kinases. Scale bars represent 500 nm. Mitochondria are denoted by ‘M’ and ‘N’ denotes nucleus. Images are taken from 10–15 grids examined for each time point.
Collectively, these data indicate distinct temporal and spatial patterns of the phosphorylation of kinases in the BCR signaling pathway. Following crosslinking the BCR first associated with p-Lyn and p-Syk and minutes later with p-c-Raf and p-Erk at the plasma membrane. As the BCR traffics into the cell into early endosomes, p-Lyn, p-Syk remained associated with the BCR in TfR+ vesicles, p-c-Raf and p-Erk continued to accumulate and p-p38 and p-Jnk appeared. As the BCR moved from TfR+ vesicles into LAMP1+ compartments p-Lyn and p-Syk were no longer detectable, the amount of BCR-associated p-c-Raf decreased and the amount of BCR-associated p-Jnk, p-Erk and p-p38 continued to accumulate in multi vesicular compartments (Supplementary Fig. 2).
The actin cytoskeleton in kinase activation
To determine if the observed spatial pattern of the phosphorylation of kinases was dependent on the actin cytoskeleton, cells were incubated with Cy5-anti-IgM in the presence or absence of latrunculin A (Lat A), which disrupts the filaments of the actin cytoskeleton by preventing F-actin polymerization (Supplementary Fig. 3). The cells were permeabilized and immunostained to detect p-Lyn, p-Syk, p-c-Raf, p-Erk, p-p38 or p-Jnk and imaged by confocal microscopy. In Lat A-treated cells the BCR failed to internalize and remained at the cell surface. However, both proximal and downstream kinases were phosphorylated and colocalized with the BCR at the plasma membrane; this mislocalization included Erk, p38 and Jnk that in untreated cells were primarily phosphorylated in LAMP1+ intracellular compartments (Supplementary Fig. 3). Thus, disruption of the actin cytoskeleton disrupted the spatial distribution of kinase phosphorylation.
Blocking endocytosis dysregulates kinase activation
Internalization of BCR-antigen complexes has been shown to occur via a clathrin- and dynamin-dependent pathway15, 24. Dynasore is a small molecule inhibitor, that reversibly and selectively inhibits dynamin 1 and 2 that are required for clatherin-mediated endocytosis and, the mitochondrial dynamin, Srp1/Drp1, but not other small GTPases25. We first determined the effect of dynasore on BCR internalization by TEM. Cells were untreated or treated with dynasore, incubated with antibodies specific for mouse IgM conjugated to electron dense magnetic beads for 15 min on ice, incubated at 37°C for up to 45 min, fixed and imaged (Fig. 5a, b). Treatment of cells with dynasore appeared to completely and reversibly (data not shown) block BCR internalization and the BCR remained on the surface throughout the entire 45 min time course. We also quantified the effect of dynasore on BCR internalization by flow cytometry measuring the amount of biotinylated anti-IgM on the surface with time using fluorescence-conjugated streptavidin. In untreated cells approximately 70% of the BCR was internalized by 30 min and this internalization was blocked nearly completely by treatment with dynasore (Fig. 5c). Collectively, these results confirm the dependence of BCR internalization on dynamin.
Figure 5. Dynasore blocks BCR internalization.

(a, b) Mouse splenic B cells were treated with 100 μM dynasore in DMSO or DMSO alone for 1 h in serum free RPMI. Cells were incubated with rat antibodies specific for mouse IgM conjugated to magnetic beads for 15 min on ice followed by incubation at 37°C for 10 min (a) or 45 min (b). Cells were fixed and imaged by TEM. Dense black dots represent the BCR indicated by white arrows. Scale bars represent 500 nm. Images are from two independent experiments in which 10–15 grids were examined for each time point.
(c) Mouse splenic B cells were incubated with 100μM dynasore in DMSO (squares) or DMSO alone (diamonds) for 1h in RPMI. Cells were either fixed directly (0 min) or incubated with biotin labeled anti-IgM for indicated times at 37°C. At the end of incubation cells were fixed and stained with streptavidin-FITC and B220-PE. Percent of BCR internalized in B220 positive cells is plotted against time. Data are from one of two independent experiments.
To determine the effect of selectively inhibiting BCR endocytosis on kinase phosphorylation, B cells were either untreated or treated with dynasore and incubated with Cy5-anti-IgM for various lengths of time, permeabilized, immunostained for p-Lyn, p-Syk, p-c-Raf, p-Erk, p-Jnk and p-p38 detected using Alexa 488-conjugated secondary antibodies and imaged by confocal microscopy. Treatment with dynasore resulted in the phosphorylation of both proximal and downstream kinases at the plasma membrane colocalized with the BCR (Fig. 6 and Supplementary Figs. 4–6).
Figure 6. The subcellular distribution of p-kinases in dynasore-treated B cells.

Mouse splenic B cells were incubated with dynasore in DMSO or in DMSO alone in RPMI. At 0 min cells were fixed, permeabilized and stained with Cy5-anti-IgM to detect the BCR and antibodies specific for p-Lyn, p-c-Raf, or p-JNK followed by Alexa 488-conjugated secondary antibodies. Alternatively cells were incubated with dynasore in DMSO or DMSO alone in RPMI with Cy5-anti-IgM for the indicated times. Cells were fixed, permeabilized and stained with Ab specific for p-Lyn, p-c-Raf or p-Jnk followed by Alexa 488-conjugated secondary antibodies. Approximately 80 cells were analyzed in five different experiments and the intensity analyses of Alexa 488 (green) and Cy5 (red) across the representative cells shown in Supplementary Fig. 4 are given. The x-axis represents a distance of approximately 6 μm and the y-axis represents the fluorescent intensities of Alexa-488 (green) and Cy5 (red) from 0 to 4095 on a 12-bit scale.
To assess if the phosphorylation of the kinases in dynasore-treated cells was quantitatively similar to that in untreated cells, the amount of phosphorylated kinases were quantified by immunoblotting of lysates from dynasore-treated and untreated cells for various times after BCR crosslinking (Fig. 7 and Supplementary Fig. 7). In addition, we analyzed Akt and MEK1 phosphorylation by immunoblotting as specific antibodies that recognize the phosphorylated forms of either protein were not effective in confocal microscopy. In untreated cells, Syk phosphorylation was maximal as early as measured, at 2 min following BCR crosslinking and declined thereafter reflecting the results from confocal microscopy. In dynasore-treated cells the temporal pattern of Syk phosphorylation was similar, however, Syk was hyper-phosphorylated at all time points. The phosphorylation of MEK1, Erk and p38 in untreated cells also appeared maximal at 2 min following BCR crosslinking although by confocal microscopy these were first detected at approximately 5 min. In dynasore-treated cells the kinases were hyper-phosphorylated at each time point as the phosphorylated forms of the kinases declined with time slowly (p38, Erk) or not significantly at all (MEKl). The phosphorylation of Jnk peaked 15 min following BCR crosslinking and dynasore treatment resulted in hyper-Jnk phosphorylation throughout the time course. In contrast, Akt showed the opposite pattern, namely hypo-phosphorylation in dynasore-treated as compared to untreated cells.
Figure 7. Inhibiting BCR endocytosis alters the level of phosphorylation of kinases in the BCR signaling pathway.

Mouse splenic B cells were either untreated or incubated with anti-IgM for indicated times in the absence (empty bars) or presence (solid bars) of dynasore. Cells were solubilized and analyzed by SDS-PAGE and immunoblotting, probing with antibodies specific for p-Syk, p-MEK1, p-Erk, p-p38, p-Akt or p-JNK. Blots were stripped and reprobed with antibodies specific for tubulin (shown in Supplementary Fig. 7). The intensities of the individual phospho-protein bands were quantified using ImageJ software and expressed as a ratio to the intensity of the tubulin band in the same lysate. Plots depicting average intensity ratio of phospho-protein to tubulin from three different experiments are shown.
To determine if the block in BCR endocytosis that resulted in hypo-phosphorylation of Akt affected Akt downstream targets, we determined the phosphorylation state of proteins in the Akt signaling pathway. Activated Akt functions to phosphorylate members of the transcription factor Forkhead Box, class O (Foxo) family whose transcriptional targets include genes encoding pro-apoptotic and anti-proliferative proteins26. In dynasore-treated cells phosphorylation of Foxo1 and Foxo3a were severely reduced (Fig. 8a). The phosphorylation of another downstream target of Akt, 4E-BP1, a component of the mRNA translational machinery was also reduced in dynasore treated cells.
Figure 8. Blocking BCR endocytosis blocks signals downstream of Akt and dysregulates transcription.
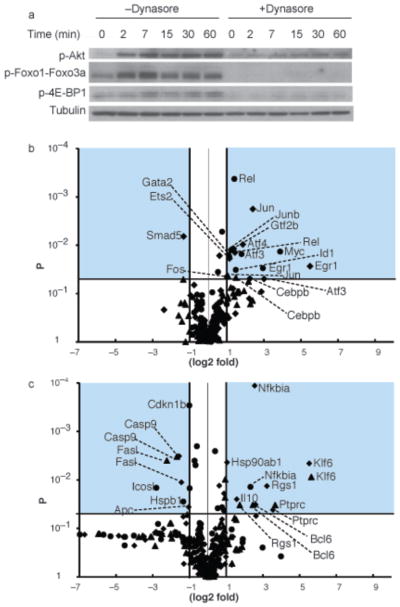
(a) Mouse splenic B cells were either untreated or incubated with anti-IgM for indicated times in the presence of dynasore in DMSO or DMSO alone in RPMI. Cells were solubilized and analyzed by SDS-PAGE and immunoblotting, probing with antibodies specific for p-Akt, p-Foxo1 or Foxo3a or p-4E-BP1. Blots were stripped and reprobed with antibodies specific for tubulin. Four different experiments were performed and representative blots are shown.
(b, c) Mouse splenic B cells were either untreated or incubated with anti-IgM for 1 h in the absence or presence of dynasore and subjected to RNA extraction. qPCR arrays were performed to determine change in expression of (b) 80 transcription factors and (c) expression of 90 genes involved in B cell activation and in Akt pathway. Shown are the volcano plots of the log2 fold difference in gene expression between untreated cells and cells treated with dynasore alone (diamonds), with anti-IgM alone (circles), and with anti-IgM plus dynasore (triangles). The yaxis represents p value of each comparison. The shaded area shows genes that showed a fold difference greater than or equal to 2 (log2 fold change ≥ 1.0 or ≤ −1.0) and a P value ≥ 0.05.
We next determined the impact of blocking BCR endocytosis on the expression of 80 transcription factors including those downstream of BCR signaling pathways and 90 genes that are involved in B cell activation and those involved in Akt pathway using a qPCR array. Gene expression in cells treated with dynasore alone, anti-IgM alone or dynasore plus anti-IgM was compared to that in untreated cells. Gene transcription was measured one hour after BCR crosslinking a window of time in which dynasore was effective in blocking endocytosis and yet still reversible. The data averaged from four independent experiments are shown in a volcano plot with log2 fold changes in gene expression on the x-axis and P values of these changes on the y-axis (Fig. 8b, c). Considering genes that changed at least two-fold in their expression we found that the expression of four genes encoding Jun and Junb downstream of Jnk27, Atf-4 that interacts with Jun28, Ets2 and Gtf2b were significantly increased only in cells treated with the combination of anti-IgM plus dynasore. The expression of Egr1, downstream of Erk29, increased in anti-IgM treated cells but increased further in anti-IgM plus dynasore treated cells. The expression of Atf-3, downstream of Jnk pathway28, and Cebpb, a transcription factor that plays an important role in regulating lymphoid cell growth and differentiation30, 31, were both increased in cells treated with anti-IgM plus dynasore to a greater degree than by anti-IgM or dynasore alone. In addition, a number of genes involved in inflammatory response such Nfkbia, Hsp90ab1, and Il10 were significantly increased in anti-IgM plus dynasore treated cells. On the other hand Bcl6, Ptprc, Rgs1 and Klf6 were upregulated and Casp9 and Fasl were downregulated both in cells treated with dynasore alone and in combination with anti-IgM. Apc, which is involved in regulation of Akt pathway, was significantly down in anti-IgM plus dynasore treated cells. Thus, restricting BCR signaling to the plasma membrane both interfered with the BCR mediated kinase phosphorylation and altered the transcription of genes associated with B cell activation.
Discussion
Here we provide evidence that antigen-induced BCR signaling is initiated at the plasma membrane and continues as the receptor is endocytosed and traffics intracellularly and that the BCRs activate different kinases in the signaling pathway at different subcellular locations. Treatment of B cells with the dynamin inhibitor, dynasore, to block BCR endocytosis resulted in dysregulation of kinase activation and of downstream gene transcription. Thus, the hierarchical subcellular compartmentalization of the BCR appears to serve as a critical regulator of BCR signaling and plays a key role in defining the outcome of signaling.
Earlier studies provided evidence that interfering with BCR internalization either by genetic depletion of clathrin and actin depolymerization in DT40 cells expressing wild type BCR16 or by mutating the tyrosines in the ITAMs of Igβ resulted in dysregulation of signaling32. In the former case ERK was hyperphosphorylated similar to our observations for wild type BCRs in spleen B cells, however, in the later Src and Syk activation was decreased but Akt and Erk activation was prolonged. These differences in results may reflect differences in the signaling capacity of the wild type BCR16 and the BCR with the mutant Igβ32. Because discrete signaling and internalization motifs have not been identified in the BCR’s Igα and Igβ cytoplasmic domains, it is not possible to attribute the effect of a mutation exclusively to a signaling versus trafficking function of the BCR. Differences in results of the three studies may also reflect the differences in the degree to which internalization was blocked. In the studies of the wild type BCR16 a complete block was achieved and in the studies the mutant BCR the block was partial. Nonetheless, these earlier findings established a molecular link between BCR internalization and signaling and suggested that BCR trafficking through endosomes leads to attenuation of signaling. In the context of the results presented here we would interpret these earlier findings differently and suggest that the observed dysregulated signaling is, in part, the result of dysregulated internalization that fails to deliver the BCR to the appropriate intracellular site for regulation of activation.
Contrary to the current view that BCR internalization functions to extinguish signaling, the results presented here show that proper signaling is only achieved when the BCR is endocytosed into the cell. It is of interest that constitutively active BCR signaling has been implicated in the survival of B cell lymphomas33. In B cell lymphomas that are dependent on the BCR for their survival BCR internalization is often blocked resulting in an increase in the number of BCRs on the plasma membrane. Our results suggest that plasma membrane retention could account for prolonged but dysregulated BCR signaling contributing to tumor survival.
An important question raised by the results presented here is: by what mechanisms does subcellular compartmentalization of internalized BCR regulate signaling and downstream gene transcription? We speculate that different endosomal compartments expose BCRs to different arrays of kinases, phosphatases, adaptors or lipid microenvironments. For example, it is possible that the decreased phosphorylation of Akt observed when BCR signaling was restricted to the plasma membrane was due to a prolonged exposure of Akt to phosphatases that it might not normally encounter intracellularly. Indeed, pleckstrin homology (PH) domain leucine-rich repeat protein phosphatase, PHLPP, that directly dephosphorylates Akt and has been shown recently to regulate Akt activity in regulatory T cells34, is also located at the plasma membrane35. Using GFP tagged Akt it was shown before that within seconds of BCR crosslinking Akt is transiently recruited to the plasma membrane for 40–50 sec and then rapidly recycled, irrespective of high PIP3 activity at the plasma membrane36. However, Akt phosphorylation was sustained for at least one hour suggesting that although initial activation of Akt requires membrane translocation, full activation is achieved in intracellular compartments. Interestingly, angiotensin II-receptor induced Akt activation also requires internalization of the receptor to EEA1 positive endosomes 37. In our studies we were unable to follow the spatial distribution of p-Akt as the available p-Akt specific antibodies are not suitable for confocal or TEM imaging. However, preliminary results using subcellular fractionation suggest the p-Akt is present in endosomal compartments by sucrose density fractionation.
The intracellular location of the BCR may also be important to provide a platform for the BCR to interact with intracellular receptors. Of particular interest are the intracellular TLRs. There is growing literature providing evidence that ITAM-containing receptors regulate TLR signaling38 and it is possible that an important feature of such receptor crosstalk is the intracellular proximity of the receptors. Indeed, we previously showed that antigen-induced BCR signaling resulted in the recruitment of TLR9 from small endocytic vesicles to autophagosome-like compartments into which the BCR trafficked39. When B cells were provided with DNA-containing antigens, such as those that drive autoimmunity, we observed enhanced activation of MAP kinases and this signaling occurred at the autophagosome- like compartments to which TLR9 was recruited. It was subsequently shown that trafficking of both BCRs and TLR9 was disrupted in anergic B cells resulting in sequestration of the BCR and TLR9 outside of late endosomes, abrogating TLR9 activation 40. Although the molecular mechanisms that mediate synergistic signaling remain to be determined, the observation reported here, that the BCR activates kinases in discrete subcellular compartments, suggests that the spatial organization of receptors will play a key role in determining the nature of their crosstalk.
The studies presented here provide a new view of BCR antigen-induced signaling in which the proper regulation of signaling is dependent on the endocytosis of the BCR and the location of the BCR in intracellular compartments. BCR endosomal signaling may provide new therapeutic targets for the regulation of hyper- or constitutive-BCR activation as occurs in autoimmune diseases and in some B cell cancers.
METHODS
Reagents, Cells and Mice
Cy5-conjugated F(ab′)2 goat antibodies specific for mouse anti-IgM (Cy5-anti-IgM), unconjugated anti-IgM, HRP-conjugated goat antibodies specific for mouse IgG and rabbit IgG were purchased from Jackson Immuno Research Laboratories. Rat antibodies specific for mouse IgM conjugated to magnetic beads were purchased from Miltenyi Biotec. Rabbit antibodies specific for phosphorylated forms of Lyn (2731), Syk (2701;2711), c-Raf (56A6), Akt (9271), MEK1 (9127), JNK (9251), p-p38 (9211) and FoxO1-FoxO3a (9464) were purchased from Cell Signaling Technology. Rabbit antibodies specific for phosphorylated forms of P-Erk(AF-1018) and p-p38(AF869) were purchased from R&D Systems Inc. Antibodies specific for transferrin receptor (C2F2) were purchased from BD biosciences. LAMP1 (1D4B)- specific antibodies were from Santa Cruz Biotechnologies Inc. Alexa 488-conjugated goat antibodies specific for mouse Ig or rabbit Ig and Alexa 565-conjugated goat antibodies specific for rat Ig or rabbit Ig were purchased from Invitrogen Corp. LatrunculinA was purchased from Calbiochem. RNeasy mini kit, RT2 first strand kit and mouse transcription factor PCR arrays were from Qiagen. C57BL/6 mice were purchased from Jackson Laboratory and B cells were purified from spleens of these mice as previously described41. All animal experiments were done in compliance with the guidelines of the Animal Care and Use Committee of the NIH.
Confocal Microscopy
Purified splenic B cells attached to poly-D-lysine coated chamber slides (Bio-Coat) were incubated with Cy5-anti-IgM in RPMI plus 2% serum at 37°C for various lengths of time, fixed with 3.7% paraformaldehyde for 20 min at 25°C and permeabilized with 0.2% Triton X-100 in PBS-BSA. Slides were blocked with 50 μg/ml of purified nonimmune goat IgG for 30 min at 25°C and incubated with specific antibodies for 2 h at 25°C. Secondary antibodies, Alexa fluor-conjugated goat antibodies specific for rabbit Ig or for rat Ig were added in the dark for 45 min at 25°C. The coverslips were washed and mounted in Prolong antifade (Invitrogen) and examined by fluorescence microscopy using a Zeiss 510 Meta or 710 Meta confocal microscope (Carl Zeiss). A Zeiss Plan-Apochromat 63X oil-immersion objective was used for image acquisition. For quantitative colocalization analysis between phospho-kinases and Cy5-anti-IgM, the Pearson’s colocalization coefficient R was calculated using Zen 2009 software program (Carl Zeiss) for the pixels with intensities above background level within a cell from the two color images taken of multiple cells.
Immunoblotting
Immunoblotting was performed as described previously42. In brief, when indicated cells (1 × 10⁷/ml) were incubated with 100 μM Dynasore DMSO or DMSO alone in serum-free RPMI media at 37°C in 5% CO2 for 1 h followed by incubation with 15 μg/ml F(ab′)2 goat antibodies specific for mouse IgM for various times. Ice-cold PBS was added to the cells and cells were centrifuged at 4°C. The cell pellets were lysed with 1% Triton X100 lysis buffer containing protease inhibitors and sodium orthovanadate on ice for 20 min. Whole cell lysates were collected and SDS-PAGE was performed in 4–15% gradient gels (Bio-Rad Laboratories) under reducing condition. The proteins were transferred and the immunoblots were probed with p-kinase specific antibodies followed by secondary antibodies conjugated with HRP. Blots were stripped with stripping buffer at 37°C for 45 min, and reprobed with antibodies specific for tubulin followed by secondary HRP-conjugated antibodies.
Electron Microscopy
Mouse splenic B cells were incubated with rat antibodies specific for mouse IgM conjugated to magnetic beads for 15 min on ice. Cells were incubated at 37°C for various times, rinsed with PBS and fixed in 4% paraformaldehyde plus 2.5% glutaraldehyde in 100 mM sodium phosphate buffer (pH 7.4) for 1 h at 25°C. To look for p-kinases with TEM cells were incubated anti-IgM at 37°C for various times, PBS rinsed with PBS and fixed in periodate-lysine-paraformaldehyde fixative containing 0.35% glutaraldehyde for 1 h at 25°C. Cells were washed and permeabilized with PBS containing 0.02% saponin for 5 min at 25°C and incubated with antibodies specific for p-Syk, p-Erk, p-p38 and p-JNK in PBS containing 0.02% saponin for 2 h followed by incubation with HRP labeled secondary antibodies. Cells were washed in PBS, fixed in 1.5% glutaraldehyde and 5% sucrose containing 0.1 M sodium phosphate (pH 7.4) for 1 h at 25°C, washed with 50 mM Tris-HCl (pH 7.4) plus 7.5% sucrose and developed with metal enhanced DAB substrate. Cells were rinsed with 50 mM Tris-HCl, (pH 7.4) containing 7.5% sucrose. Cells were pre-fixed in 100 mM sodium phosphate buffer (pH 7.4) containing 4% paraformaldehyde and 2.5% glutaraldehyde. Cells were washed with phosphate buffer and post-fixed in 0.8% potassium ferrocyanide with the 1% osmium tetroxide and washed in phosphate buffer and water. Cells were dehydrated in a graded ethanol series and embedded in Spurr’s resin. Thin sections were cut with an MT-7000 ultramicrotome (RMC). Samples were examined on a Hitachi H7500 TEM at 80 kV and images were captured with a CCD camera (Advanced Microscopy Technologies)
BCR internalization assay
BCR internalization was performed as described earlier32.
Quantitative PCR
Cells were preincubated with dynasore or DMSO in serum free RPMI for 1 h followed by incubation with anti-IgM. Incubation was stopped by adding ice cold RPMI. Cells were pelleted and RNA was extracted using RNeasy kit (Qiagen) and reverse transcribed to cDNA using RT2 first strand kit from Qiagen. Quantitative real time PCR was performed using RT2 Profiler™ PCR Array System for mouse transcription factors PCR array (PAMM-075A) by Qiagen. A custom RT2 Profiler™ PCR array was used for genes specific for B cell activation including those involved in Akt pathway. All the procedures were done following manufacturer’s recommendations. Real time qPCR data was analyzed by ΔΔCt based fold-change calculations using RT2 Profiler™ PCR Array Data Analysis software from Qiagen.
Statistical analyses
Data were analyzed by student t-test using GraphPad Prism (GraphPad software) or RT2 Profiler™ PCR Array Data Analysis software from Qiagen.
Supplementary Material
Acknowledgments
Dynasore was kindly provided by T. Kirchhausen, Harvard medical school, Boston. This work has been supported by the Intramural Research Program of the National Institutes of Health, National Institute of Allergy and Infectious Diseases.
Footnotes
Author Contribution
A.C. designed and carried out the experiments, analyzed data and wrote the manuscript; R.M. carried out experiments and analyzed the data; D.W.D. performed the TEM and interpreted the images; M.W. designed transcription analysis and analyzed the qPCR data; S.K.P. designed experiments, analyzed data and wrote the manuscript.
References
- 1.Cambier JC, Gauld SB, Merrell KT, Vilen BJ. B-cell anergy: from transgenic models to naturally occurring anergic B cells? Nat Rev Immunol. 2007;7:633–643. doi: 10.1038/nri2133. [DOI] [PMC free article] [PubMed] [Google Scholar]
- 2.Lanzavecchia A. Receptor-mediated antigen uptake and its effect on antigen presentation to class II-restricted T lymphocytes. Annual Review of Immunology. 1990;8:773–793. doi: 10.1146/annurev.iy.08.040190.004013. [DOI] [PubMed] [Google Scholar]
- 3.Reth M, Wienands J. Initiation and processing of signals from the B cell antigen receptor B. Annual Review of Immunology. 1997;15:453–479. doi: 10.1146/annurev.immunol.15.1.453. [DOI] [PubMed] [Google Scholar]
- 4.Campbell KS. Signal transduction from the B cell antigen-receptor. Curr Opin Immunol. 1999;11:256–264. doi: 10.1016/s0952-7915(99)80042-9. [DOI] [PubMed] [Google Scholar]
- 5.Kurosaki T. Genetic analysis of B cell antigen receptor signaling. Annu Rev Immunol. 1999;17:555–592. doi: 10.1146/annurev.immunol.17.1.555. [DOI] [PubMed] [Google Scholar]
- 6.Dal Porto JM, et al. B cell antigen receptor signaling 101. Mol Immunol. 2004;41:599–613. doi: 10.1016/j.molimm.2004.04.008. [DOI] [PubMed] [Google Scholar]
- 7.Clark MR, Massenburg D, Zhang M, Siemasko K. Molecular mechanisms of B cell antigen receptor trafficking. Ann N Y Acad Sci. 2003;987:26–37. doi: 10.1111/j.1749-6632.2003.tb06030.x. [DOI] [PubMed] [Google Scholar]
- 8.Malhotra S, Kovats S, Zhang W, Coggeshall KM. Vav and Rac activation in B cell antigen receptor endocytosis involves Vav recruitment to the adapter protein LAB. J Biol Chem. 2009;284:36202–36212. doi: 10.1074/jbc.M109.040089. [DOI] [PMC free article] [PubMed] [Google Scholar]
- 9.Sharma S, Orlowski G, Song W. Btk regulates B cell receptor-mediated antigen processing and presentation by controlling actin cytoskeleton dynamics in B cells. J Immunol. 2009;182:329–339. doi: 10.4049/jimmunol.182.1.329. [DOI] [PMC free article] [PubMed] [Google Scholar]
- 10.Onabajo OO, et al. Actin-binding protein 1 regulates B cell receptor-mediated antigen processing and presentation in response to B cell receptor activation. J Immunol. 2008;180:6685–6695. doi: 10.4049/jimmunol.180.10.6685. [DOI] [PMC free article] [PubMed] [Google Scholar]
- 11.Niiro H, et al. The B lymphocyte adaptor molecule of 32 kilodaltons (Bam32) regulates B cell antigen receptor internalization. J Immunol. 2004;173:5601–5609. doi: 10.4049/jimmunol.173.9.5601. [DOI] [PubMed] [Google Scholar]
- 12.Mutch CM, et al. Activation-induced endocytosis of the raft-associated transmembrane adaptor protein LAB/NTAL in B lymphocytes: evidence for a role in internalization of the B cell receptor. Int Immunol. 2007;19:19–30. doi: 10.1093/intimm/dxl118. [DOI] [PubMed] [Google Scholar]
- 13.Jacob M, Todd L, Sampson MF, Pure E. Dual role of Cbl links critical events in BCR endocytosis. Int Immunol. 2008;20:485–497. doi: 10.1093/intimm/dxn010. [DOI] [PubMed] [Google Scholar]
- 14.Snyder MD, Pierce SK. A mutation in Epstein-Barr virus LMP2A reveals a role for phospholipase D in B-Cell antigen receptor trafficking. Traffic. 2006;7:993–1006. doi: 10.1111/j.1600-0854.2006.00450.x. [DOI] [PubMed] [Google Scholar]
- 15.Malhotra S, Kovats S, Zhang W, Coggeshall KM. B cell antigen receptor endocytosis and antigen presentation to T cells require Vav and dynamin. J Biol Chem. 2009;284:24088–24097. doi: 10.1074/jbc.M109.014209. [DOI] [PMC free article] [PubMed] [Google Scholar]
- 16.Stoddart A, Jackson AP, Brodsky FM. Plasticity of B cell receptor internalization upon conditional depletion of clathrin. Mol Biol Cell. 2005;16:2339–2348. doi: 10.1091/mbc.E05-01-0025. [DOI] [PMC free article] [PubMed] [Google Scholar]
- 17.Murphy JE, Padilla BE, Hasdemir B, Cottrell GS, Bunnett NW. Endosomes: a legitimate platform for the signaling train. Proc Natl Acad Sci U S A. 2009;106:17615–17622. doi: 10.1073/pnas.0906541106. [DOI] [PMC free article] [PubMed] [Google Scholar]
- 18.Sadowski L, Pilecka I, Miaczynska M. Signaling from endosomes: location makes a difference. Exp Cell Res. 2009;315:1601–1609. doi: 10.1016/j.yexcr.2008.09.021. [DOI] [PubMed] [Google Scholar]
- 19.Vieira AV, Lamaze C, Schmid SL. Control of EGF receptor signaling by clathrin-mediated endocytosis. Science. 1996;274:2086–2089. doi: 10.1126/science.274.5295.2086. [DOI] [PubMed] [Google Scholar]
- 20.Delcroix JD, et al. NGF Signaling in Sensory Neurons: Evidence that Early Endosomes Carry NGF Retrograde Signals. Neuron. 2003;39:69–84. doi: 10.1016/s0896-6273(03)00397-0. [DOI] [PubMed] [Google Scholar]
- 21.Omerovic J, Prior IA. Compartmentalized signalling: Ras proteins and signalling nanoclusters. FEBS Journal. 2009;276:1817–1825. doi: 10.1111/j.1742-4658.2009.06928.x. [DOI] [PubMed] [Google Scholar]
- 22.Wu C, Lai CF, Mobley WC. Nerve growth factor activates persistent Rap1 signaling in endosomes. J Neurosci. 2001;21:5406–5416. doi: 10.1523/JNEUROSCI.21-15-05406.2001. [DOI] [PMC free article] [PubMed] [Google Scholar]
- 23.Kagan JC, et al. TRAM couples endocytosis of Toll-like receptor 4 to the induction of interferon-beta. Nat Immunol. 2008;9:361–368. doi: 10.1038/ni1569. [DOI] [PMC free article] [PubMed] [Google Scholar]
- 24.Stoddart A, et al. Lipid rafts unite signaling cascades with clathrin to regulate BCR internalization. Immunity. 2002;17:451. doi: 10.1016/s1074-7613(02)00416-8. [DOI] [PubMed] [Google Scholar]
- 25.Macia E, et al. Dynasore, a cell-permeable inhibitor of dynamin. Dev Cell. 2006;10:839–850. doi: 10.1016/j.devcel.2006.04.002. [DOI] [PubMed] [Google Scholar]
- 26.Huang H, Tindall DJ. Dynamic FoxO transcription factors. J Cell Sci. 2007;120:2479–2487. doi: 10.1242/jcs.001222. [DOI] [PubMed] [Google Scholar]
- 27.Shaulian E, Karin M. AP-1 as a regulator of cell life and death. Nat Cell Biol. 2002;4:E131–136. doi: 10.1038/ncb0502-e131. [DOI] [PubMed] [Google Scholar]
- 28.Hai T, Hartman MG. The molecular biology and nomenclature of the activating transcription factor/cAMP responsive element binding family of transcription factors: activating transcription factor proteins and homeostasis. Gene. 2001;273:1–11. doi: 10.1016/s0378-1119(01)00551-0. [DOI] [PubMed] [Google Scholar]
- 29.Glynne R, et al. How self-tolerance and the immunosuppressive drug FK506 prevent B-cell mitogenesis. Nature. 2000;403:672–676. doi: 10.1038/35001102. [DOI] [PubMed] [Google Scholar]
- 30.Screpanti I, et al. Lymphoproliferative disorder and imbalanced T-helper response in C/EBP beta-deficient mice. EMBO J. 1995;14:1932–1941. doi: 10.1002/j.1460-2075.1995.tb07185.x. [DOI] [PMC free article] [PubMed] [Google Scholar]
- 31.Chen X, et al. Impaired generation of bone marrow B lymphocytes in mice deficient in C/EBPbeta. Blood. 1997;90:156–164. [PubMed] [Google Scholar]
- 32.Gazumyan A, Reichlin A, Nussenzweig MC. Ig beta tyrosine residues contribute to the control of B cell receptor signaling by regulating receptor internalization. J Exp Med. 2006;203:1785–1794. doi: 10.1084/jem.20060221. [DOI] [PMC free article] [PubMed] [Google Scholar]
- 33.Davis RE, et al. Chronic active B cell receptor signaling in diffuse large B cell lymphoma. Nature. 2010;463:88–92. doi: 10.1038/nature08638. [DOI] [PMC free article] [PubMed] [Google Scholar]
- 34.Patterson SJ, et al. Cutting edge: PHLPP regulates the development, function, and molecular signaling pathways of regulatory T cells. J Immunol. 2011;186:5533–5537. doi: 10.4049/jimmunol.1002126. [DOI] [PMC free article] [PubMed] [Google Scholar]
- 35.Gao T, Furnari F, Newton AC. PHLPP: a phosphatase that directly dephosphorylates Akt, promotes apoptosis, and suppresses tumor growth. Mol Cell. 2005;18:13–24. doi: 10.1016/j.molcel.2005.03.008. [DOI] [PubMed] [Google Scholar]
- 36.Astoul E, Watton S, Cantrell D. The Dynamics of Protein Kinase B Regulation during B Cell Antigen Receptor Engagement. J Cell Biol. 1999;145:1511–1520. doi: 10.1083/jcb.145.7.1511. [DOI] [PMC free article] [PubMed] [Google Scholar]
- 37.Nazarewicz RR, et al. Early endosomal antigen 1 (EEA1) is an obligate scaffold for angiotensin II-induced, PKC-alpha-dependent Akt activation in endosomes. J Biol Chem. 2011;286:2886–2895. doi: 10.1074/jbc.M110.141499. [DOI] [PMC free article] [PubMed] [Google Scholar]
- 38.Ivashkiv LB. Cross-regulation of signaling by ITAM-associated receptors. Nat Immunol. 2009;10:340–347. doi: 10.1038/ni.1706. [DOI] [PMC free article] [PubMed] [Google Scholar]
- 39.Chaturvedi A, Dorward D, Pierce SK. The B cell receptor governs the subcellular location of Toll-like receptor 9 leading to hyperresponses to DNA-containing antigens. Immunity. 2008;28:799–809. doi: 10.1016/j.immuni.2008.03.019. [DOI] [PMC free article] [PubMed] [Google Scholar]
- 40.O’Neill SK, et al. Endocytic sequestration of the B cell antigen receptor and toll-like receptor 9 in anergic cells. Proc Natl Acad Sci U S A. 2009;106:6262–6267. doi: 10.1073/pnas.0812922106. [DOI] [PMC free article] [PubMed] [Google Scholar]
- 41.Chaturvedi A, Siddiqui Z, Bayiroglu F, Rao KV. A GPI-linked isoform of the IgD receptor regulates resting B cell activation. Nat Immunol. 2002;3:951–957. doi: 10.1038/ni839. [DOI] [PubMed] [Google Scholar]
- 42.Cheng PC, Dykstra ML, Mitchell RN, Pierce SK. A role for lipid rafts in B cell antigen receptor signaling and antigen targeting. J Exp Med. 1999;190:1549–1560. doi: 10.1084/jem.190.11.1549. [DOI] [PMC free article] [PubMed] [Google Scholar]
Associated Data
This section collects any data citations, data availability statements, or supplementary materials included in this article.