Abstract
The functions of intrinsically disordered proteins (IDPs) are governed by relationships between information encoded in their amino acid sequences and the ensembles of conformations that they sample as autonomous units. Most IDPs are polyampholytes, with sequences that include both positively and negatively charged residues. Accordingly, we focus here on the sequence–ensemble relationships of polyampholytic IDPs. The fraction of charged residues discriminates between weak and strong polyampholytes. Using atomistic simulations, we show that weak polyampholytes form globules, whereas the conformational preferences of strong polyampholytes are determined by a combination of fraction of charged residues values and the linear sequence distributions of oppositely charged residues. We quantify the latter using a patterning parameter κ that lies between zero and one. The value of κ is low for well-mixed sequences, and in these sequences, intrachain electrostatic repulsions and attractions are counterbalanced, leading to the unmasking of preferences for conformations that resemble either self-avoiding random walks or generic Flory random coils. Segregation of oppositely charged residues within linear sequences leads to high κ-values and preferences for hairpin-like conformations caused by long-range electrostatic attractions induced by conformational fluctuations. We propose a scaling theory to explain the sequence-encoded conformational properties of strong polyampholytes. We show that naturally occurring strong polyampholytes have low κ-values, and this feature implies a selection for random coil ensembles. The design of sequences with different κ-values demonstrably alters the conformational preferences of polyampholytic IDPs, and this ability could become a useful tool for enabling direct inquiries into connections between sequence–ensemble relationships and functions of IDPs.
Intrinsically disordered proteins (IDPs) feature prominently in proteins associated with transcriptional regulation and signal transduction (1, 2). IDPs fail to fold autonomously, their sequences are deficient in hydrophobic groups and enriched in polar and charged residues (3), and the thermodynamics and kinetics of coupled folding and binding are linked to the intrinsic conformational properties of IDPs (4–12).
IDP sequences include both types of charges, and at least 75% of known IDPs are polyampholytes (13). Coarse-grain parameters that are relevant for describing polyampholytes include the fraction of charged residues (FCR) and net charge per residue (NCPR), which are defined as FCR = (f+ + f−) and NCPR = | f+ − f−|, where f+ and f− denote the fractions of positive and negatively charges, respectively. Polyampholytes are either strong (FCR ≥ 0.3) or weak (FCR < 0.3) and can be neutral (NCPR ∼ 0) or have a net charge. Single molecule measurements have been used to measure the dimensions of three different polyampholytic systems (8), and a mean field model (14) that requires only FCR, NCPR, and the Debye length as inputs was successful in explaining the experimental data (8). NCPR also serves as an order parameter for predicting the distinction of polyelectrolytic IDPs into globules vs. swollen coils (7).
Can one predict the dimensions and internal structure of all polyampholytic IDPs using information regarding f+ and f− alone? Here, we answer this question by showing that NCPR is inadequate as a descriptor of sequence–ensemble relationships for a majority of IDPs, which are polyampholytes. Instead, FCR and sequence-specific distributions of oppositely charged residues are synergistic determinants of conformational properties of polyampholytic IDPs.
Quantitative studies of sequence–ensemble relationships of polyampholytic IDPs are important given the functions associated with them. Representative examples include the M domain of the yeast prion protein Sup35 (5), disordered stretches in RNA chaperones and splicing factors that undergo posttranslational modifications (15), and Pro-Glu-Val-Lys (PEVK) stretches in the giant muscle protein titin (16). The outcomes of our investigations are germane to understanding the selection of specific patterns for linear sequence distributions of oppositely charged residues that are seen in polyampholytic IDPs. For example, is it important that the Glu and Lys residues essentially alternate within PEVK stretches of titin? Will changes to the linear sequence patterning of oppositely charged residues influence the passive elasticity of titin under physiologically relevant extensional forces? To be able to answer these types of questions, we present a framework for sequence–ensemble relationships of polyampholytic IDPs that is based on results from atomistic Metropolis Monte Carlo simulations. We use the ABSINTH (self-assembly of biomolecules studied by an implicit, novel, and tunable Hamiltonian) implicit solvation model and force field paradigm (17), a combination that has yielded verifiably accurate results for other IDPs (7, 18). We introduce a patterning parameter κ to distinguish between different sequence variants based on the linear sequence distributions of oppositely charged residues. We show that the types of conformations accessible to polyampholytes are governed by a combination of their κ- and FCR values. Finally, we introduce a scaling theory to explain the dependence of conformational properties on κ and show that de novo sequence design can be used to modulate sequence–ensemble relationships of polyampholytic IDPs.
Results
Parameter κ.
A blob refers to the number of residues beyond which the balance of chain–chain, chain–solvent, and solvent–solvent energies is of order kT (19). Here, T denotes temperature, and k is Boltzmann’s constant. The radius of gyration of a g residue blob scales as g1/2, and for sequences lacking in proline residues, g ∼ 5 (20). The overall charge asymmetry is defined as  (19). For each sequence variant, we calculate κ by partitioning the sequence into Nblob overlapping segments of size g. For each g residue segment, we calculate
  , which is the charge asymmetry for blob i in the sequence of interest. We quantify the squared deviation from σ as
  . Different sequence variants will have different values of δ, and the maximal value δmax for a given amino acid composition is used to define
  , such that 0 ≤ κ ≤ 1. We calculate κ using two values for the blob size: g = 5 and g = 6, and the final κ for a given sequence variant is an average of the two values.
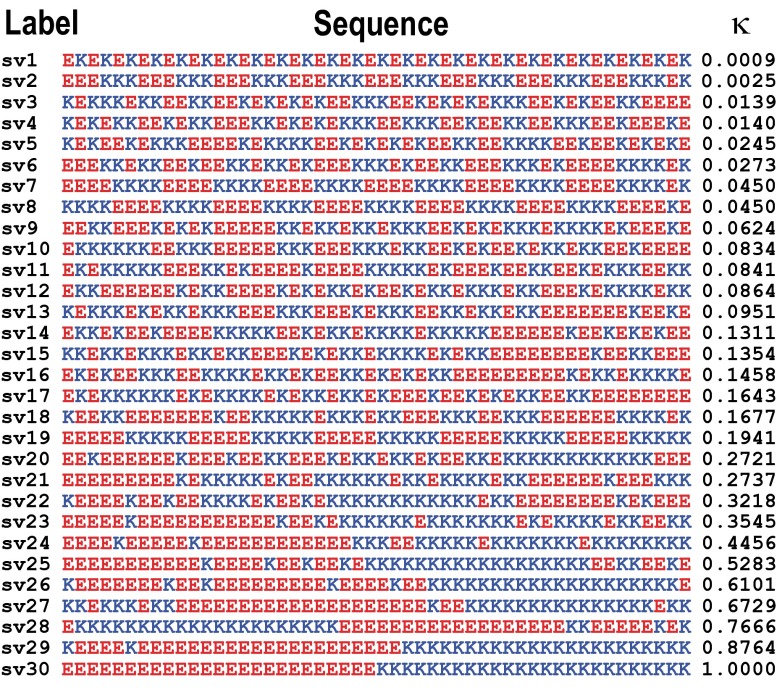
Fig. 1 shows 30 sequence variants of the synthetic strong polyampholyte system (Glu-Lys)25, for which n = 50, f+ = f– = 0.5, FCR = 1, and NCPR = σ = 0. The sequences in Fig. 1 span the range of κ-values, and SI Appendix, Table S1 summarizes predictions of their disorder tendencies. Low values of κ are realized for well-mixed sequence variants, and κ→1 if oppositely charged residues are segregated in the linear sequence. The number density of sequences n(κ) with specific values of κ will be high for low κ-values and decrease as κ increases (SI Appendix, Fig. S1).
Fig. 1.
Thirty sequence variants for the (Glu-Lys)25 system. Column 1 shows the label of each sequence variant. Column 2 shows the actual sequence, with Glu residues in red and Lys residues in blue. Column 3 shows the κ-values.
Conformational Properties for Sequence Variants of (Glu-Lys)25 Vary Considerably with κ Despite Having Identical NCPR Values.
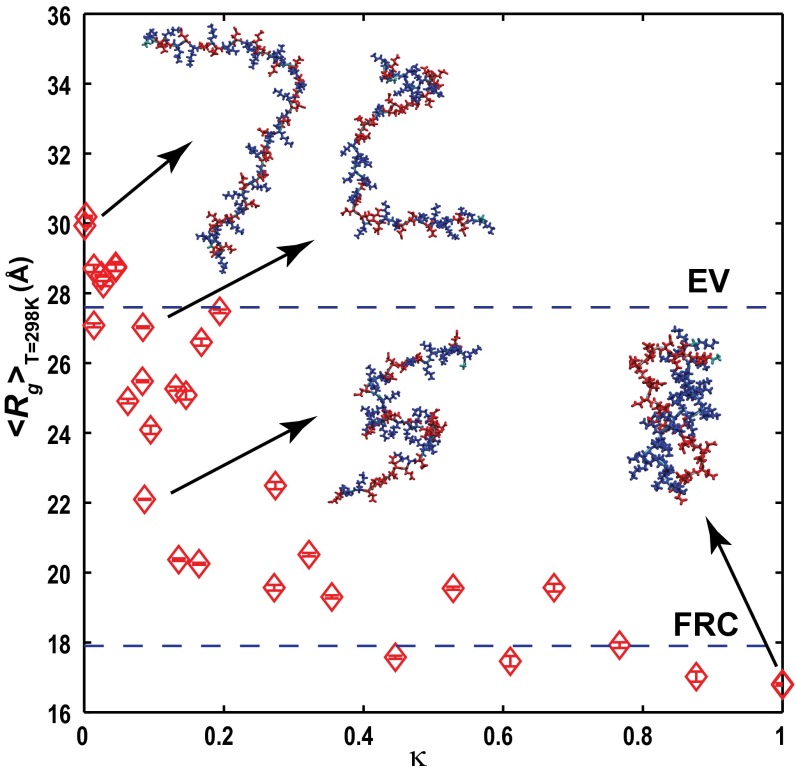
Fig. 2 plots the ensemble averaged radii of gyration 〈Rg〉 for sequence variants of (Glu-Lys)25 with different κ-values. In general, 〈Rg〉 decreases as κ increases. The linear Pearson correlation coefficient is r = −0.83 with a significance of P = 6.1 × 10⁻⁹. The 〈Rg〉 values exceed expectations for classical Flory random coils (∼18 Å), and the smallest value of 〈Rg〉, obtained for κ→1, is greater by a factor of 1.6 than the value of 11 Å expected for a compact globule (21). Additionally, for well-mixed sequences, the 〈Rg〉 values are slightly larger than values expected for self-avoiding random walks (∼28 Å).
Fig. 2.
Ensemble-averaged radii of gyration <Rg> for sequence variants of the (Glu-Lys)25 system. Insets show representative conformations for four sequence variants. Side chains of Glu are shown in red, and side chains of Lys are shown in blue. The two dashed lines intersect the ordinate at <Rg> values expected for all sequence variants of the (Glu-Lys)25 system modeled in the EV limit or as Flory random coils (FRCs).
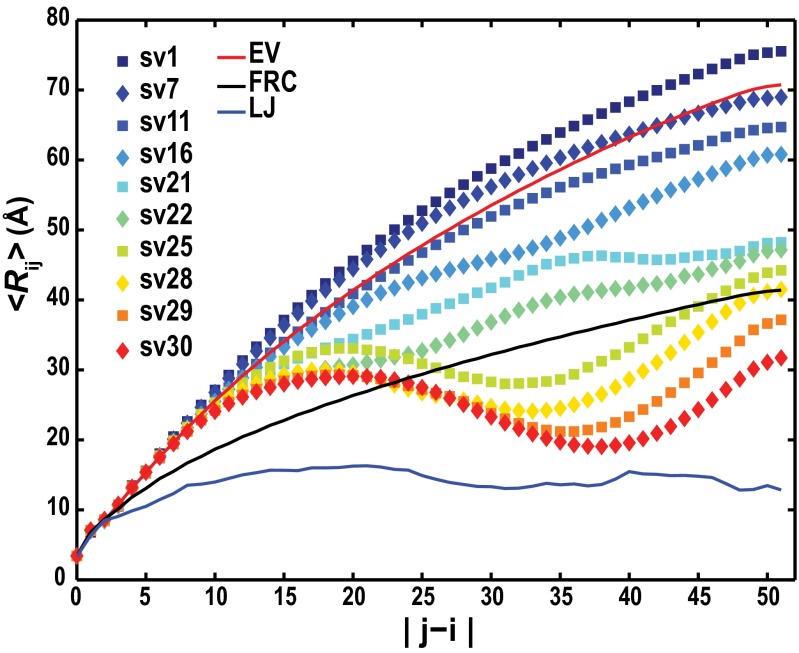
Fig. 3 plots 〈Rij〉, the ensemble-averaged interresidue distances against sequence separations |j − i| for a subset of the sequence variants listed in Fig. 1 (SI Appendix, Fig. S2). These 〈Rij〉 profiles quantify local concentrations of chain segments around each other and facilitate direct connections to measured pair distributions from small-angle X-ray scattering (22) and distance measurements from single molecule experiments (8). For κ < 0.05, 〈Rij〉 increases monotonically with increasing |j − i|. For higher values of κ, the 〈Rij〉 profiles show evidence of long-range electrostatic attractions between oppositely charged blocks. The conformational properties for sequences with low κ-values are, on average, similar to self-avoiding random walks, whereas sequences with high κ-values sample hairpin-like conformations. The effects of changes to solution conditions viz., salt concentration and temperature, are discussed in SI Appendix, Figs. S3–S5.
Fig. 3.
<Rij> profiles for sequence variants of the (Glu-Lys)25 system. The red curve denotes the profile expected for (Glu-Lys)25 polymers in the EV limit. The black curve is expected for an FRC, and the solid blue curve is obtained when (Glu-Lys)25 polymers form maximally compact globules. For compact globules, <Rij> plateaus to a value that is prescribed by their densities.
SI Appendix, Fig. S6 plots the asphericity (δ*) of each sequence variant against κ. For perfect spheres, δ* ∼ 0 and δ* ∼ 1 for rods (23). As κ increases, the asphericity values decrease from ∼0.6 to ∼0.2. This decrease in asphericity is consistent with a transition from elongated prolate ellipsoids to semicompact hairpins as illustrated in SI Appendix, Fig. S7, which shows representative conformations for different sequence variants of (Glu-Lys)25.
Phenomenological Explanation for the κ-Dependence of Conformational Properties.
In our atomistic simulations, the potential energy Uc associated with a specific conformation c is a sum of terms (i.e., Uc = UEV + UDisp + Utor + WSolv + Wel). Here, Utor denotes torsional potentials; UEV + UDisp models van der Waals interactions using the Lennard–Jones model, where UEV and UDisp refer to short-range repulsive and attractive dispersion terms, respectively. WSolv quantifies the conformation-specific free energy of solvation using the ABSINTH model; Wel models the effects of changes to the degrees of solvation that lead to conformation-specific descreening of intrachain electrostatic interactions. This term captures the effects of solvent-mediated electrostatic interactions between all charged groups, including charged side chains, partial charges that lead to backbone and side chain hydrogen bonding, and electrostatic interactions involving mobile ions in solution.
If all terms excepting UEV are zeroed out, then self-avoiding random walk distributions result, because the polypeptide samples conformations from the excluded volume (EV) limit. When the ensemble-averaged effects of intrachain electrostatic attractions and repulsions are counterbalanced, the underlying EV limit behavior is unmasked, which is the case for low κ-variants of (Glu-Lys)25 (Fig. 3). For short sequence separations (|j − i| < 2g), there are not enough intrachain electrostatic interactions to perturb chain statistics away from the EV limit. The 〈Rij〉 profiles for short separations should, therefore, resemble the profiles of unperturbed self-avoiding random walks. For sequences with higher κ-values, there should be a range of intermediate sequence separations (2g ≤ |j − i| ≤ lc), where oppositely charged blocks act as counterion clouds for each other, leading to electrostatic attractions induced by conformational fluctuations. Here, g is the blob length, and lc is the length scale over which deviations from the EV limit occur. The resultant semicompact hairpin-like or partial hairpin-like conformations will cause the 〈Rij〉 profiles to deviate from the profiles of chains in the EV limit. The degree of this deviation will depend on κ. Finally, for sequence separations greater than lc, the strength of the ensemble-averaged electrostatic attractions is ∼kT, and the EV limit behavior is recovered.
Development of a Scaling Theory for 〈Rij〉.
Based on the preceding discussion, we propose that the variation of conformational properties for different κ-variants of (Glu-Lys)25 can be modeled using a scaling theory akin to the theory in the work by Yamakov et al. (24). We use the EV limit distribution as the reference state as justified for (Glu-Lys)25 in SI Appendix, Fig. S8. We write 〈Rij〉 for all sequence separations of a given sequence as  . Here,
  is the nonuniversal prefactor that describes the scaling of 〈Rij〉 for (Glu-Lys)25 polymers as a function of |j − i| in the EV limit. The exponent ν = 0.59 is universal and prescribes the correlation length for polymers in the EV limit (25). The scaling function f(|j − i|) describes deviations from the EV limit that result from unbalanced electrostatic interactions. The form for f(|j − i|) derived from analysis of the 〈Rij〉 profiles for (Glu-Lys)25 variants is
 |
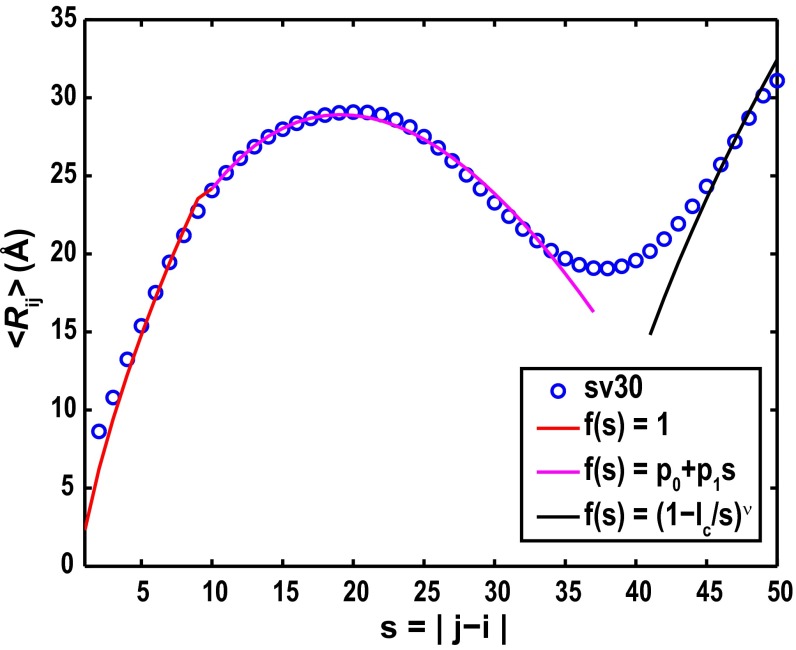
Results from numerical fits to the 〈Rij〉 profile for sv30 of (Glu-Lys)25 using the scaling theory are shown in Fig. 4, and results for all other sequence variants are shown in SI Appendix, Fig. S9. The coefficients p0 and p1 quantify the intercept and slope for the linear interpolation between the two regimes that show EV limit-like behavior. The values of p1 quantify the deviations from the EV limit profiles and are either small (p1 ∼ 0 for low κ) or negative as κ increases (SI Appendix, Fig. S10). The intercept p0 quantifies corrections to the excluded volume per residue that result from the effects of electrostatic interactions. The form for f(|j − i|) for |j − i| > lc implies that sequence separations between distal segments that restore EV limit behavior are renormalized to smaller effective separations, thus giving rise to continuous transitions between the regime where deviations are caused by intrachain electrostatic interactions and the EV limit.
Fig. 4.
Numerical fits to the <Rij> profile for sequence variant sv30 of the (Glu-Lys)25 system. The red, magenta, and black curves correspond to three distinct regimes viz.: |j − i| < 2g, 2g ≤ |j − i| ≤ lc, and |j − i| > lc, respectively.
On the Choice of Reference State for the Scaling Theory.
Our choice of the EV limit as the reference state for the scaling theory was based on the observation that counterbalancing of electrostatic repulsions and attractions unmasks EV limit behavior for well-mixed sequence variants of (Glu-Lys)25. In systems with smaller values of FCR, the counterbalancing in well-mixed sequence variants might unmask a different reference state, such as the Flory random coil. The precise form of the reference state that is unmasked by counterbalancing of electrostatic repulsions and attractions in well-mixed sequences will depend on the preferences encoded by the collective contributions of the nonelectrostatic terms of the potential function. Accordingly, we introduce an intrinsic solvation (IS) limit, whereby simulations to generate the reference state are performed using all terms of the potential function except Wel. Comparison of simulation results obtained using the full Hamiltonian with the results of the IS limit allows us to unmask the κ-specific contributions that arise because of competition between intrachain electrostatic attractions and repulsions. The free energies of solvation of charged side chains are highly favorable (∼−100 kcal/mol), and for high FCR, the IS limit ensembles are qualitatively similar to the ensembles of the EV limit, which are shown in SI Appendix, Fig. S11 for sequence variants of (Glu-Lys)25. However, as FCR decreases, there is good reason to expect significant deviation of 〈Rij〉 profiles calculated in the IS limit from those profiles of the EV limit (which will be shown below). Therefore, for sequences with FCR < 1, the development of a general form of the scaling relation for 〈Rij〉 will require that we use the appropriate IS limit profiles as reference models.
Inferring Deviations from Limiting Behavior from Sequence.
The presence of unbalanced intrachain electrostatic interactions can be assessed from sequence information if one computes the dimensionless Coulomb coupling parameter Γij (26). For a pair of blobs i and j,  ; ε = 78 is the dielectric constant of water at 298 K, ε0 is the permittivity of free space, ξ = 6 Å is the radius of a blob (SI Appendix, Fig. S12), R is the ideal gas constant, T is the temperature, and zi and zj denote the signed NCPR values of blobs i and j, respectively. The product zizj is positive or negative depending on whether the signed NCPR values for blobs i and j are of similar or opposite signs. For a given sequence variant, we calculate the product zizj for all pairs of blobs i and j that satisfy the constraint |j − i| > g = 5, and Γij is computed by averaging over zizj values for all pairs of blobs corresponding to a linear separation of |j − i|.
SI Appendix, Fig. S13 plots the cumulative sum of  against the linear separation between pairs of blobs. Of interest are the length scales for which
  is negative with a magnitude larger than RT. SI Appendix, Fig. S14 in the SI Appendix quantifies the correlation between p and min(
 ). This plot shows that the two parameters show significant positive correlation (Pearson r = 0.79). To a first approximation, if we neglect the small contributions of po and use the equation for the line of best fit that relates p1 to min(
 ), we can obtain qualitative assessments of the degree to which electrostatic attractions will lead to a deviation of the 〈Rij〉 profile from a reference state, such as the EV limit.
Results for Naturally Occurring Polyampholytic IDPs.
SI Appendix, Table S2 summarizes information regarding 10 IDP sequences extracted from a combination of the DisProt database (13) and published experimental data. For these sequences, 0.14 ≤ FCR ≤ 0.73, and 0.0 ≤ NCPR ≤ 0.25. SI Appendix, Fig. S15 shows the 〈Rij〉 profiles for these sequences in the IS limit. These reference state profiles are between the profiles for the EV limit and the Flory random coil, with the general trend of converging on the latter as FCR decreases. The critical exponent quantifying the correlation length switches from ν = 0.59 in the EV limit to ν = 0.5 for the Flory random coil. Profiles bearing similarity to the latter are realized for polymers in θ-solvents, where the statistical effects of intrachain and chain-solvent interactions are counterbalanced (27, 28).
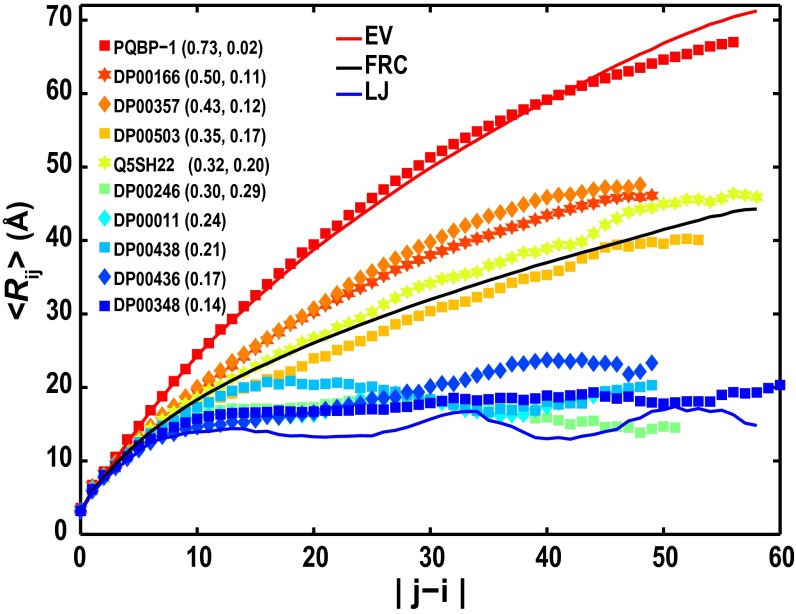
Fig. 5 shows 〈Rij〉 profiles from simulation results obtained using the full ABSINTH Hamiltonian for all 10 sequences. Comparisons of these profiles with their respective IS limit profiles are shown in SI Appendix, Fig. S16. The contributions of intrachain, solvent-mediated electrostatic interactions lead to either weak perturbations from the IS limit, which was seen for polyglutamine tract binding protein (PQBP-1), DP00166, DP00357, DP00503, and QSH22, or significant compaction vis-à-vis the IS limit, which was seen for the remaining five sequences. The extent of the perturbation with respect to the IS limit is clearly governed by FCR. Hofmann et al. (28) have recently shown that the degree of deviation of unfolded state dimensions from an effective θ-state as measured under folding conditions is also dependent on FCR.
Fig. 5.
<Rij> profiles for 10 naturally occurring IDPs. The legend shows the DisProt or other identifier for each sequence. The solid curves are reference profiles that are similar to those profiles described in Fig. 3. The legend shows the sequence identifiers and the combination of FCR and κ-values in parentheses. For globule formers, the values of κ have no significance, and for these sequences, the legend shows only their FCR values.
Sequences with FCR < 0.3 and NCPR values < 0.25 are weak polyampholytes, and compaction results from decreased FCR with charged residues on the surfaces of globules (SI Appendix, Fig. S17). SI Appendix, Fig. S18 shows the temperature dependence of 〈Rg2〉 values for the 10 naturally occurring polyampholytic IDPs from SI Appendix, Table S2. These results show that the conformational properties for polyampholytes with lower FCR values show more pronounced temperature dependencies compared with sequence variants of (Glu-Lys)25.
Conformational Properties of Polyampholytic IDPs Can Be Modulated Through de Novo Sequence Design.
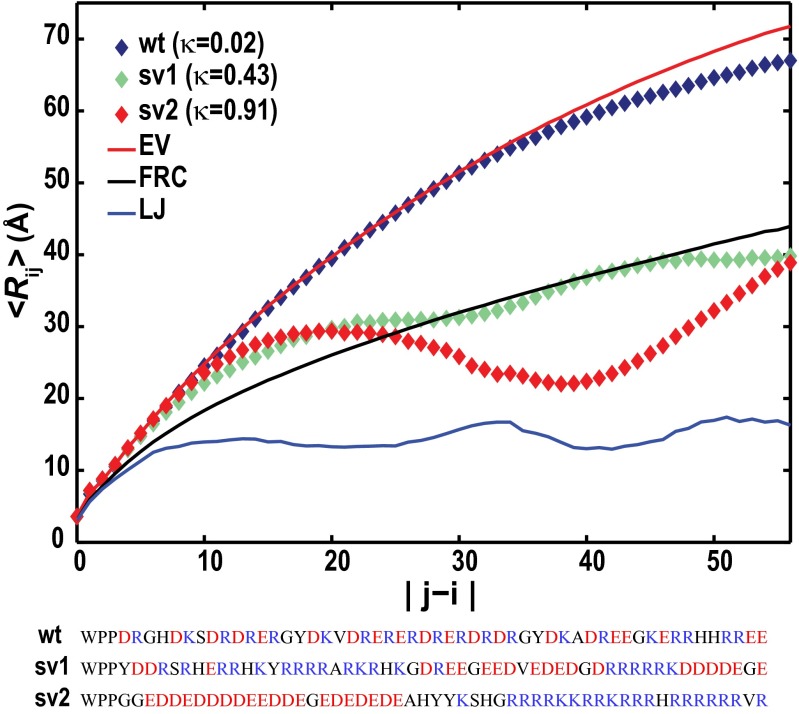
The N-terminal end of the PQBP-1 includes a WW domain that binds RNA polymerase II and is connected to the C-terminal U5 15 kDa binding region (29) by a polyampholytic stretch. Multiple lines of experimental evidence suggest that this polyampholytic stretch is a flexible tether that adopts expanded conformations (29, 30). Fig. 6 shows the 〈Rij〉 profile for the 55-residue construct WPP-(PQBP-1)132–183, for which FCR = 0.73, NCPR = 0, and κ = 0.024. We reasoned that high κ-variants of this sequence should have very different conformational properties. We tested this hypothesis by comparing the conformational properties of the WT sequence with the properties of two variants with higher κ-values (Fig. 6). The results show considerable differences between the 〈Rij〉 profile of the WT sequence and its higher κ-variants, such that changes of ∼28 Å in the end-to-end distance can be achieved by sequence permutations. For a fixed amino acid composition, systems with the designation of strong polyampholytes are likely to have higher designability than weak polyampholytes, because significant modulation of conformational properties is achievable by varying κ.
Fig. 6.
<Rij> profiles for the WT linker from PQBP-1 and two designed sequence variants. The sequences of the WT stretch and sequence permutants are shown. The solid red, black, and blue curves correspond to <Rij> profiles for WPP-(PQBP-1)132–183:wt simulated in the EV limit, FRC, and compact Lennard–Jones (LJ) globules, respectively.
Discussion
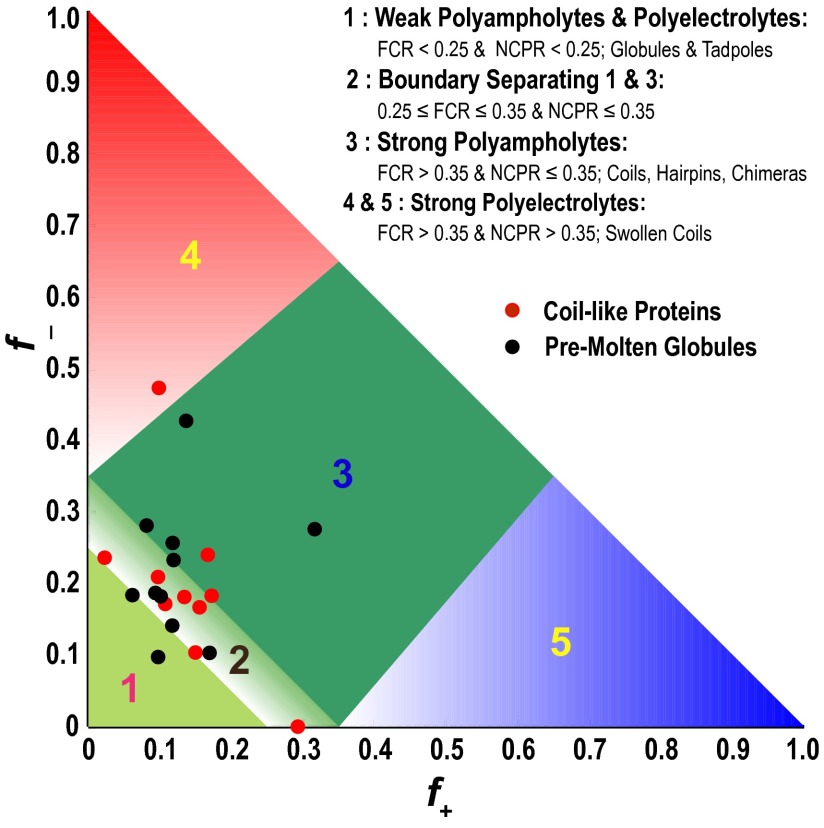
Mao et al. (7) proposed a predictive diagram of states, whereby the ensemble type (namely globule or coil) can be inferred based on the NCPR value for a given sequence. We annotated this diagram of states using a subset of IDP sequences from the DisProt database (13). Approximately 95% of these sequences have amino acid compositions with NCPR < 0.25, which would imply that they form compact globules (SI Appendix, Fig. S19). However, this inference is questionable, because most of the sequences annotated as being globule formers are, in fact polyampholytes. If NCPR alone was a sufficient descriptor of conformational properties, then the results of Figs. 2, 3, and 5 would have been consistent with globule formation, irrespective of the κ- and FCR values, which is clearly not the case. We modified the original diagram of states to account for the findings from this work. In the modified diagram of states (Fig. 7), ∼70% of the IDPs that were classified as globules (SI Appendix, Fig. S19) are found to have compositions that place them in either the strong polyampholytic region or the boundary between globules and strong polyampholytes. Sequences within the boundary are distinct from globule formers and strong polyampholytes. Inferring their sequence–ensemble relationships requires additional considerations, such as the compositions of polar residues, the proline contents, and the presence of sequence stretches with preferences for specific secondary structures.
Fig. 7.
Diagram of states for IDPs. We focus on sequences that fall below the parameterized line (NCPR = 2.785H − 1.151), developed by Uversky et al. (43) to separate IDPs from sequences that fold autonomously. Here, H refers to the hydropathy score. Region 1 corresponds to either weak polyampholytes or weak polyelectrolytes that form globule or tadpole-like conformations (SI Appendix, Fig. S17). Region 3 corresponds to strong polyampholytes that form distinctly nonglobular conformations that are coil-like, hairpin-like, or admixtures. A boundary region labeled 2 separates regions 1 and 3, and the conformations within this region are likely to represent a continuum of possibilities between the types of conformations adopted by sequences in regions 1 and 3. Sequences with compositions corresponding to regions 4 and 5 are strong polyelectrolytes with FCR > 0.35 and NCPR > 0.3. These sequences are expected to sample coil-like conformations that largely resemble EV limit ensembles. The legend summarizes statistics for different regions based on sequences drawn from the DisProt database. The figure includes annotation by properties of sequences that have been designated as being “coils” or “pre-molten-globules” by Uversky (3) based on measurements of hydrodynamic radii. These sequences (listed in SI Appendix, Tables S3 and S4) are expected to be expanded vis-à-vis folded proteins, and our annotation shows that, indeed, all but one of the sequences is outside the globule-forming region.
Assessing Polyampholyte Theories.
Mean field theories for polyampholytes describe the dependence of Rg and internal structure on values of FCR, NCPR, and N (14, 19, 31, 32). These theories predict that neutral polyampholytes will form globules with liquid-like organization of opposite charges within the interior of globules that resembles globules of 1:1 electrolytes. Alternative predictions suggest more EV limit-like behavior (33). Our results contradict the predictions of typical mean field theories because of two weaknesses in the theories. First, they apply to an ensemble-averaged sequence, which is obtained by averaging over all possible sequence variants for a given FCR and NCPR (32). Therefore, they cannot work for individual sequence variants (34, 35). Second, all theories ignore the effects of highly favorable solvation free energies of charged groups, which clearly require fundamentally different reference states, such as the IS limit.
We have presented a preliminary scaling theory to account for the effects of κ-specific correlations in sequence variants of (Glu-Lys)25. The theory is based on the observation that counterbalancing of electrostatic attractions and repulsions in well-mixed sequence variants of (Glu-Lys)25 unmasks conformational preferences obtained in the EV limit. For well-mixed variants of weaker polyampholytes (0.3 ≤ FCR < 1), counterbalancing of electrostatic attractions and repulsions will unmask the IS limit as the relevant reference state. Consequently, for polyampholytes with 0.3 ≤ FCR < 1 that show κ-specific conformational properties, an extension of the scaling theory might simply require switching the reference critical exponent from ν = 0.59 to ν = 0.5. However, for globule-forming weak polyampholytes (FCR < 0.3), the collapse becomes weakly dependent or even independent of κ. Inasmuch as the IS limit resembles the Flory random coil or effective θ-state, a theoretical framework to describe the collapse of weak polyampholytes will likely resemble the framework of theories for coil-to-globule transitions (36). Large-scale simulations performed using different combinations of FCR, NCPR, and κ and integration of these results should yield a unifying theoretical framework for sequences that span the spectrum of FCR values. This task seems practicable and will be pursued in future work.
Broader Implications.
SI Appendix, Fig. S20 shows the joint distribution of FCR and κ-values for strong polyampholytic IDPs extracted from the DisProt database. The distribution is peaked around κ ∼ 0.2, implying that naturally occurring sequences are reasonably well-mixed and likely to have conformational properties that are between the EV limit and Flory random coil models. If an IDP is a strong polyampholyte, then posttranslational modification, such as Ser/Thr phosphorylation, can increase FCR and NCPR and lead to coil-like properties (37). If phosphorylation converts an IDP from a polyelectrolyte to a strong polyampholyte (38), then the conformational properties will be governed by the combination of FCR and κ for the modified sequence. The sequences of IDPs can also be altered by alternative splicing (39), and for polyampholytic IDPs, the effects of splicing will give rise to altered sequence–ensemble relationships on the protein level. Therefore, posttranscriptional and posttranslational regulations seem to afford tuning of sequence–ensemble relationships of IDPs (40)—a feature that is enabled by the predominantly polyampholytic nature of these proteins.
Materials and Methods
Simulations were performed using the CAMPARI package using the ABSINTH implicit solvation model and force-field paradigm (17) (http://campari.sourceforge.net/). Parameters were taken from the abs3.2_opls.prm file. Conformational space for each IDP was sampled using Markov Chain Metropolis Monte Carlo moves that were combined with thermal replica exchange (41) to enhance the quality of sampling. Neutralizing ions and excess Na+ and Cl− ions were modeled explicitly to mimic a concentration of 15 or 125 mM in spherical droplets of 75 Å radius. Details of the simulation setup, including move sets used, temperature schedules, choices for droplet size, treatment of long-range interactions, and analysis methods, are provided in SI Appendix, Section 2. We report results from simulations for 42 sequence variants; the shortest was 46 residues long, and the longest has 59 residues. This level of throughput is essential to unmask how FCR and κ determine sequence–ensemble relationships. We have documented the intractability of using explicit solvent models for large-scale simulations of highly charged systems (7), because we require robust statistics regarding excursions into and out of expanded/compact conformations without the confounding effects of finite-sized artifacts (42) and artificial confinement imposed by the use of small periodic systems.
Supplementary Material
Acknowledgments
We thank Scott Crick, Alex Holehouse, Nicholas Lyle, Albert Mao, and Anuradha Mittal for helpful discussions. This work was supported by National Science Foundation Grant MCB-1121867 and the Center for High Performance Computing at Washington University in St. Louis.
Footnotes
The authors declare no conflict of interest.
This article is a PNAS Direct Submission.
This article contains supporting information online at www.pnas.org/lookup/suppl/doi:10.1073/pnas.1304749110/-/DCSupplemental.
References
- 1.Dyson HJ, Wright PE. Intrinsically unstructured proteins and their functions. Nat Rev Mol Cell Biol. 2005;6(3):197–208. doi: 10.1038/nrm1589. [DOI] [PubMed] [Google Scholar]
- 2.Tantos A, Han KH, Tompa P. Intrinsic disorder in cell signaling and gene transcription. Mol Cell Endocrinol. 2012;348(2):457–465. doi: 10.1016/j.mce.2011.07.015. [DOI] [PubMed] [Google Scholar]
- 3.Uversky VN. What does it mean to be natively unfolded? Eur J Biochem. 2002;269(1):2–12. doi: 10.1046/j.0014-2956.2001.02649.x. [DOI] [PubMed] [Google Scholar]
- 4.Bright JN, Woolf TB, Hoh JH. Predicting properties of intrinsically unstructured proteins. Prog Biophys Mol Biol. 2001;76(3):131–173. doi: 10.1016/s0079-6107(01)00012-8. [DOI] [PubMed] [Google Scholar]
- 5.Mukhopadhyay S, Krishnan R, Lemke EA, Lindquist S, Deniz AA. A natively unfolded yeast prion monomer adopts an ensemble of collapsed and rapidly fluctuating structures. Proc Natl Acad Sci USA. 2007;104(8):2649–2654. doi: 10.1073/pnas.0611503104. [DOI] [PMC free article] [PubMed] [Google Scholar]
- 6.Wells M, et al. Structure of tumor suppressor p53 and its intrinsically disordered N-terminal transactivation domain. Proc Natl Acad Sci USA. 2008;105(15):5762–5767. doi: 10.1073/pnas.0801353105. [DOI] [PMC free article] [PubMed] [Google Scholar]
- 7.Mao AH, Crick SL, Vitalis A, Chicoine CL, Pappu RV. Net charge per residue modulates conformational ensembles of intrinsically disordered proteins. Proc Natl Acad Sci USA. 2010;107(18):8183–8188. doi: 10.1073/pnas.0911107107. [DOI] [PMC free article] [PubMed] [Google Scholar]
- 8.Müller-Späth S, et al. From the Cover: Charge interactions can dominate the dimensions of intrinsically disordered proteins. Proc Natl Acad Sci USA. 2010;107(33):14609–14614. doi: 10.1073/pnas.1001743107. [DOI] [PMC free article] [PubMed] [Google Scholar]
- 9.Marsh JA, Forman-Kay JD. Sequence determinants of compaction in intrinsically disordered proteins. Biophys J. 2010;98(10):2383–2390. doi: 10.1016/j.bpj.2010.02.006. [DOI] [PMC free article] [PubMed] [Google Scholar]
- 10.Potoyan DA, Papoian GA. Energy landscape analyses of disordered histone tails reveal special organization of their conformational dynamics. J Am Chem Soc. 2011;133(19):7405–7415. doi: 10.1021/ja1111964. [DOI] [PubMed] [Google Scholar]
- 11.Zhang WH, Ganguly D, Chen JH. Residual structures, conformational fluctuations, and electrostatic interactions in the synergistic folding of two intrinsically disordered proteins. PLoS Comput Biol. 2012;8(1):e1002353. doi: 10.1371/journal.pcbi.1002353. [DOI] [PMC free article] [PubMed] [Google Scholar]
- 12.Mao AH, Lyle N, Pappu RV. Describing sequence-ensemble relationships for intrinsically disordered proteins. Biochem J. 2013;449(2):307–318. doi: 10.1042/BJ20121346. [DOI] [PMC free article] [PubMed] [Google Scholar]
- 13.Sickmeier M, et al. DisProt: The database of disordered proteins. Nucleic Acids Res. 2007;35(Database issue):D786–D793. doi: 10.1093/nar/gkl893. [DOI] [PMC free article] [PubMed] [Google Scholar]
- 14.Higgs PG, Joanny JF. Theory of polyampholyte solutions. J Chem Phys. 1991;94(2):1543–1554. [Google Scholar]
- 15.Fu XD. The superfamily of arginine/serine-rich splicing factors. RNA. 1995;1(7):663–680. [PMC free article] [PubMed] [Google Scholar]
- 16.Forbes JG, et al. Titin PEVK segment: Charge-driven elasticity of the open and flexible polyampholyte. J Muscle Res Cell Motil. 2005;26(6–8):291–301. doi: 10.1007/s10974-005-9035-4. [DOI] [PMC free article] [PubMed] [Google Scholar]
- 17.Vitalis A, Pappu RV. ABSINTH: A new continuum solvation model for simulations of polypeptides in aqueous solutions. J Comput Chem. 2009;30(5):673–699. doi: 10.1002/jcc.21005. [DOI] [PMC free article] [PubMed] [Google Scholar]
- 18.Das RK, Crick SL, Pappu RV. N-terminal segments modulate the α-helical propensities of the intrinsically disordered basic regions of bZIP proteins. J Mol Biol. 2012;416(2):287–299. doi: 10.1016/j.jmb.2011.12.043. [DOI] [PubMed] [Google Scholar]
- 19.Dobrynin AV, Rubinstein M. Flory theory of a polyampholyte chain. Journale de Physique II France. 1995;5(5):677–695. [Google Scholar]
- 20.Pappu RV, Wang X, Vitalis A, Crick SL. A polymer physics perspective on driving forces and mechanisms for protein aggregation. Arch Biochem Biophys. 2008;469(1):132–141. doi: 10.1016/j.abb.2007.08.033. [DOI] [PMC free article] [PubMed] [Google Scholar]
- 21.Dima RI, Thirumalai D. Asymmetry in the shapes of folded and denatured states of proteins. J Phys Chem B. 2004;108(21):6564–6570. [Google Scholar]
- 22.Bernadó P, Svergun DI. Analysis of intrinsically disordered proteins by small-angle X-ray scattering. Methods Mol Biol. 2012;896:107–122. doi: 10.1007/978-1-4614-3704-8_7. [DOI] [PubMed] [Google Scholar]
- 23.Steinhauser MO. A molecular dynamics study on universal properties of polymer chains in different solvent qualities. Part I. A review of linear chain properties. J Chem Phys. 2005;122(9):094901. doi: 10.1063/1.1846651. [DOI] [PubMed] [Google Scholar]
- 24.Yamakov V, et al. Conformations of random polyampholytes. Phys Rev Lett. 2000;85(20):4305–4308. doi: 10.1103/PhysRevLett.85.4305. [DOI] [PubMed] [Google Scholar]
- 25.Schäfer L. Excluded Volume Effects in Polymer Solutions as Explained by the Renormalization Group. Berlin: Springer; 1999. [Google Scholar]
- 26.Tanaka M, Tanaka T. Clumps of randomly charged polymers: Molecular dynamics simulation of condensation, crystallization, and swelling. Phys Rev E Stat Phys Plasmas Fluids Relat Interdiscip Topics. 2000;62(3 Pt B):3803–3816. doi: 10.1103/physreve.62.3803. [DOI] [PubMed] [Google Scholar]
- 27.Nettels D, et al. Single-molecule spectroscopy of the temperature-induced collapse of unfolded proteins. Proc Natl Acad Sci USA. 2009;106(49):20740–20745. doi: 10.1073/pnas.0900622106. [DOI] [PMC free article] [PubMed] [Google Scholar]
- 28.Hofmann H, et al. Polymer scaling laws of unfolded and intrinsically disordered proteins quantified with single-molecule spectroscopy. Proc Natl Acad Sci USA. 2012;109(40):16155–16160. doi: 10.1073/pnas.1207719109. [DOI] [PMC free article] [PubMed] [Google Scholar]
- 29.Takahashi M, et al. Polyglutamine tract-binding protein-1 binds to U5-15kD via a continuous 23-residue segment of the C-terminal domain. Biochim Biophys Acta. 2010;1804(7):1500–1507. doi: 10.1016/j.bbapap.2010.03.007. [DOI] [PubMed] [Google Scholar]
- 30.Rees M, et al. Solution model of the intrinsically disordered polyglutamine tract-binding protein-1. Biophys J. 2012;102(7):1608–1616. doi: 10.1016/j.bpj.2012.02.047. [DOI] [PMC free article] [PubMed] [Google Scholar]
- 31.Edwards SF, King PR, Pincus P. Phase-changes in polyampholytes. Ferroelectrics. 1980;30(1–4):3–6. [Google Scholar]
- 32.Dobrynin AV, Colby RH, Rubinstein M. Polyampholytes. J Polym Sci B. 2004;42(19):3513–3538. [Google Scholar]
- 33.Kantor Y, Kardar M. Randomly charged polymers: An exact enumeration study. Phys Rev E Stat Phys Plasmas Fluids Relat Interdiscip Topics. 1995;52(1):835–846. doi: 10.1103/physreve.52.835. [DOI] [PubMed] [Google Scholar]
- 34.Gutin AM, Shakhnovich EI. Effect of a net charge on the conformation of polyampholytes. Phys Rev E Stat Phys Plasmas Fluids Relat Interdiscip Topics. 1994;50(5):R3322–R3325. doi: 10.1103/physreve.50.r3322. [DOI] [PubMed] [Google Scholar]
- 35.Srivastava D, Muthukumar M. Sequence dependence of conformations of polyampholytes. Macromolecules. 1996;29(6):2324–2326. [Google Scholar]
- 36.Sanchez IC. Phase transition behavior of the isolated polymer chain. Macromolecules. 1979;12(5):980–988. [Google Scholar]
- 37.Borg M, et al. Polyelectrostatic interactions of disordered ligands suggest a physical basis for ultrasensitivity. Proc Natl Acad Sci USA. 2007;104(23):9650–9655. doi: 10.1073/pnas.0702580104. [DOI] [PMC free article] [PubMed] [Google Scholar]
- 38.Kumar S, Hoh JH. Modulation of repulsive forces between neurofilaments by sidearm phosphorylation. Biochem Biophys Res Commun. 2004;324(2):489–496. doi: 10.1016/j.bbrc.2004.09.076. [DOI] [PubMed] [Google Scholar]
- 39.Buljan M, et al. Tissue-specific splicing of disordered segments that embed binding motifs rewires protein interaction networks. Mol Cell. 2012;46(6):871–883. doi: 10.1016/j.molcel.2012.05.039. [DOI] [PMC free article] [PubMed] [Google Scholar]
- 40.Vuzman D, Levy Y. Intrinsically disordered regions as affinity tuners in protein-DNA interactions. Mol Biosyst. 2012;8(1):47–57. doi: 10.1039/c1mb05273j. [DOI] [PubMed] [Google Scholar]
- 41.Mitsutake A, Sugita Y, Okamoto Y. Replica-exchange multicanonical and multicanonical replica-exchange Monte Carlo simulations of peptides. II. Application to a more complex system. J Chem Phys. 2003;118(14):6676–6688. [Google Scholar]
- 42.Chen AA, Marucho M, Baker NA, Pappu RV. Simulations of RNA interactions with monovalent ions. Methods Enzymol. 2009;469:411–432. doi: 10.1016/S0076-6879(09)69020-0. [DOI] [PubMed] [Google Scholar]
- 43.Uversky VN, Gillespie JR, Fink AL. Why are “natively unfolded” proteins unstructured under physiologic conditions? Proteins. 2000;41(3):415–427. doi: 10.1002/1097-0134(20001115)41:3<415::aid-prot130>3.0.co;2-7. [DOI] [PubMed] [Google Scholar]
Associated Data
This section collects any data citations, data availability statements, or supplementary materials included in this article.


