Abstract
Myotonic dystrophy type 1 (DM1) is caused by expansion of CTG repeats in the 3′ UTR of the DMPK gene. Expression of CUG expansion (CUGexp) RNA produces a toxic gain of function by disrupting the functions of RNA splicing factors, such as MBNL1 and CELF1, leading to splicing changes associated with clinical abnormalities. Progressive skeletal muscle weakness and wasting is one of the most prominent clinical features in DM1; however, the underlying mechanisms remain unclear. Here we report that the embryonic M2 isoform of pyruvate kinase (PKM2), a key enzyme contributing to the Warburg effect in cancer, is significantly induced in DM1 tissue and mouse models owing to aberrant splicing. Expression of PKM2 in DM1 skeletal muscle is restricted to the type 1 fibers, which are particularly susceptible to wasting in DM1. Using antisense oligonucleotides to shift PKM splicing toward increased PKM2 expression, we observed increased glucose consumption with reduced oxidative metabolism in cell culture and increased respiratory exchange ratio in mice, suggesting defects in energy metabolism conferred by PKM2 expression. We propose that PKM2 expression induces changes in type 1 fibers associated with muscle atrophy and muscle weakness in DM1.
Keywords: muscular dystrophy, redirected splicing, striated muscle development, alternative splicing
Myotonic dystrophy (DM) is the most common adult-onset form of muscular dystrophy (1, 2). It is caused by expanded CTG repeats in the 3′ UTR of the DMPK gene (type 1; DM1) or expanded CCTG repeats in the first intron of the CNBP gene (type 2; DM2) (3–5). The RNAs transcribed from the expanded CTG or CCTG alleles produce a dominant toxic gain of function (2, 6). The toxicity of CUG- and CCUG-expanded RNAs (CUGexp and CCUGexp RNA) involves two main pathogenic mechanisms. First, CUGexp or CCUGexp RNAs bind and sequester muscleblind-like (MBNL) proteins within ribonuclear foci, resulting in MBNL loss of function (7, 8). Second, CUGexp RNA activates protein kinase C, which phosphorylates and stabilizes CELF1, resulting in its elevation and gain of function (9). MBNL and CELF1 proteins regulate alternative splicing during development, and disruption of their functions leads to aberrant splicing transitions implicated in such manifestations of DM as myotonia and insulin resistance (2).
Progressive muscle weakness and wasting are among the most prominent clinical features of DM1 (1). In contrast to other forms of muscular dystrophy, such as Duchenne muscular dystrophy, the muscle weakness and wasting in DM1 is not accompanied by overt regeneration, fibrosis and necrosis. Instead, the most prominent histological abnormalities in DM1 are centralized nuclei and slow myofiber (type 1 fiber) atrophy (1). Early studies suggested that reduced protein synthesis and an imbalance of anabolism and catabolism may be responsible for the muscle wasting in DM1 (10, 11). Recent studies have shown that abnormal T-tubule biogenesis and calcium signaling, along with increased glycogen synthase kinase 3β (GSK3β) activity, are associated with muscle weakness (12–14). The molecular mechanisms underlying muscle weakness and wasting remain elusive, however.
Skeletal muscle requires effective glucose metabolism for its high-energy demand. We previously showed that missplicing of the insulin receptor is associated with reduced glucose uptake and insulin resistance in DM1 (15). We assessed whether downstream metabolism might be dysregulated in DM1. By screening enzymes involved in the glycolysis pathway, we found that up-regulation of a critical glycolytic enzyme, pyruvate kinase M2 (PKM2), is correlated with altered glucose metabolism and type 1 fiber atrophy in DM1.
Pyruvate kinase (PK) catalyzes the final rate-limiting step of glycolysis by converting phosphoenolpyruvate and ADP to pyruvate and ATP. Alternative splicing of two pyruvate kinase genes, PKLR and PKM, generates four PK isoenzymes in mammals. Alternative promoter use of the PKLR gene results in the tissue-specific expression of pyruvate kinase type L (PKL) in liver and pyruvate kinase type R (PKR) in red blood cells (16, 17). In contrast, mutually exclusive splicing of exon 9 or 10 in the PKM pre-mRNA produces PKM1 or PKM2 expressed at different developmental stages (17). PKM1 and PKM2 differ by only 22 residues, yet demonstrate distinct biochemical properties; PKM1 is constitutively active, whereas PKM2 is allosterically regulated (18, 19). Previous studies have demonstrated that PKM2 is essential for aerobic glycolysis and provides a selective proliferative advantage in cancer cells (18, 19). The role for altered expression of PKM2 in noncancer cells has not been investigated to date.
Here we report a substantial increase of PKM2 in DM1 skeletal muscle and heart tissue. PKM2 is selectively up-regulated in type 1 muscle fibers, which are susceptible to atrophy in DM1. Induced expression of CUGexp RNA in mouse heart up-regulates Pkm2 expression by inducing the embryonic splicing pattern. Using antisense morpholino oligonucleotides (MOs) to shift Pkm splicing toward Pkm2 expression in cultured myotubes, we observed a significantly reduced oxygen consumption rate accompanied by increased glucose consumption, indicating that Pkm expression suppresses glucose oxidative metabolism. Induced Pkm2 expression in skeletal muscle by systemic delivery of MOs increased the respiratory exchange ratio (RER) and energy expenditure in mice. These data support an important role for PKM splicing in regulating glucose metabolism in muscle. We propose that PKM2 expression in DM1 caused by aberrant splicing may disrupt glucose homeostasis, contributing to type 1 myofiber atrophy.
Results
Pkm Undergoes a Splicing Switch During Skeletal Muscle and Heart Development.
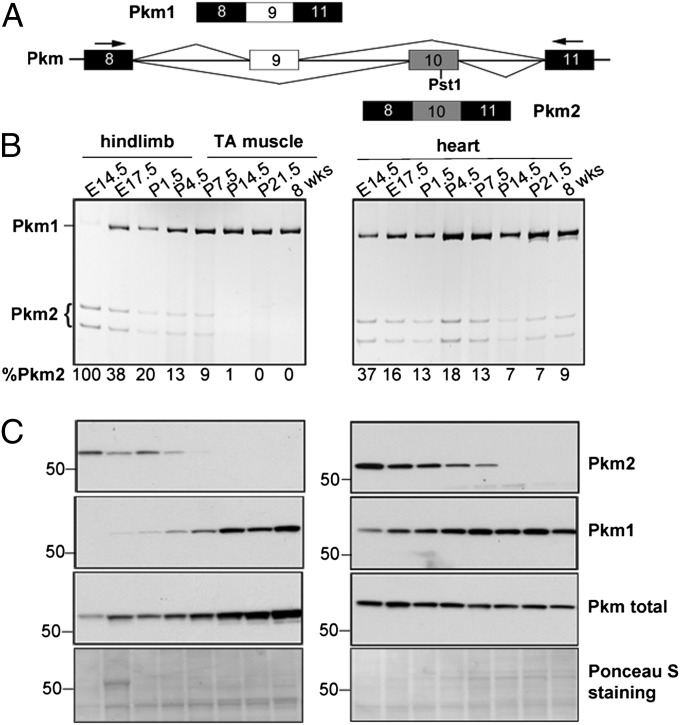
Pkm2 is known to be replaced by Pkm1 during skeletal muscle development through mutually exclusive alternative splicing of exons 9 and 10 (Fig. 1A), but the specific timing of the splicing switch has been unclear (16, 17). We used RT-PCR (Fig. 1B) and Western blot analysis (Fig. 1C) to examine the transition of Pkm isoforms during mouse skeletal muscle and heart development. RT-PCR was performed using primers in exons 8 and 11 (Fig. 1A), and the PCR products were cut with PstI to distinguish Pkm1 (uncut) from Pkm2 (cut). Western blot analysis was performed using isoform-specific antibodies.
Fig. 1.
Pkm alternative splicing during mouse skeletal muscle and heart development. (A) Diagram of the mouse Pkm genomic segment indicating mutually exclusive splicing of exons 9 and 10. Constitutive exons are in black; alternative exons are in white (exon 9) or gray (exon 10). Primers used to amplify the Pkm variable region and the PstI recognition site in exon 10 are indicated. (B) RT-PCR analysis of Pkm mRNA from the indicated developmental stages of mouse skeletal muscle (Left) and heart (Right). PCR products were digested with PstI. Splicing is quantified as percent of the Pkm2 isoform (%Pkm2). (C) Western blot analysis using antibodies recognizing Pkm2, Pkm1, or both (Pkm total) isoforms. Ponceau S-stained blots are shown as loading controls.
In both heart and skeletal muscle, Pkm2 expression was high at embryonic day (E) 14.5, but Pkm1 became predominant during late embryonic and early postnatal stages, accompanied by a concurrent decrease of Pkm2. Differences in Pkm1:Pkm2 ratios at the mRNA and protein levels between E14.5 and 8 wk could reflect greater sensitivity of the Pkm2 antibody or higher Pkm2 translational efficiency. Taken together, these results demonstrate that a nearly complete Pkm2-to-Pkm1 isoform switch occurs during late embryonic/early postnatal development in skeletal muscle and heart.
PKM2 Is Reexpressed in Adult DM1 Skeletal Muscle and Heart.
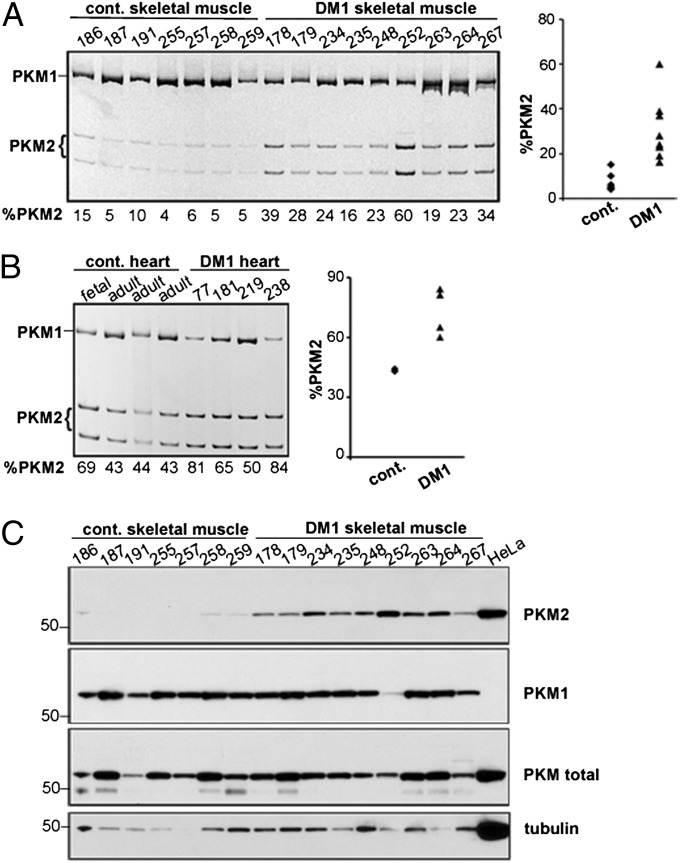
A molecular hallmark of DM1 is dysregulation of a subset of developmentally regulated alternative splicing events, resulting in expression of the fetal isoforms in adult tissue (12, 13, 15, 20). RT-PCR analysis of PKM mRNAs showed increased expression of PKM2 mRNAs from 7% in unaffected muscle (n = 7) to 30% in DM1 skeletal muscle (n = 9) (Fig. 2A). PKM2 was also increased in DM1 heart tissue (72%; n = 4) compared with unaffected controls (43%; n = 3) (Fig. 2B). Western blot analysis confirmed a robust increase of PKM2 protein in DM1 skeletal muscle tissue (Fig. 2C). The elevation of PKM2 prompted us to determine whether additional changes in the glycolysis pathway might be affected in DM1. Western blot analysis of six additional enzymes in the glycolysis pathway did not show any significant change in protein levels (Fig. S1). Taken together, these data indicate that PKM2 is increased, whereas levels of other glycolytic enzymes remain largely unaffected in DM1.
Fig. 2.
Increased expression of PKM2 in DM1 heart and skeletal muscle. (A and B) RT-PCR analysis of PKM in control and DM1 skeletal muscle (A) and heart (B), with quantification in scatter plots. The fetal heart shows increased PKM2 compared with the adult heart, as in mice. (C) Western blot analysis of PKM isoforms and tubulin in the same skeletal muscle samples used in A and in HeLa cell extracts.
Up-Regulation of PKM2 in DM1 Skeletal Muscle Occurs in Type 1 Myofibers.
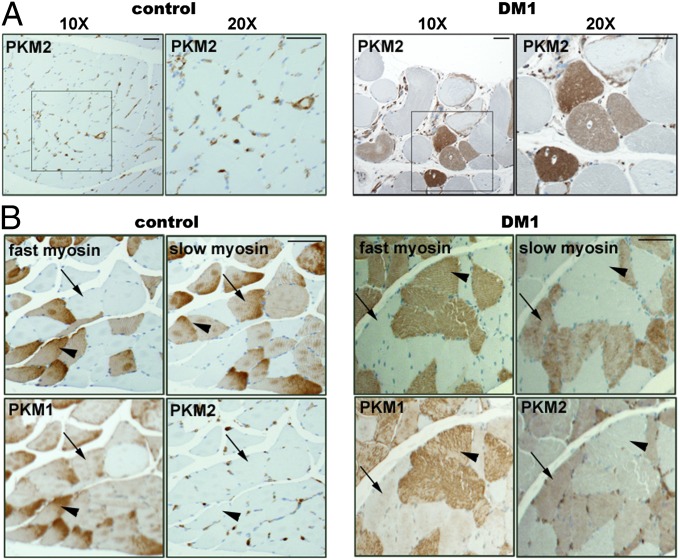
To verify PKM2 up-regulation and determine the distribution of PKM2 in DM1 skeletal muscle, we performed immunohistochemical staining of PKM2 on normal and DM1 tissue sections. In normal samples, PKM2 is expressed in the interstitial cells and blood vessels, but is not detected in myofibers (Fig. 3A, Left). In the DM1 samples (n = 3), PKM2 was robustly expressed in a subset of myofibers (Fig. 3A, Right). Staining consecutive tissue sections with slow myosin, fast myosin, and PKM1 and PKM2 antibodies revealed that in both normal and DM1 skeletal muscle, PKM1 is preferentially expressed in fast (type 2) fibers, with lower levels detected in slow (type 1) myofibers (Fig. 3B). Because PKM1 is the constitutively active form with enhanced enzymatic activity, its expression is consistent with the high glycolytic activity of type 2 myofibers. In contrast, in DM1 samples, PKM2 is expressed predominantly in slow myofibers, which undergo atrophy (1). The selective expression of PKM2 in type 1 fibers suggests an association with muscle fiber atrophy and muscle weakness.
Fig. 3.
PKM2 up-regulation in DM1 muscle occurs specifically in type 1 myofibers. (A) Sections of paraffin embedded skeletal muscle tissues from control (Left) and DM1 (Right) individuals were stained with anti-PKM2 antibody. (B) Consecutive muscle sections from control (Left) and DM1 (Right) samples were stained with antibodies to fast myosin, type 1 myosin, PKM1, and PKM2. Arrowheads point to type 2 myofibers; arrows indicate type 1 myofibers. (Scale bar: 100 µm.)
Expression of CUGexp RNA Up-Regulates Pkm2 Levels in a DM1 Mouse Model.
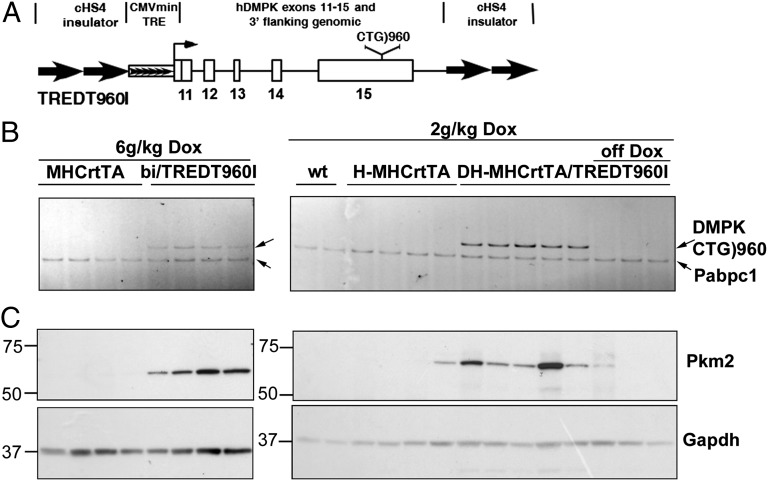
To determine whether up-regulation of PKM2 is a direct consequence of CUGexp RNA expression, we examined the levels of Pkm2 in a heart-specific and tetracycline-inducible transgenic mouse model of DM1. We generated transgenic lines of mice containing human DMPK exons 11–15 with 960 interrupted CTG repeats in the natural context of the expanded repeats in exon 15 (Fig. 4A). Animals were made bitransgenic with a transgene driving heart-specific expression of rtTA (21). An advantage of heart over skeletal muscle is the absence of regeneration, because regenerating skeletal muscle fibers are likely to reexpress Pkm2 (22). As shown in Fig. 4B, the administration of doxycycline (dox; 2 and 6 g/kg food) induced the expression of CUGexp RNA in bitransgenic mouse hearts, but not in control mice. Western blot analysis demonstrated substantially increased Pkm2 in all animals induced to express CUGexp RNA (Fig. 4C). Importantly, induction of Pkm2 by CUGexp RNA was found to be reversible, as demonstrated by the decreased CUGexp RNA and Pkm2 levels when animals were taken off dox food (Fig. 4 B and C).
Fig. 4.
Expression of CUGexp RNA induces Pkm2 in mouse heart. (A) Diagram of the tetracycline-inducible TREDT960I transgene used to express CUGexp RNA. (B) RT-PCR analysis of CUGexp RNA and poly(A)-binding protein C1 (Pabc1) mRNA (loading control) in cardiac alpha-myosin heavy chain (MHC)rtTA and TREDT960I/MHCrtTA bitransgenic mice fed 6 g dox/kg food for 10 wk (Left) and in WT, homozygous (H) MHCrtTA, and double-homozygous (DH) MHCrtTA/TREDT960I bitransgenic mice with 2 g dox/kg food for 12 wk (Right). Three animals were taken off dox for 16 wk (off dox). (C) Western blot analysis of heart protein extracts from the tissue samples shown in B.
Pkm2 Levels Are Regulated by CELF1 and Minimally by Mbnl1 and Mbnl2.
We next investigated the molecular mechanisms underlying the PKM2 increase in DM1 tissues. In cancer, up-regulation of splicing factors, such as PTB, hnRNPA1/A2, and SRSF3 (23-25), induces PKM2 expression. We were unable to detect a correlation between these proteins and PKM2 up-regulation in DM1 skeletal muscle, however, albeit with the caveat that subtle changes might not have been detected owing to low protein levels (Fig. S2).
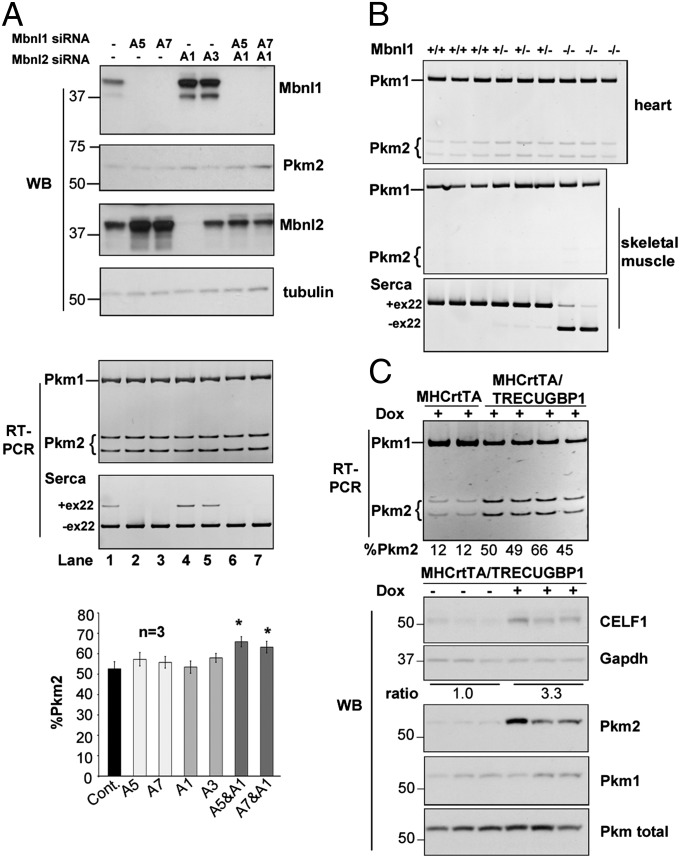
MBNL1 sequestration and CELF1 up-regulation are implicated in multiple misregulated splicing events in DM1 pathogenesis (26, 27). We used the C2C12 mouse myoblast cell line to test the effects of Mbnl1 depletion, because both Pkm1 and Pkm2 isoforms are present in undifferentiated myoblasts, and because differentiation of C2C12 into myotubes is accompanied by a switch from Pkm2 to Pkm1 (23, 24, 28). Although the inclusion of Serca1 exon 22, a known MBNL1 target (29), was suppressed on Mbnl1 depletion in differentiated C2C12 myotubes, inclusion of Pkm exon 10 (Pkm2) was unaffected (Fig. 5A, lanes 2 and 3). Mbnl2 levels were markedly increased in Mbnl1-depleted C2C12 cells (Fig. 5A, second panel, lanes 2 and 3), consistent with a recent report (27). Only a slight increase in Pkm2 inclusion was observed in cells transfected with both Mbnl1 and Mbnl2 siRNAs (Fig. 5A, lanes 6 and 7). Examination of Pkm splicing in heart and skeletal muscles from Mbnl1∆E3/∆E3 knockout mice by RT-PCR showed no increase of Pkm2 (Fig. 5B). These results suggest that loss of MBNL1 alone is unlikely to be responsible for the PKM2 splicing change in DM1 muscle.
Fig. 5.
CELF1 overexpression, but not Mbnl1 depletion, induces substantial Pkm2 expression. (A) Western blot (WB) (Top) and RT-PCR (Middle) analyses in C2C12 cells after siRNA-mediated knockdown of Mbnl1 and/or Mbnl2. Serca1 splicing responded to loss of Mbnl1. (Bottom) Pkm splicing was quantified from three independent experiments. Error bars indicate SEM. *P < 0.05. (B) RT-PCR analysis of Pkm splicing in heart and skeletal muscle from Mbnl1∆E3/∆E3 mice. (C) RT-PCR (Upper) and Western blot (Lower) analyses in heart tissue from hemizygous (single and double) MHCrtTA and MHCrtTA/TRECUGBP1 mice fed 2 g/kg dox food for 8 d. CELF1 induction is quantified as the normalized mean CELF1/GAPDH ratio from dox-unfed and dox-fed animals.
To determine whether CELF1 could induce expression of Pkm2, we used a previously described tetracycline-inducible transgenic mouse line in which human CELF1 is induced specifically in cardiomyocytes (30). Upon a threefold induction of CELF1 (based on Western blot analysis), we observed a substantial increase in Pkm2 at both the mRNA and protein levels (Fig. 5C). These results suggest that CELF1 elevation, perhaps in combination with MBNL1 and MBNL2 depletion, contributes to PKM2 reexpression in DM1.
A Splicing Shift to Pkm2 Alters Glucose Metabolism in Cultured Myotubes.
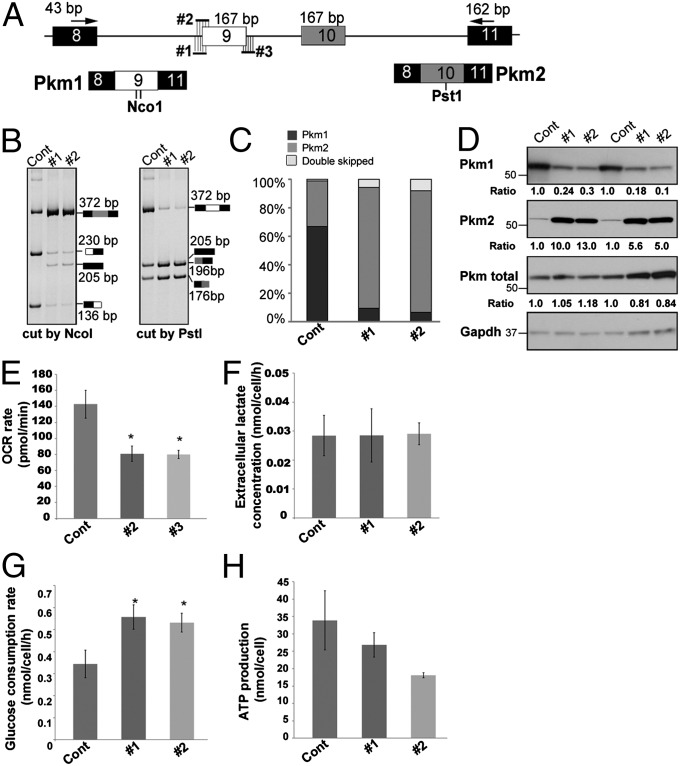
To examine the physiological consequences of elevated Pkm2 in skeletal muscle, we used antisense MOs to redirect splicing of exon 9 and increase Pkm2 expression as observed in DM1 myofibers. Two MOs complementary to the 3′ splice site of exon 9 or one MO complementary to the 5′ splice site of exon 9 were used to block exon 9 inclusion and promote a concurrent inclusion of exon 10 (Fig. 6A and Fig. S3). All three MOs robustly induced skipping of exon 9 and inclusion of exon 10, with MO #2 the most effective (Figs. 6 A–C and Fig. S3). A minor product indicating skipping of both exons 9 and 10 was also observed, as described previously (23, 31). Western blot analysis verified the substantial decrease (∼5- to 10-fold) in Pkm1 with a concomitant increase (∼5- to 10-fold) in Pkm2 (Fig. 6D).
Fig. 6.
Redirecting Pkm splicing in C2C12 myotubes changes cell metabolism. (A) Schematic showing PCR primers and MOs (#1–3) complementary to the 3′ and 5′ splice sites of Pkm exon 9. The NcoI sites in exon 9 (6 nt apart) and one PstI site in exon 10 are indicated in diagrams of the PCR products. (B) Splicing analysis of Pkm in C2C12 myotubes in the presence of 10 µM control, MO #1, or MO #2. The efficiency of MO #3 is shown in Fig. S3. (C) Quantification of Pkm2 inclusion in cells treated with MOs. (D) Western blots of proteins from MO-treated C2C12 myotubes and quantification normalized to GAPDH. (E–H) OCR (E), extracellular lactate concentration (F), glucose consumption rate (G), and ATP production (H) in C2C12 myotubes treated with control or Pkm MOs. Error bars indicate SEM.*P < 0.05.
PKM2 expression in cancer cells favors glycolysis over oxidative phosphorylation (32). To test whether a similar metabolic flux occurs in myotubes with increased Pkm2 expression, we measured the oxygen consumption rate (OCR) of cultures at physiological glucose levels (5 mM). Compared with cultures treated with a control MO, cultures treated with MOs that increase Pkm2 inclusion demonstrated a significant decrease in OCR (Fig. 6E; P < 0.05). Intriguingly, the decreased OCR was not accompanied by an increased extracellular acidification rate or extracellular lactate concentration (Fig. 6F), suggesting reduced glucose oxidative phosphorylation with no significant increase in glycolysis. Consistent with the role of PKM2 in promoting glucose uptake and consumption (33), we observed a significant increase in glucose consumption (Fig. 6G), accompanied by a trend toward decreased ATP production in myotubes with elevated Pkm2 expression (Fig. 6H). Taken together, these results suggest that myotubes with shifted Pkm expression have substantially increased glucose consumption but decreased oxidative metabolism, an effect likely to result in less efficient energy production.
Induced Expression of Pkm2 in Skeletal Muscle Enhances Energy Expenditure.
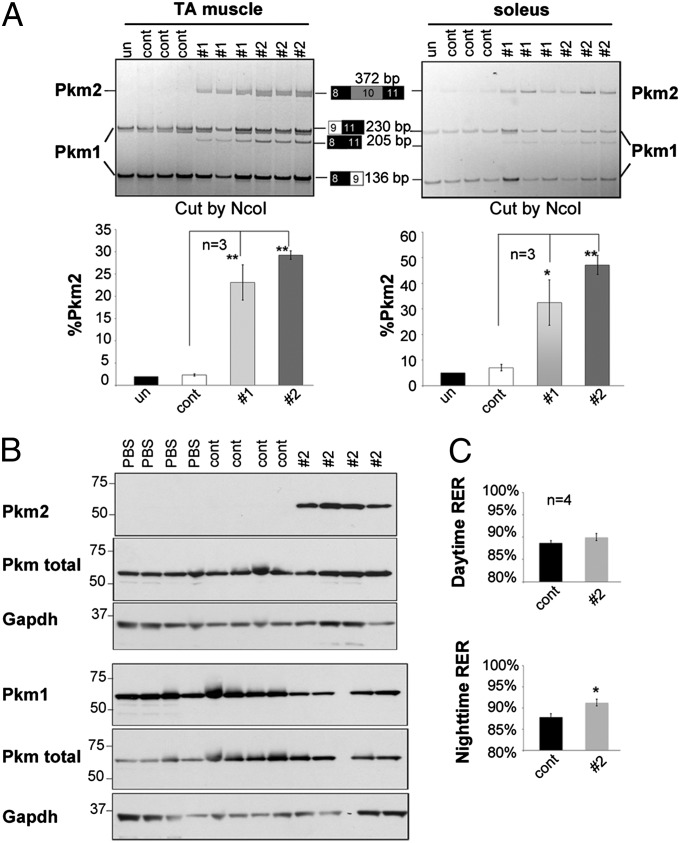
To explore the functional consequences of increased Pkm2 expression in skeletal muscle, we used MOs conjugated with octaguandine (vivo-MOs) for systemic delivery in mice. To first test the efficacy of induced splicing transitions, we delivered vivo-MOs of PKM-#1 and #2 into 4-wk-old mice using two consecutive daily i.v. injections of 12 mg/kg. At 72 h after the last injection, RT-PCR analysis showed that both MOs significantly promoted Pkm2 expression in the tibialis anterior (TA) and soleus muscles (Fig. 7A). Consistent with the results in C2C12 cells, the PKM-#2 MO showed higher efficiency than PKM-#1 in shifting Pkm splicing. Variable efficiency of Pkm splicing redirection was observed in different muscles, with the greatest efficiency in diaphragm (Figs. S4 and S5). Only small changes in the Pkm isoform ratio were observed in heart and brain (Fig. S4), in agreement with a previous report (34). Considering that Pkm2 is the predominant isoform in kidney and Pkm is not expressed in liver, the effects of systemically delivered vivo-MOs on inducing elevated Pkm2 expression occur predominantly in skeletal muscle.
Fig. 7.
Redirecting Pkm splicing in mice alters energy expenditure. (A) Vivo-MOs (control, PKM-#1, and PKM-#2) were delivered to mice at 12 mg/kg for 2 consecutive days, and RNA was isolated from TA and soleus muscles at 72 h after the last injection. RT-PCR analysis of Pkm was performed and quantified as indicated in Fig. 6. (B) Vivo-MOs (control and #2) were delivered at 16 mg/kg twice a week for 2 wk, followed 2 wk later by Western blot analysis. (C) Daytime (Upper) and nighttime (Lower) RER of mice used in B at 2 wk after the injection were measured by indirect calorimetry analysis. Error bars indicate SEM. *P < 0.05; **P < 0.01.
A single injection of vivo-MO shifted Pkm splicing in skeletal muscle up to 4 wk (Fig. S5). To test the physiological consequences of a shift to Pkm2, we administered the PKM-#2 vivo-MO and an inverted sequence control vivo-MO at 16 mg/kg biweekly for 2 wk, followed by analysis 2 wk later. Western blot analysis confirmed increased Pkm2 and decreased Pkm1 in TA muscles (Fig. 7B). Histological and physiological analysis revealed no significant differences between control and PKM-#2 MO-treated mice at each time point tested. Metabolic analysis showed no difference in the RER between control and PKM-#2 vivo-MO injected mice during the day; however, a significant increase in RER in mice with shifted Pkm splicing was seen at night, when mice are more active (Fig. 7C). These results suggest that mice with enhanced Pkm2 expression in skeletal muscle use glucose rather than fat as fuel and have greater energy expenditure associated with activity. These data indicate that Pkm2 reexpression in skeletal muscle disrupts the metabolic homeostasis and may lead to energy deficits associated with muscle weakness and wasting (35).
Discussion
Unlike in other types of muscular dystrophy, the progressive muscle weakness and wasting in DM1 is not accompanied by overt necrosis, regeneration, and fibrosis. It is likely that metabolic changes contribute to muscle weakness. Early studies suggested that an imbalance between anabolism and catabolism results in muscle wasting in DM1 (10, 11); however, the mechanisms underlying a potential metabolic imbalance remain unclear. Here we report an aberrant alternative splicing transition that substantially increases expression of PKM2 in type 1 myofibers, which are particularly susceptible to atrophy in DM1. A switch from Pkm1 to Pkm2 expression disrupted glucose homeostasis in cultured myotubes and increased the energy expenditure in mice. We propose that increased expression of PKM2 in type 1 myofibers contributes to their susceptibility to atrophy in DM1. In combination with our previous demonstration of reduced glucose uptake in DM1 myoblasts associated with disrupted splicing of the insulin receptor (15), the present study highlights a potential role for altered glucose metabolism in DM1 skeletal muscle pathogenesis.
PKM2 is essential for aerobic glycolysis (the Warburg effect) in cancer by promoting glycolytic flux and regulating the transcription of metabolic genes (19). Our study reveals a potential pathological role for increased PKM2 expression in noncancer cells. We found that in contrast to the importance of PKM2 in promoting glycolysis in cancer, Pkm2 expression in myotubes did not significantly increase the glycolytic rate, despite a reduced OCR. The distinct consequences of Pkm2 expression likely arise from the different cellular environments, with cancer cells expressing high levels of glycolytic enzymes including hexokinase, phosphofructokinase, and lactate dehydrogenase (36, 37), which may substantially enhance the role of PKM2 in promoting glycolysis. In support of our hypothesis, previous studies have shown that PKM2 is less effective than PKM1 in promoting glycolysis and energy production in nontransformed rat kidney cells (38). Induced expression of PKM2 in DM1 heart and skeletal muscle may disrupt metabolic homeostasis and contribute to impaired long-term function.
In addition to its metabolic role, PKM2 regulates gene transcription by phosphorylating histone H3 or STAT3 or by interacting with hypoxia-induced factor 1α to promote tumorigenesis (39–41). Whether PKM2 expression in DM1 is involved in transcriptional reprogramming in skeletal muscle remains to be explored.
We did not detect up-regulation of PTB, hnRNPA1/A2, or SRSF3 levels in DM1 muscles. Our results show that depletion of Mbnl1 alone had no effect on Pkm2 expression and depletion of Mbnl1 and Mbnl2 had a minor effect, whereas overexpression of CELF1 resulted in increased Pkm2 expression. It is possible that MBNL1/MBNL2 loss of function and CELF1 gain of function combinatorially contribute to PKM2 reexpression in DM1. Examining the mechanism responsible for the robust PKM2 up-regulation specifically in type 1 fibers is of particular interest.
A hallmark of DM1 is splicing misregulation (26, 27). It is unlikely that changes in a single splicing event, such as PKM2 expression, would result in the progressive muscle weakness; however, multiple splicing defects in the same signaling or metabolic pathway may accumulate to disrupt muscle function. Given the importance of insulin signaling in protein synthesis and anabolism, the previously reported aberrant splicing of insulin receptors (15) likely results in deficient protein synthesis in skeletal muscle, in agreement with earlier studies suggesting that the muscle weakness in DM1 results from a reduced protein synthesis rate (11). The expression of PKM2 in DM1 muscle can further perturb glucose metabolism and energy homeostasis. Previous studies have reported associations between muscle weakness and missplicing of BIN1 and Cav1.1, as well as aberrant GSK3β signaling (12–14), supporting the idea that progressive muscle weakness in DM1 may result from combinatorial abnormalities in calcium signaling, T-tubule biogenesis, and glucose and protein metabolism.
Materials and Methods
Animal and Human Samples.
All animal procedures were approved by Baylor College of Medicine’s Animal Care Committee. Human samples were obtained from the National Disease Research Interchange (NDRI) under corresponding protocols. MHCrtTA (21), TREDT960I, Mbnl1∆E3/∆E3 (42), and TRECUGBP1 (30, 43) mice were all bred on the FVB background.
Cell Culture and siRNA Transfection.
C2C12 myoblasts were maintained in DMEM supplemented with 10% FBS and antibiotics. To induce differentiation, confluent cells were incubated in DMEM supplemented with 2% horse serum for 4–6 d. Stealth siRNAs (50 nM) (Invitrogen; sequences listed in Table S1) were delivered into undifferentiated C2C12 cells (50% confluency) using RNAiMax (Invitrogen), followed by differentiation for 4 d.
MO Antisense Oligonucleotide Delivery.
MO sequences (Gene Tools) are listed in Table S1. An MO with inverted sequence to PKM-#2 served as a control. MOs (10 μM) were delivered into confluent C2C12 cells using Endoporter (Gene Tools), followed by differentiation for 6 d.
PKM-#2 or inverted control Vivo-MOs (Gene Tools) were introduced into 4-wk-old FVB WT male mice by tail vein injection at 12 g/kg or 16 g/kg. For metabolic studies, Vivo-MOs were injected into mice twice weekly for 2 wk. At 2 wk after the final injection, mice were tested by indirect calorimetry analysis and killed for histological, RT-PCR, and Western blot analyses.
Western Blot Analysis.
Cell extracts were prepared from undifferentiated C2C12 cells or differentiated myotubes in RIPA buffer. Skeletal muscle or heart tissues were homogenized in a Bullet Blender (Next Advance), and proteins were solubilized in RIPA buffer, followed by sonication, centrifugation, and quantification using the bicinchoninic acid assay (Pierce). Western blot analysis was performed following standard procedures, and blots were quantified using Carestream software (Kodak). The primary antibodies used are listed in SI Text.
RT-PCR.
RNA was isolated from skeletal muscle or heart tissue using TRIzol (Invitrogen) after homogenization in a Bullet Blender. For C2C12 cells, RNA was isolated using TRIzol according to the manufacturer's protocol. RNA (2 μg) was reverse-transcribed using AMV reverse transcriptase (Life Sciences), followed by PCR analysis using GO Taq Master Mix (Promega). PKM PCR primer sequences were as described previously (24). PCR products were separated on 5% acrylamide gels and quantified with the Kodak Gel Logic 2200 Imaging system.
Oxygen Consumption, Glucose Consumption, and Lactate Measurement.
The oxygen consumption rate of C2C12 myotubes was measured with a Seahorse XF24 analyzer in DMEM (D5030; Sigma-Aldrich) containing 5 mM glucose and 2 mM pyruvate in the absence of glutamine according to the manufacturer’s instructions. Extracellular lactate concentration and glucose consumption rate were determined using the lactate and glucose assay kit from Biovision and normalized to the cell number. ENLITEN ATP assay system bioluminescence detection kit (Promega) was used for ATP measurement.
Immunohistochemistry Analysis.
Formalin-fixed, paraffin-embedded skeletal muscle tissue sections were deparaffinized and rehydrated in gradient ethanol in accordance with standard histological protocol. Antigen retrieval was performed by incubating slides in target retrieval solution (pH 9.0; Dako) at 95 °C for 20 min. Slides were then blocked and incubated in rabbit anti-PKM2 (Cell Signaling Technology), rabbit anti-PKM1 (Sigma-Aldrich), mouse anti-slow myosin (Sigma-Aldrich), or mouse anti-fast myosin (Sigma-Aldrich) antibodies, followed by incubation in corresponding secondary antibody and visualization with the Envision+ System (Dako).
Indirect Calorimetry Analysis.
Oxygen consumption and carbon dioxide production of individual mice on a regular diet in metabolic cages were measured at room temperature at 1-min intervals for up to 24 h using an Oxymax Flowmax 210 (Columbus Instruments). Data were analyzed based on the daytime (from 7:00 AM–6:59 PM) and nighttime (7:00 PM–6:59 AM) periods.
Supplementary Material
Acknowledgments
We thank Dr. Charles Thornton for FVB Mbnl1∆E3/+ animals; Drs. Susan Hamilton and Mark Knoblauch for the test of muscle mechanics; and Donnie Bundman, Jimena Giudice, Simona Pedrotti, and Marissa Ruddy and other members of the T.A.C. laboratory for advice and technical assistance. Z.G. was supported by a fellowship from the Myotonic Dystrophy Foundation. T.A.C. is supported by the National Institutes of Health (Grants R01 AR45653, R01 HL045565, and R01 AR060733) and the Muscular Dystrophy Association.
Footnotes
The authors declare no conflict of interest.
This article is a PNAS Direct Submission.
This article contains supporting information online at www.pnas.org/lookup/suppl/doi:10.1073/pnas.1308806110/-/DCSupplemental.
References
- 1.Harper PS. Myotonic Dystrophy. London: Saunders; 2001. [Google Scholar]
- 2.Udd B, Krahe R. The myotonic dystrophies: Molecular, clinical, and therapeutic challenges. Lancet Neurol. 2012;11(10):891–905. doi: 10.1016/S1474-4422(12)70204-1. [DOI] [PubMed] [Google Scholar]
- 3.Brook JD, et al. Molecular basis of myotonic dystrophy: Expansion of a trinucleotide (CTG) repeat at the 3′ end of a transcript encoding a protein kinase family member. Cell. 1992;68(4):799–808. doi: 10.1016/0092-8674(92)90154-5. [DOI] [PubMed] [Google Scholar]
- 4.Mahadevan M, et al. Myotonic dystrophy mutation: An unstable CTG repeat in the 3′ untranslated region of the gene. Science. 1992;255(5049):1253–1255. doi: 10.1126/science.1546325. [DOI] [PubMed] [Google Scholar]
- 5.Liquori CL, et al. Myotonic dystrophy type 2 caused by a CCTG expansion in intron 1 of ZNF9. Science. 2001;293(5531):864–867. doi: 10.1126/science.1062125. [DOI] [PubMed] [Google Scholar]
- 6.Wheeler TM, Thornton CA. Myotonic dystrophy: RNA-mediated muscle disease. Curr Opin Neurol. 2007;20(5):572–576. doi: 10.1097/WCO.0b013e3282ef6064. [DOI] [PubMed] [Google Scholar]
- 7.Miller JW, et al. Recruitment of human muscleblind proteins to (CUG)(n) expansions associated with myotonic dystrophy. EMBO J. 2000;19(17):4439–4448. doi: 10.1093/emboj/19.17.4439. [DOI] [PMC free article] [PubMed] [Google Scholar]
- 8.Mankodi A, et al. Ribonuclear inclusions in skeletal muscle in myotonic dystrophy types 1 and 2. Ann Neurol. 2003;54(6):760–768. doi: 10.1002/ana.10763. [DOI] [PubMed] [Google Scholar]
- 9.Kuyumcu-Martinez NM, Wang GS, Cooper TA. Increased steady-state levels of CUGBP1 in myotonic dystrophy 1 are due to PKC-mediated hyperphosphorylation. Mol Cell. 2007;28(1):68–78. doi: 10.1016/j.molcel.2007.07.027. [DOI] [PMC free article] [PubMed] [Google Scholar]
- 10.Halliday D, Ford GC, Edwards RH, Rennie MJ, Griggs RC. In vivo estimation of muscle protein synthesis in myotonic dystrophy. Ann Neurol. 1985;17(1):65–69. doi: 10.1002/ana.410170115. [DOI] [PubMed] [Google Scholar]
- 11.Griggs RC, et al. Mechanism of muscle wasting in myotonic dystrophy. Ann Neurol. 1990;27(5):505–512. doi: 10.1002/ana.410270509. [DOI] [PubMed] [Google Scholar]
- 12.Fugier C, et al. Misregulated alternative splicing of BIN1 is associated with T tubule alterations and muscle weakness in myotonic dystrophy. Nat Med. 2011;17(6):720–725. doi: 10.1038/nm.2374. [DOI] [PubMed] [Google Scholar]
- 13.Tang ZZ, et al. Muscle weakness in myotonic dystrophy associated with misregulated splicing and altered gating of Ca(V)1.1 calcium channel. Hum Mol Genet. 2012;21(6):1312–1324. doi: 10.1093/hmg/ddr568. [DOI] [PMC free article] [PubMed] [Google Scholar]
- 14.Jones K, Wei C, Iakova P, Bugiardini E, Schneider-Gold C, et al. GSK3beta mediates muscle pathology in myotonic dystrophy. J Clin Invest. 2012;122(12):4461–4472. doi: 10.1172/JCI64081. [DOI] [PMC free article] [PubMed] [Google Scholar]
- 15.Savkur RS, Philips AV, Cooper TA. Aberrant regulation of insulin receptor alternative splicing is associated with insulin resistance in myotonic dystrophy. Nat Genet. 2001;29(1):40–47. doi: 10.1038/ng704. [DOI] [PubMed] [Google Scholar]
- 16.Imamura K, Tanaka T. Multimolecular forms of pyruvate kinase from rat and other mammalian tissues, I: Electrophoretic studies. J Biochem. 1972;71(6):1043–1051. doi: 10.1093/oxfordjournals.jbchem.a129852. [DOI] [PubMed] [Google Scholar]
- 17.Noguchi T, Inoue H, Tanaka T. The M1- and M2-type isozymes of rat pyruvate kinase are produced from the same gene by alternative RNA splicing. J Biol Chem. 1986;261(29):13807–13812. [PubMed] [Google Scholar]
- 18.Christofk HR, et al. The M2 splice isoform of pyruvate kinase is important for cancer metabolism and tumour growth. Nature. 2008;452(7184):230–233. doi: 10.1038/nature06734. [DOI] [PubMed] [Google Scholar]
- 19.Luo W, Semenza GL. Emerging roles of PKM2 in cell metabolism and cancer progression. Trends Endocrinol Metab. 2012;23(11):560–566. doi: 10.1016/j.tem.2012.06.010. [DOI] [PMC free article] [PubMed] [Google Scholar]
- 20.Mankodi A, et al. Expanded CUG repeats trigger aberrant splicing of ClC-1 chloride channel pre-mRNA and hyperexcitability of skeletal muscle in myotonic dystrophy. Mol Cell. 2002;10(1):35–44. doi: 10.1016/s1097-2765(02)00563-4. [DOI] [PubMed] [Google Scholar]
- 21.Valencik ML, McDonald JA. Codon optimization markedly improves doxycycline-regulated gene expression in the mouse heart. Transgenic Res. 2001;10(3):269–275. doi: 10.1023/a:1016601928465. [DOI] [PubMed] [Google Scholar]
- 22.Orengo JP, Ward AJ, Cooper TA. Alternative splicing dysregulation secondary to skeletal muscle regeneration. Ann Neurol. 2011;69(4):681–690. doi: 10.1002/ana.22278. [DOI] [PMC free article] [PubMed] [Google Scholar]
- 23.Clower CV, et al. The alternative splicing repressors hnRNP A1/A2 and PTB influence pyruvate kinase isoform expression and cell metabolism. Proc Natl Acad Sci USA. 2010;107(5):1894–1899. doi: 10.1073/pnas.0914845107. [DOI] [PMC free article] [PubMed] [Google Scholar]
- 24.David CJ, Chen M, Assanah M, Canoll P, Manley JL. HnRNP proteins controlled by c-Myc deregulate pyruvate kinase mRNA splicing in cancer. Nature. 2010;463(7279):364–368. doi: 10.1038/nature08697. [DOI] [PMC free article] [PubMed] [Google Scholar]
- 25.Wang Z, et al. Exon-centric regulation of pyruvate kinase M alternative splicing via mutually exclusive exons. J Mol Cell Biol. 2012;4(2):79–87. doi: 10.1093/jmcb/mjr030. [DOI] [PMC free article] [PubMed] [Google Scholar]
- 26.Du H, et al. Aberrant alternative splicing and extracellular matrix gene expression in mouse models of myotonic dystrophy. Nat Struct Mol Biol. 2010;17(2):187–193. doi: 10.1038/nsmb.1720. [DOI] [PMC free article] [PubMed] [Google Scholar]
- 27.Wang ET, et al. Transcriptome-wide regulation of pre-mRNA splicing and mRNA localization by muscleblind proteins. Cell. 2012;150(4):710–724. doi: 10.1016/j.cell.2012.06.041. [DOI] [PMC free article] [PubMed] [Google Scholar]
- 28.Harada Y, Nakamura M, Asano A. Temporally distinctive changes of alternative splicing patterns during myogenic differentiation of C2C12 cells. J Biochem. 1995;118(4):780–790. doi: 10.1093/oxfordjournals.jbchem.a124980. [DOI] [PubMed] [Google Scholar]
- 29.Hino S, et al. Molecular mechanisms responsible for aberrant splicing of SERCA1 in myotonic dystrophy type 1. Hum Mol Genet. 2007;16(23):2834–2843. doi: 10.1093/hmg/ddm239. [DOI] [PubMed] [Google Scholar]
- 30.Koshelev M, Sarma S, Price RE, Wehrens XH, Cooper TA. Heart-specific overexpression of CUGBP1 reproduces functional and molecular abnormalities of myotonic dystrophy type 1. Hum Mol Genet. 2010;19(6):1066–1075. doi: 10.1093/hmg/ddp570. [DOI] [PMC free article] [PubMed] [Google Scholar]
- 31.Wang Z, Jeon HY, Rigo F, Bennett CF, Krainer AR. Manipulation of PK-M mutually exclusive alternative splicing by antisense oligonucleotides. Open Biol. 2012;2(10):120133. doi: 10.1098/rsob.120133. [DOI] [PMC free article] [PubMed] [Google Scholar]
- 32.Christofk HR, Vander Heiden MG, Wu N, Asara JM, Cantley LC. Pyruvate kinase M2 is a phosphotyrosine-binding protein. Nature. 2008;452(7184):181–186. doi: 10.1038/nature06667. [DOI] [PubMed] [Google Scholar]
- 33.Yang W, et al. ERK1/2-dependent phosphorylation and nuclear translocation of PKM2 promotes the Warburg effect. Nat Cell Biol. 2012;14(12):1295–1304. doi: 10.1038/ncb2629. [DOI] [PMC free article] [PubMed] [Google Scholar]
- 34.Morcos PA, Li Y, Jiang S. Vivo-Morpholinos: A non-peptide transporter delivers Morpholinos into a wide array of mouse tissues. Biotechniques. 2008;45(6):613–614, 616, 618 passim. doi: 10.2144/000113005. [DOI] [PubMed] [Google Scholar]
- 35.Ruvinsky I, et al. Mice deficient in ribosomal protein S6 phosphorylation suffer from muscle weakness that reflects a growth defect and energy deficit. PLoS ONE. 2009;4(5):e5618. doi: 10.1371/journal.pone.0005618. [DOI] [PMC free article] [PubMed] [Google Scholar]
- 36.Atsumi T, et al. High expression of inducible 6-phosphofructo-2-kinase/fructose-2,6-bisphosphatase (iPFK-2; PFKFB3) in human cancers. Cancer Res. 2002;62(20):5881–5887. [PubMed] [Google Scholar]
- 37.Devgun MS. Lactate dehydrogenase in lung cancer. Clin Chem. 1988;34(9):1947–1948. [PubMed] [Google Scholar]
- 38.Mazurek S, Zwerschke W, Jansen-Dürr P, Eigenbrodt E. Metabolic cooperation between different oncogenes during cell transformation: Interaction between activated ras and HPV-16 E7. Oncogene. 2001;20(47):6891–6898. doi: 10.1038/sj.onc.1204792. [DOI] [PubMed] [Google Scholar]
- 39.Luo W, et al. Pyruvate kinase M2 is a PHD3-stimulated coactivator for hypoxia-inducible factor 1. Cell. 2011;145(5):732–744. doi: 10.1016/j.cell.2011.03.054. [DOI] [PMC free article] [PubMed] [Google Scholar]
- 40.Gao X, Wang H, Yang JJ, Liu X, Liu ZR. Pyruvate kinase M2 regulates gene transcription by acting as a protein kinase. Mol Cell. 2012;45(5):598–609. doi: 10.1016/j.molcel.2012.01.001. [DOI] [PMC free article] [PubMed] [Google Scholar]
- 41.Yang W, et al. PKM2 phosphorylates histone H3 and promotes gene transcription and tumorigenesis. Cell. 2012;150(4):685–696. doi: 10.1016/j.cell.2012.07.018. [DOI] [PMC free article] [PubMed] [Google Scholar]
- 42.Kanadia RN, et al. A muscleblind knockout model for myotonic dystrophy. Science. 2003;302(5652):1978–1980. doi: 10.1126/science.1088583. [DOI] [PubMed] [Google Scholar]
- 43.Ward AJ, Rimer M, Killian JM, Dowling JJ, Cooper TA. CUGBP1 overexpression in mouse skeletal muscle reproduces features of myotonic dystrophy type 1. Hum Mol Genet. 2010;19(18):3614–3622. doi: 10.1093/hmg/ddq277. [DOI] [PMC free article] [PubMed] [Google Scholar]
Associated Data
This section collects any data citations, data availability statements, or supplementary materials included in this article.


