Abstract
The sequential steps in the alphavirus membrane fusion pathway have been postulated based on the prefusion and postfusion crystal structures of the viral fusion protein E1 in conjunction with biochemical studies. However, the molecular structures of the hypothesized fusion intermediates have remained obscure due to difficulties inherent in the dynamic nature of the process. We developed an experimental system that uses liposomes as the target membrane to capture Sindbis virus, a prototypical alphavirus, in its membrane-binding form at pH 6.4. Cryoelectron micrograph analyses and 3D reconstructions showed that the virus retains its overall icosahedral structure at this mildly acidic pH, except in the membrane-binding region, where monomeric E1 associates with the target membrane and the E2 glycoprotein retains its original trimeric organization. The remaining E2 trimers may hinder E1 homotrimerization and are a potential target for antiviral drugs.
Keywords: enveloped viruses, class II viral fusion protein, viral entry, protein organization, image processing
Alphaviruses, a genus of the Togaviridae family, have been an important experimental paradigm for studying virus membrane fusion for 3 decades (1, 2). Enveloped alphaviruses, such as Sindbis virus (SINV), Semliki Forest virus (SFV), and Chikungunya virus (CHIKV), enter host cells via receptor-mediated endocytosis followed by low-pH-triggered membrane fusion within the endosome (3, 4). Liposome-based model systems involving low-pH treatment have provided a convenient in vitro method for studying alphavirus membrane fusion and have greatly advanced our understanding of the molecular mechanism underlying this dynamic process (5–9).
At neutral pH, an alphavirus particle has a T = 4 icosahedral structure that consists of a nucleocapsid core, a viral membrane, and a glycoprotein shell (10–13). The nucleocapsid core includes an RNA genome and 240 copies of the capsid protein. The exterior glycoprotein shell features 80 spikes projecting from the viral membrane. Each spike is composed of three copies of the E1–E2 glycoprotein heterodimer in a right-handed arrangement. Both E1 and E2 span the viral membrane. The cytoplasmic tail of E2 interacts with the viral capsid, whereas the ectodomain of E2 makes up the central and outermost portions of each spike. The ectodomain of E1 is oriented almost tangentially to the viral membrane, forming a region called the “skirt” within the glycoprotein shell (11, 14).
To date, structural insights into alphavirus membrane fusion have been shaped largely by X-ray crystallographic studies of the E1 and E2 molecules in their prefusion states (15–17) as well as the E1 postfusion trimer (18). At its outermost tip, E1 contains a hydrophobic fusion loop that is sequestered by the companion E2 protein at neutral pH. Once low pH triggers dissociation of the E1–E2 heterodimer, the E1 fusion loop inserts itself into the endosomal membrane. Thereafter, the E1 protein forms a homotrimer that mediates fusion of the viral and target membranes through a folding-back mechanism (6, 19).
The fusion threshold for commonly used wild-type SFV strains is pH ∼6.2 (6), whereas SINV fusion threshold varies markedly from pH 5.6 (Toto 1101 strain) (20), to 6.0 (strain AR339) (8), to 6.5 (TE12) (21). The structures of these viruses at pH values ∼5.0−5.9 have been examined using cryoelectron microscopy (cryo-EM) and 3D reconstruction techniques (22–25); however, low-pH-triggered conformational rearrangements of the virus in the context of a target membrane are rarely investigated via these techniques (26). Here we present a cryo-EM study of SINV TE12 in complex with a liposomal membrane at pH 6.4. The structure of this early-stage SINV fusion intermediate provides insight into the virus–membrane interaction at low pH, which is an important step toward E1 homotrimerization and membrane fusion.
Results
SINV at pH 6.4 Maintains the T = 4 Icosahedral Structure.
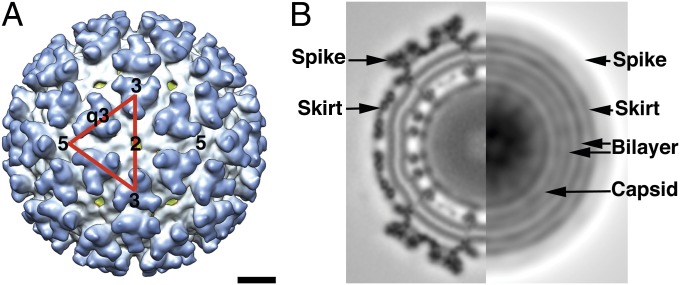
Cryo-EM images of SINV at pH 6.4 after incubation at 37 °C for 2 min showed no visible interactions among particles on a glow discharged carbon film. Moreover, the 14.5-Å-resolution reconstruction map computed from 5,670 particle images exhibited the same T = 4 icosahedral protein organization seen at neutral pH (27) (Fig. 1). The atomic models of the CHIKV E1 and E2 ectodomains (17) could be well fitted into the reconstruction map, and the E1 and E2 glycosylation sites (E1-139/245 and E2-196/318) remained essentially at the same positions they occupied within the neutral-pH structure (14). These observations indicate that acidification of SINV to pH 6.4 had little effect on the icosahedral architecture of the virus particle.
Fig. 1.
Cryo-EM reconstruction map of SINV at pH 6.4. (A) The 14.5-Å-resolution reconstruction map of SINV at pH 6.4. An icosahedral asymmetric unit of the virus is shown as a red triangle, with the positions of the 5-, 3-, 2-, and q3-fold axes denoted by numbers. The map is color-coded such that the viral membrane is green, the skirt is white, and the spike is blue. The scale bar is 100 Å, applicable to both A and B. (B) Central cross-section of the reconstruction map (Left) and a rotationally averaged projection image (Right) showing the layered features of the protein shells and the viral membrane (labeled). The rotationally averaged image was computed from the model projections at 2° angular intervals within one asymmetric unit (37).
Presence of the Target Membrane at pH 6.4 Induces Local Conformational Changes on the Virus Surface.
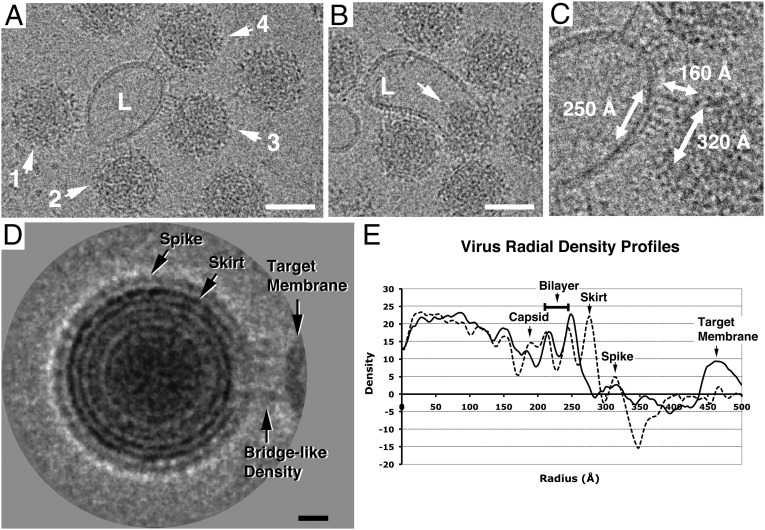
SINV–liposome complexes were flash frozen and imaged after exposing a mixture of SINV and liposomes to pH 6.4 at 37 °C for 2 min. The pH was slightly lower than the fusion threshold (pH 6.5) determined for the SINV strain used in the experiment (21). The liposomes ranged from 500 to 1,500 Å in size and appeared to lie nearly side by side with the virus particles in the plane of the carbon film (Fig. 2 A–C). Occasionally (<0.1% of total viral particles), the virus appeared to merge with the liposomal membrane and release its core into the lumen, suggesting that membrane fusion did occur under the experimental conditions (Fig. 2B).
Fig. 2.
Cryo-EM images of acidified SINV–liposome complexes (pH 6.4). (A) Image showing bridge-like densities spanning between SINV particles (labeled 1–4) and a liposome (L). Scale bar is 500 Å. (B) Image showing a SINV particle likely fused with a liposome (L). The arrow indicates its released capsid core. Scale bar is 500 Å. (C) Enlarged view and dimensions of the virus–liposome interaction site (particle 3 in A). (D) Two-dimensional average of the images of the SINV–liposome complex. Note that the ring of the skirt is broken at the liposome-binding site. Scale bar is 100 Å. (E) Virus radial density profiles derived from the image shown in D. Measurements were made from the center of the virus in the 3 o’clock (solid line) and 9 o’clock (dashed line) directions.
It was apparent in the cryo-EM images that at pH 6.4, SINV particles associated with the target membrane through discrete bridge-like densities, which were not observed when the SINV and liposome samples were incubated at neutral pH (Fig. S1). The dimension of the interaction area on the virus surface was about 250–350 Å (Fig. 2C), suggesting that the virus binding site could cover the entire asymmetric unit of the SINV structure (Fig. 1A). The central portion of the bridge-like densities appeared nearly normal to both the virus and the liposomal surface and had the shortest spanning distance, whereas the surrounding densities appeared to link the two surfaces over longer distances at tilted angles. A total of 1,425 SINV–liposome images showing these density features was selected for further analysis.
In the selected 2D images, the liposomal membrane was ∼380 Å (SD = 27 Å) from the virus center. It is expected that this distance is smaller than the actual distance to be measured in 3D space due to the fact that the virus particle could lie above or below the bound liposome in the vitreous ice. To address this issue, images showing the complexes with the largest 4% of measured distances between the virus center and liposomal membrane (> 428 Å) were used to calculate a 2D average image representing the situation in which a virus particle approached a liposome from the side.
The average image in Fig. 2D shows concentric density rings, a pattern consistent with that computed from the model projections (Fig. 1B). Radial density profiles (Fig. 2E) were then calculated from the virus center in the directions running directly toward and away from the virus–liposome interaction site (Fig. S2). On the side of the virus opposite the liposome-binding site, the density maxima (dashed line) clearly demark the radial positions of the capsid, the membrane bilayer, the skirt, and the spike. On the liposome-binding side of the virus, proximal to the target membrane, the density distribution (solid line) shows a marked (∼90%) decrease in the skirt region, suggesting significant changes in the placement of the E1 glycoprotein. By contrast, the density corresponding to the glycoprotein spikes has a wider peak and a smaller amplitude (∼56%), indicating that the E2 protein likely stays at its original radial position but is less stable. The appearance of the bristle densities between the virus and the liposome (Fig. 2D), which are most likely contributed by the dislocated E1 ectodomain, provides strong structural evidence that E1 is responsible for the initial interaction between the virus and the target membrane at low pH. This is consistent with its functional role of E1 (4).
The 2D averaging analysis also made evident the structural changes in the viral membrane and capsid beneath the virus–liposome interaction site. The inner and outer layers of the membrane were displaced ∼5 Å outward (Fig. 2E). This local membrane rearrangement may reflect changes in the constraint on the membrane curvature enforced by the outside protein shell as E1 inserts itself into the target membrane. In addition, the discontinuity of the density ring corresponding to the capsid (Fig. 2D) probably reflects the structural instability of E2, whose cytoplasmic tail interacts with the capsid protein (12).
No Specific Orientation Is Required for SINV to Bind a Target Membrane.
The icosahedral reconstruction of the SINV–liposome complex resembles the T = 4 SINV structure at pH 6.4 (Fig. 1A), suggesting a relatively homogeneous viral population with a largely consistent icosahedral structure. However, the reconstruction map presents no density variation in E1 or the target membrane due to the loss of local structural information that does not conform to the enforced icosahedral symmetry.
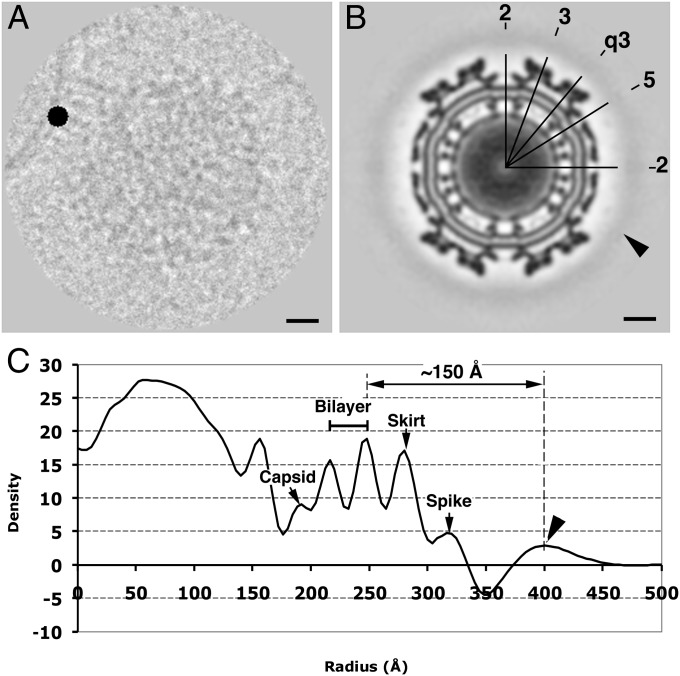
To determine whether SINV adopts a preferred orientation to attach a target membrane, we used a method described in previous studies of the poliovirus-receptor-membrane complex (26, 28). A mask disk of 64 Å in diameter and with a density 12 SD higher than the average value of the boxed image was added to the image at the point on the target membrane closest to the bound SINV particle (Fig. 3A). If there were a consistent binding position among all SINV particles, the mask disk would introduce a high-density feature in the icosahedral reconstruction map. In fact, the reconstruction calculated from 1,425 masked images shows a continuous smeared density at 150 Å away from the viral membrane (Fig. 3 B and C). This suggests that there is no exclusively unique binding location on the surface of a SINV particle when it attaches a target membrane.
Fig. 3.
Reconstruction of masked SINV–liposome complex images. (A) An exemplary image showing a high-intensity disk of 64 Å in diameter situated on the target membrane. (B) Cross-section of the icosahedral reconstruction map. The arrowhead indicates the smeared density shell surrounding the virus surface. The numbers represent the icosahedral 5-, 3-, 2-, and q3-fold axes. (C) Radial density profile of the reconstruction map showing the position and thickness of the extra density shell. The arrowhead indicates the peak of the density shell introduced by the black disk. Scale bars in A and B are 100 Å.
Three-Dimensional Reconstruction Reveals Retained Trimeric E2 at the Virus–Membrane Interface.
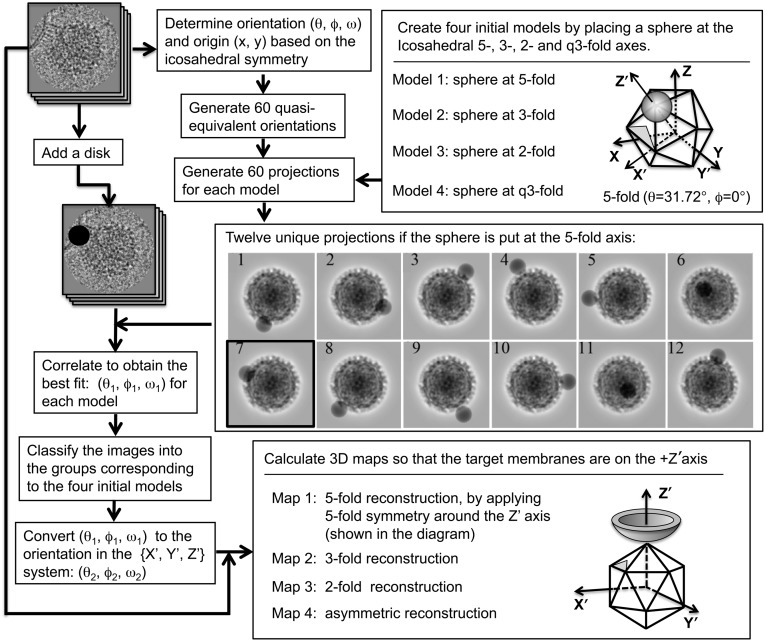
To obtain reliable 3D reconstructions of SINV–liposome complexes, a procedure involving multiple reference models that assumed an interaction site at the 5-, 3-, 2-, or q3-fold axis of the virus was used to classify the images into four representative subgroups (Fig. 4). The logic behind this classification procedure was that only several separated orientations distributed within the asymmetric unit are sufficient to approximate all possible binding scenarios because the virus–liposome interaction affects a substantial area of the asymmetric unit on the virus structure (Fig. 2C). Table 1 lists the number of particles that correlate best with each reference model.
Fig. 4.
Schematic outline of the 3D reconstruction procedure used for SINV–liposome complexes (Materials and Methods). It was assumed that liposome binding occurs at the 5-, 3-, 2-, and q3-fold axes of the icosahedral SINV particle. The orientation of an icosahedral particle was defined in Belnap et al. (39).
Table 1.
Cryo-EM data collection and image reconstruction
| Sample | Defocus,* μm | Symmetry of the model and reconstruction | No. of particles | Resolution,† Å |
| SINV (pH 6.4) | 1.10–2.89 | Icosahedral | 5,670 | 14.5 |
| SINV–liposome (pH 6.4) | 1.08–4.01 | 2-fold | 442 | ∼30.0 |
| 3-fold | 237 | ∼30.0 | ||
| 5-fold | 196 | ∼30.0 | ||
| q3-fold‡ | 550 | ∼30.0 |
Defocus levels were determined using RobEM (http://cryoem.ucsd.edu/programs.shtm).
The resolution of the SINV (pH 6.4) map was assessed using Fourier shell correlation with a threshold value of 0.5. The reconstruction maps of the SINV–liposome complexes were computed to 25.0-Å resolution. The resolutions of these maps were estimated to be ∼30 Å because the virus membrane bilayers (32-Å peak-to-peak distance) were clearly distinguishable.
Reconstruction was computed without imposing any symmetry.
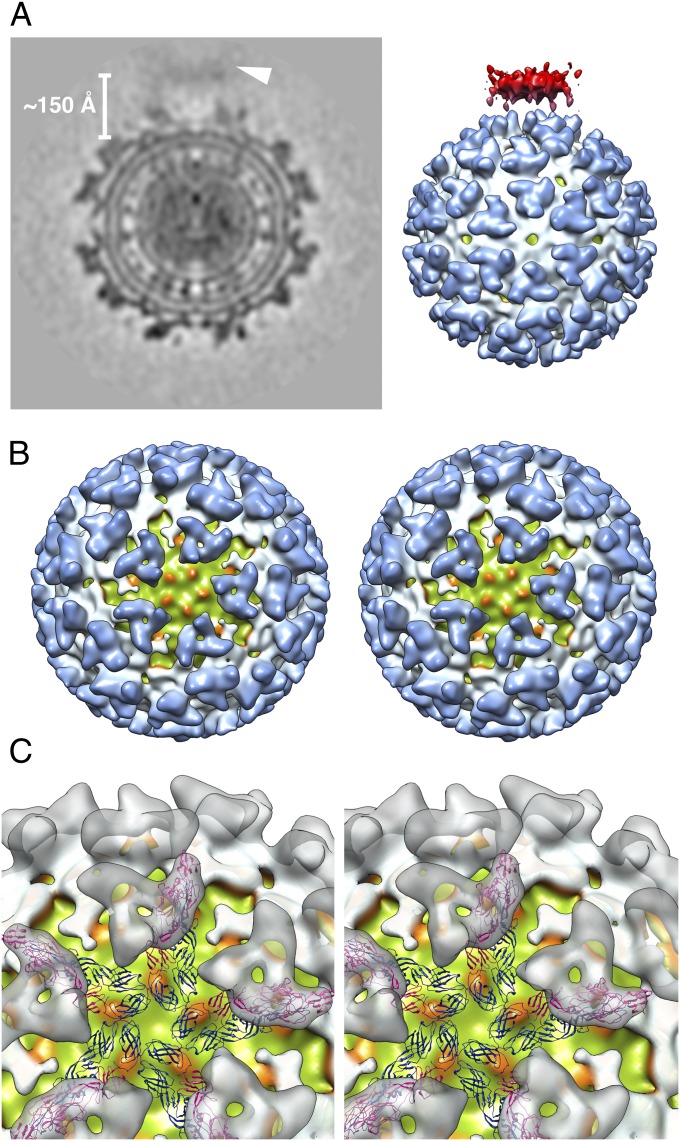
The resulting four reconstruction maps all show the typical surface features of the T = 4 SINV structure and a distinctive target membrane density with a reasonable curvature near the periphery of the virus (Fig. 5A and Fig. S3). The target membrane density, which is located at the expected position (∼150 Å away from the virus membrane), is distinct compared with the background density elsewhere outside the virus. The density distribution of the virus structure is polarized such that the density is relatively weak at the liposome–virus interaction site.
Fig. 5.
Reconstruction of a SINV–liposome complexes when the liposome is associated near the virus icosahedral fivefold axis. (A) Central cross-section (Left) and surface rendering (Right) of the reconstruction map. The target membrane (arrowhead) is ∼150 Å away from the outer leaflet of the viral membrane. The surface-shaded view of the reconstruction map is contoured at the 1σ level. The coloring scheme for the virus components is consistent with Fig. 1A, with the target membrane colored in red. (B) Liposome-binding site on the virus (toward the reader) along the fivefold axis. The reconstruction map was rendered at the 1.5σ contour level. Five bulging densities on the outer membrane leaflet of the virus (green) are colored orange. (C) Enlarged view of the reconstruction map with fitted CHIKV virus E1 (blue) and E2 (magenta) glycoproteins (17). For clarity, the virus spikes are represented as transparent gray surfaces.
All four reconstruction maps (Fig. 5 and Fig. S3) provide evidence that the initial disassembly of the E1 and E2 icosahedral scaffold happens upon interaction with a target membrane at mildly acidic pH (∼6.4). Fig. 5B shows a surface rendering of the virus structure contoured at the 1.5σ level when the virus–liposome interaction occurs near the virus fivefold axis. Consistent with the 2D image analysis, most of the density in the skirt region (E1) near the binding axis disappeared, leaving a large area of membrane exposed, whereas the trimeric spikes (mostly E2) are clearly visible. Notably, there are prominent bulging densities related by the fivefold axis at the surface of the outer membrane leaflet. The E1 densities that bridge between the virus and the target membrane shown in the electron micrographs (Fig. 2A) could not be clearly defined in the reconstruction map at a contour level above the background noise, although weak densities are seen in the cross-section (Fig. 5A and Fig. S3). This could mean that at the membrane interaction site, the E1 molecules do not have consistent interaction orientations relative to the virus surface.
To characterize the remaining E1 and E2 densities at the molecular level, the atomic models of the CHIKV E1 and E2 proteins were placed into the reconstruction (Fig. 5C) based on their fit in the SINV cryo-EM density map (17). The bulging densities on the outer membrane surface are in close proximity to the C terminus of the E1 protein ectodomain (11, 15) and are thus likely contributed by the E1 proteins involved in membrane insertion. The clear separation of the density bulges suggests that at this early stage of virus–membrane interaction, the E1 proteins are still in their monomeric form and have not yet formed trimers. Around the liposome-binding area, the E2 molecule can be well fitted into the electron densities of the central portion of the spikes. The density corresponding to the E2 membrane-proximal region is weaker, suggesting less stability in this region. The capsid proteins also appear less ordered according to the 2D and 3D analyses (Fig. 2D and Figs. S4 and S5). Given the dramatic conformational changes in the E1 ectodomain, the overall integrity of the E2 trimer might play a key role in stabilizing this metastable membrane-binding stage.
Discussion
Our studies demonstrated the conformational changes of SINV when it binds to a target membrane at a mildly acidic pH (∼6.4). In vivo, gradual acidification of the endocytic organelles is primarily regulated by ATP-dependent proton pumps (29), which mediate a drop in pH to ∼6.0–6.5 in the early endosome and to ∼5.0–6.0 in the late endosome (30, 31). Our in vitro experiment mimics the initial interactions between the SINV and the endosomal membrane that occur at a relatively early stage of endosome acidification following endocytic uptake.
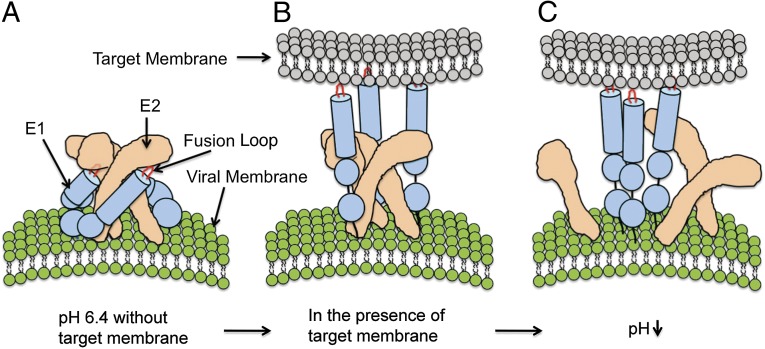
The reconstruction maps of the SINV–liposome complex at pH 6.4 display two different E1 configurations relative to E2: confined E1 that associates with E2 to form a heterodimer and liberated E1 that inserts itself into the target membrane, leaving E2 in its original trimeric structure. The coexistence of these two E1 states in the same virus particle suggests that E1–E2 dissociation and E1 membrane insertion are components of one coupled step. Mildly acidic pH (∼6.4) might induce the E1–E2 heterodimer to assume a metastable fusogenic structure (Fig. 6A), in which E1 may continue to be stabilized by E2 but have its fusion loop transiently exposed. The presence of a target membrane would prompt conversion of E1 from the confined heterodimeric state to the liberated membrane-binding state.
Fig. 6.
Model of the early molecular events during alphavirus membrane fusion. (A) When no target membrane is nearby, the molecular organization of the alphavirus E1 and E2 glycoproteins at pH 6.4 is similar to that at neutral pH. (B) A target membrane prompts dissociation of the E1–E2 heterodimer. The fusion loop of extended E1 inserts itself into the target membrane while the E2 proteins remain in their original trimeric conformation. (C) Upon further reduction in pH, the E2 trimers dissociate, enabling formation of the E1 trimers.
Upon membrane insertion, SINV E1 protein bridging between the virus and the target membrane appears to adopt a flexible and extended structure (Fig. 6B). The average distance between the two membranes is ∼150 Å, a gap longer than the length of the E1 ectodomain at neutral pH (∼120 Å) (32) and the length of its postfusion trimeric structure (∼100 Å) (18). The orientation of the E1 molecule relative to the virus surface is also variable. In the cryo-EM images of virus–liposome complexes, the bridge-like densities between the virus and target membrane were either normal or at a slant relative to the virus surface. This flexibility allows E1 to bind the target membrane at different distances and curvatures. Comparison of the prefusion and postfusion E1 structures suggests that the conformations of the three subdomains of the E1 molecule (DI, DII, and DIII) are essentially unchanged during the fusion process (15, 18). Therefore, the flexibility and extended length of E1 are likely achieved through stretching and twisting of the E1 interdomain regions—i.e., the DI–DIII linker and DI–DII hinge (Fig. S6) (18).
Previous biochemistry and mutagenesis studies indicated that E1 proteins insert themselves into the target membrane as monomers before formation of homotrimers and subsequent membrane fusion (6, 33–35). The cryo-EM reconstruction maps of SINV–liposome complexes at pH 6.4 suggest that after E1–E2 dissociation and insertion of E1 into a target membrane, nearby E2 protein trimers might hinder lateral migration of E1 and thereby impede E1 homotrimerization. The presence of histidines, arginines, and lysines at the E2–E2 interface allows the E2–E2 interactions to weaken as pH drops below the pK of the histidines (∼pH 6.5, variable depending on the local environment) (16). Therefore, the E2 trimers are likely to be disrupted at lower pH, enabling the E2 molecules to move out of the way and E1 molecules to form homotrimers (Fig. 6C). Mutations in the region of the trimeric E2 interface would influence the pH dependence for alphavirus fusion, and the E2–E2 interface would represent a feasible antiviral drug target.
Materials and Methods
Preparation of Viruses and Liposomes.
SINV TE12 was propagated in baby hamster kidney cells (BHK-21) and purified using a sucrose density gradient as previously described (36). The virus was concentrated to ∼1 mg/mL in buffer containing 10 mM Tris⋅HCl (pH 7.4) and 200 mM NaCl. To make liposomes, 1-palmitoyl-2-oleoyl-sn-glycero-3-phosphocholine, 1-palmitoyl-2-oleoyl-sn-glycero-3-phosphoethanolamine, sphingomyelin, and cholesterol (Avanti Polar Lipids) were mixed at a molar ratio of 1:1:1:3 or 1:1:1:1.5, dried, and rehydrated in TNE buffer (10 mM Tris⋅HCl (pH 7.4), 200 mM NaCl, 1 mM EDTA) to a lipid concentration of 1 mg/mL. Liposomes were then prepared by freeze-thawing, sonication, and extrusion through a membrane with 0.05-μm pores. Similar results were obtained using liposomes of both cholesterol concentrations.
Cryoelectron Microscopy.
Samples of SINV–liposome complex were prepared by mixing 3 μL of SINV and 6 μL of liposomes for 10 min on ice, followed by addition of 4 μL of 50 mM MES [2-(N-morpholino)ethanesulfonic acid, pH 6.4] and 200 mM NaCl. As a control, low-pH-treated SINV was prepared similarly, but the liposomes were replaced with the same volume of TNE buffer. After incubation for 30 min on ice, 2.5 μL of the virus-liposome-MES mixture or the low-pH-treated virus sample were loaded onto a glow discharged ultrathin-carbon TEM grid (Ted Pella) in a Vitrobot (FEI Company) and incubated at 37 °C for 2 min before flash freezing in liquid ethane. Electron micrographs were then recorded at a nominal magnification of 59,000× using a FEI Tecnai 300-kV F30 field emission gun transmission electron microscope (FEI Company) at liquid nitrogen temperatures. The images were collected under a low-dose condition (∼25 e−/Å2) and at a defocus range of ∼1.0–4.0 μm using a Gatan 4k by 4k Ultrascan CCD camera (Gatan, Inc.). The images were bin-averaged to 2k by 2k, and each pixel corresponded to a sampling step of 3.951 Å in the specimen.
Image Reconstruction of Low-pH–Treated SINV.
A total of 9,400 low-pH-treated SINV particles was selected for analysis. Because SFV was found to maintain its icosahedral symmetry at pH values above 5.8 (23), an earlier SINV reconstruction map (27) rendered to 25-Å resolution was used as a starting model to determine the orientation and origin of each particle using the polar Fourier transform (PFT) method (37). The orientations and origins were then further refined using PO2R in the AUTO3DEM package (38), and the final icosahedral reconstruction map was computed from 5,670 virus particles using P3DR. The resolution of the final map was determined to be 14.5 Å based on the 0.5 cutoff value of the Fourier shell correlation coefficient when comparing the reconstructions computed from two independent data sets.
Calculating 2D Average Image of SINV–Liposome Complexes and Its Radial Density Profiles.
A total of 1,425 SINV-liposome images showing the signature bridge-like densities was used for the 2D and 3D analyses. The virus center in each SINV–liposome complex was determined using PFT. The point on the target membrane closest to the bound virus particle was visually identified using RobEM (http://cryoem.ucsd.edu/programs.shtm). About 4% of the images showing complexes with the greatest measured distance between the virus and the bound liposome were included for calculating a 2D average image. These images of the SINV–liposome complex were translationally and rotationally aligned so that the centers of the virus particles were superimposed and the identified points on the target membranes were positioned at the 3 o’clock direction. The radial density plots of the 2D average images were calculated using the pixels in two 120 × 512 Å rectangular subareas, starting from the center of the virus and extending to the edge of the image in the 9 o’clock and 3 o’clock directions (Fig. S2).
Three-Dimensional Reconstruction of the Virus–Liposome Complex.
We developed a five-step procedure for producing 3D reconstructions of the SINV–liposome complex (Fig. 4). In step 1, the icosahedral orientation (θ, ϕ, ω) (39, 40) and center of each virus particle were determined using the PFT procedure (37). Sixty quasi-equivalent orientations that produce the same view of an icosahedral particle were then generated. In step 2, the boxed images of the virus–liposome complexes were modified by adding an artificial disk of 240 Å in diameter at the position where the liposomal membrane was closest to the virus. In step 3, four reference models were obtained by placing a 200-Å-diameter sphere at the 5-, 3-, 2-, and q3-fold axes of the icosahedral SINV model. At this point, the sphere was ∼400 Å away from the virus center, according to the earlier 3D analysis (Fig. 3C). Next, projection images of all four models were generated along the 60 quasi-equivalent orientations of each particle. These projection images differed in the positions of the prominent density introduced by the added sphere, providing resolvable features for the subsequent orientation selection process. In step 4, the real-space correlation coefficients (CCs) were calculated between the density-modified complex images and all 240 model projections. Based on the best CC, the complex images were classified into four subgroups, referred to as the 5f, 3f, 2f, and q3f groups in accordance with the respective initial reference models. In step 5, for the images in each subgroup, the orientations found were transformed to (θ2, ϕ2, ω2) so that the resulting reconstruction map had the target membrane aligned on the +z axis of the coordinate system. The final reconstruction maps were then calculated using P3DR, using fivefold, threefold, or twofold symmetry for the 5f, 3f, and 2f groups, respectively. No symmetry was imposed for the q3f group.
Deposition of the Reconstruction Map.
The reconstruction map of SINV–liposome complexes in the 5f group has been deposited in EMDataBank (accession no. EMD-2374).
Supplementary Material
Acknowledgments
W.Z. started working on the project at Purdue University. We are grateful for the support from Drs. Jue Chen, Michael Rossmann, and Richard Kuhn. We thank Drs. Wen Jiang and Qiu-Xing Jiang for valuable suggestions. We also thank Drs. Louis Mansky, Shelley Grimes, and Paul Jardine for helpful discussions and for sharing laboratory equipment. The electron micrographs were collected using a Tecnai TF30 TEM maintained by the Characterization Facility, College of Science and Engineering, University of Minnesota. We also thank Minnesota Supercomputing Institute for providing a computation environment. This work was supported by a grant from the National Institutes of Health (R21AI079473 to W.Z.).
Footnotes
The authors declare no conflict of interest.
This article is a PNAS Direct Submission. Y.C. is a guest editor invited by the Editorial Board.
Data deposition: The reconstruction map of SINV–liposome complexes in the 5f group has been deposited in EMDataBank (accession no. EMD-2374).
This article contains supporting information online at www.pnas.org/lookup/suppl/doi:10.1073/pnas.1301911110/-/DCSupplemental.
References
- 1.Helenius A, Kartenbeck J, Simons K, Fries E. On the entry of Semliki forest virus into BHK-21 cells. J Cell Biol. 1980;84(2):404–420. doi: 10.1083/jcb.84.2.404. [DOI] [PMC free article] [PubMed] [Google Scholar]
- 2.Kielian M. Membrane fusion and the alphavirus life cycle. Adv Virus Res. 1995;45:113–151. doi: 10.1016/s0065-3527(08)60059-7. [DOI] [PubMed] [Google Scholar]
- 3.Sánchez-San Martín C, Liu CY, Kielian M. Dealing with low pH: Entry and exit of alphaviruses and flaviviruses. Trends Microbiol. 2009;17(11):514–521. doi: 10.1016/j.tim.2009.08.002. [DOI] [PMC free article] [PubMed] [Google Scholar]
- 4.Strauss JH, Strauss EG. The alphaviruses: Gene expression, replication, and evolution. Microbiol Rev. 1994;58(3):491–562. doi: 10.1128/mr.58.3.491-562.1994. [DOI] [PMC free article] [PubMed] [Google Scholar]
- 5.Bron R, Wahlberg JM, Garoff H, Wilschut J. Membrane fusion of Semliki Forest virus in a model system: Correlation between fusion kinetics and structural changes in the envelope glycoprotein. EMBO J. 1993;12(2):693–701. doi: 10.1002/j.1460-2075.1993.tb05703.x. [DOI] [PMC free article] [PubMed] [Google Scholar]
- 6.Kielian M, Chanel-Vos C, Liao M. Alphavirus entry and membrane fusion. Viruses. 2010;2(4):796–825. doi: 10.3390/v2040796. [DOI] [PMC free article] [PubMed] [Google Scholar]
- 7.Kielian MC, Helenius A. Role of cholesterol in fusion of Semliki Forest virus with membranes. J Virol. 1984;52(1):281–283. doi: 10.1128/jvi.52.1.281-283.1984. [DOI] [PMC free article] [PubMed] [Google Scholar]
- 8.Smit JM, Bittman R, Wilschut J. Low-pH-dependent fusion of Sindbis virus with receptor-free cholesterol- and sphingolipid-containing liposomes. J Virol. 1999;73(10):8476–8484. doi: 10.1128/jvi.73.10.8476-8484.1999. [DOI] [PMC free article] [PubMed] [Google Scholar]
- 9.White J, Helenius A. pH-dependent fusion between the Semliki Forest virus membrane and liposomes. Proc Natl Acad Sci USA. 1980;77(6):3273–3277. doi: 10.1073/pnas.77.6.3273. [DOI] [PMC free article] [PubMed] [Google Scholar]
- 10.Kostyuchenko VA, et al. The structure of Barmah Forest virus as revealed by cryo-electron microscopy at a 6-angstrom resolution has detailed transmembrane protein architecture and interactions. J Virol. 2011;85(18):9327–9333. doi: 10.1128/JVI.05015-11. [DOI] [PMC free article] [PubMed] [Google Scholar]
- 11.Mancini EJ, Clarke M, Gowen BE, Rutten T, Fuller SD. Cryo-electron microscopy reveals the functional organization of an enveloped virus, Semliki Forest virus. Mol Cell. 2000;5(2):255–266. doi: 10.1016/s1097-2765(00)80421-9. [DOI] [PubMed] [Google Scholar]
- 12.Tang J, et al. Molecular links between the E2 envelope glycoprotein and nucleocapsid core in Sindbis virus. J Mol Biol. 2011;414(3):442–459. doi: 10.1016/j.jmb.2011.09.045. [DOI] [PMC free article] [PubMed] [Google Scholar]
- 13.Zhang R, et al. 4.4 Å cryo-EM structure of an enveloped alphavirus Venezuelan equine encephalitis virus. EMBO J. 2011;30(18):3854–3863. doi: 10.1038/emboj.2011.261. [DOI] [PMC free article] [PubMed] [Google Scholar]
- 14.Pletnev SV, et al. Locations of carbohydrate sites on alphavirus glycoproteins show that E1 forms an icosahedral scaffold. Cell. 2001;105(1):127–136. doi: 10.1016/s0092-8674(01)00302-6. [DOI] [PMC free article] [PubMed] [Google Scholar]
- 15.Lescar J, et al. The Fusion glycoprotein shell of Semliki Forest virus: An icosahedral assembly primed for fusogenic activation at endosomal pH. Cell. 2001;105(1):137–148. doi: 10.1016/s0092-8674(01)00303-8. [DOI] [PubMed] [Google Scholar]
- 16.Li L, Jose J, Xiang Y, Kuhn RJ, Rossmann MG. Structural changes of envelope proteins during alphavirus fusion. Nature. 2010;468(7324):705–708. doi: 10.1038/nature09546. [DOI] [PMC free article] [PubMed] [Google Scholar]
- 17.Voss JE, et al. Glycoprotein organization of Chikungunya virus particles revealed by X-ray crystallography. Nature. 2010;468(7324):709–712. doi: 10.1038/nature09555. [DOI] [PubMed] [Google Scholar]
- 18.Gibbons DL, et al. Conformational change and protein-protein interactions of the fusion protein of Semliki Forest virus. Nature. 2004;427(6972):320–325. doi: 10.1038/nature02239. [DOI] [PubMed] [Google Scholar]
- 19.Kielian M. Structural biology: An alphavirus puzzle solved. Nature. 2010;468(7324):645–646. doi: 10.1038/468645a. [DOI] [PMC free article] [PubMed] [Google Scholar]
- 20.Glomb-Reinmund S, Kielian M. The role of low pH and disulfide shuffling in the entry and fusion of Semliki Forest virus and Sindbis virus. Virology. 1998;248(2):372–381. doi: 10.1006/viro.1998.9275. [DOI] [PubMed] [Google Scholar]
- 21.Smit JM. 2002. The role of N-linked glycosylation of Sindbis virus glycoproteins E2 and E1 in viral infectivity and membrane fusion activity. PhD thesis (Rijksuniversiteit Groningen)
- 22.Fuller SD, Berriman JA, Butcher SJ, Gowen BE. Low pH induces swiveling of the glycoprotein heterodimers in the Semliki Forest virus spike complex. Cell. 1995;81(5):715–725. doi: 10.1016/0092-8674(95)90533-2. [DOI] [PubMed] [Google Scholar]
- 23.Haag L, et al. Acid-induced movements in the glycoprotein shell of an alphavirus turn the spikes into membrane fusion mode. EMBO J. 2002;21(17):4402–4410. doi: 10.1093/emboj/cdf442. [DOI] [PMC free article] [PubMed] [Google Scholar]
- 24.Paredes AM, et al. Conformational changes in Sindbis virions resulting from exposure to low pH and interactions with cells suggest that cell penetration may occur at the cell surface in the absence of membrane fusion. Virology. 2004;324(2):373–386. doi: 10.1016/j.virol.2004.03.046. [DOI] [PubMed] [Google Scholar]
- 25.Wu SR, et al. The dynamic envelope of a fusion class II virus. Prefusion stages of Semliki Forest virus revealed by electron cryomicroscopy. J Biol Chem. 2007;282(9):6752–6762. doi: 10.1074/jbc.M609125200. [DOI] [PubMed] [Google Scholar]
- 26.Bubeck D, Filman DJ, Kuzmin M, Fuller SD, Hogle JM. Post-imaging fiducial markers aid in the orientation determination of complexes with mixed or unknown symmetry. J Struct Biol. 2008;162(3):480–490. doi: 10.1016/j.jsb.2008.03.006. [DOI] [PMC free article] [PubMed] [Google Scholar]
- 27.Zhang W, et al. Placement of the structural proteins in Sindbis virus. J Virol. 2002;76(22):11,645–11,658. doi: 10.1128/JVI.76.22.11645-11658.2002. [DOI] [PMC free article] [PubMed] [Google Scholar]
- 28.Bubeck D, Filman DJ, Hogle JM. Cryo-electron microscopy reconstruction of a poliovirus-receptor-membrane complex. Nat Struct Mol Biol. 2005;12(7):615–618. doi: 10.1038/nsmb955. [DOI] [PMC free article] [PubMed] [Google Scholar]
- 29.Forgac M. Vacuolar ATPases: Rotary proton pumps in physiology and pathophysiology. Nat Rev Mol Cell Biol. 2007;8(11):917–929. doi: 10.1038/nrm2272. [DOI] [PubMed] [Google Scholar]
- 30.Schmid S, Fuchs R, Kielian M, Helenius A, Mellman I. Acidification of endosome subpopulations in wild-type Chinese hamster ovary cells and temperature-sensitive acidification-defective mutants. J Cell Biol. 1989;108(4):1291–1300. doi: 10.1083/jcb.108.4.1291. [DOI] [PMC free article] [PubMed] [Google Scholar]
- 31.Mellman I, Fuchs R, Helenius A. Acidification of the endocytic and exocytic pathways. Annu Rev Biochem. 1986;55:663–700. doi: 10.1146/annurev.bi.55.070186.003311. [DOI] [PubMed] [Google Scholar]
- 32.Roussel A, et al. Structure and interactions at the viral surface of the envelope protein E1 of Semliki Forest virus. Structure. 2006;14(1):75–86. doi: 10.1016/j.str.2005.09.014. [DOI] [PubMed] [Google Scholar]
- 33.Corver J, Bron R, Snippe H, Kraaijeveld C, Wilschut J. Membrane fusion activity of Semliki Forest virus in a liposomal model system: Specific inhibition by Zn2+ ions. Virology. 1997;238(1):14–21. doi: 10.1006/viro.1997.8799. [DOI] [PubMed] [Google Scholar]
- 34.Kielian M, Klimjack MR, Ghosh S, Duffus WA. Mechanisms of mutations inhibiting fusion and infection by Semliki Forest virus. J Cell Biol. 1996;134(4):863–872. doi: 10.1083/jcb.134.4.863. [DOI] [PMC free article] [PubMed] [Google Scholar]
- 35.Liu CY, Kielian M. E1 mutants identify a critical region in the trimer interface of the Semliki forest virus fusion protein. J Virol. 2009;83(21):11,298–11,306. doi: 10.1128/JVI.01147-09. [DOI] [PMC free article] [PubMed] [Google Scholar]
- 36.Zhang W, et al. Aura virus structure suggests that the T=4 organization is a fundamental property of viral structural proteins. J Virol. 2002;76(14):7239–7246. doi: 10.1128/JVI.76.14.7239-7246.2002. [DOI] [PMC free article] [PubMed] [Google Scholar]
- 37.Baker TS, Cheng RH. A model-based approach for determining orientations of biological macromolecules imaged by cryoelectron microscopy. J Struct Biol. 1996;116(1):120–130. doi: 10.1006/jsbi.1996.0020. [DOI] [PubMed] [Google Scholar]
- 38.Yan X, Sinkovits RS, Baker TS. AUTO3DEM—An automated and high throughput program for image reconstruction of icosahedral particles. J Struct Biol. 2007;157(1):73–82. doi: 10.1016/j.jsb.2006.08.007. [DOI] [PMC free article] [PubMed] [Google Scholar]
- 39.Belnap DM, Olson NH, Baker TS. A method for establishing the handedness of biological macromolecules. J Struct Biol. 1997;120(1):44–51. doi: 10.1006/jsbi.1997.3896. [DOI] [PubMed] [Google Scholar]
- 40.Klug A, Finch JT. Structure of viruses of the papilloma-polyoma type. IV. Analysis of tilting experiments in the electron microscope. J Mol Biol. 1968;31(1):1–12. doi: 10.1016/0022-2836(68)90050-8. [DOI] [PubMed] [Google Scholar]
Associated Data
This section collects any data citations, data availability statements, or supplementary materials included in this article.


