

Abstract
Purpose
To investigate whether hypoxia targeted bifunctional suicide gene expression-cytosine deaminase (CD) and uracil phosphoribosyltransferase (UPRT) with 5-FC treatments can enhance radiotherapy.
Material and Methods
Stable transfectant of R3327-AT cells were established which express a triple-fusion-gene: CD, UPRT and monomoric DsRed (mDsRed) controlled by a hypoxia inducible promoter. Hypoxia-induced expression/function of CDUPRTmDsRed was varified by western blot, flow cytometry, fluorescent microscopy, and cytotoxicity assay of 5-FU and 5-FC. Tumor-bearing mice were treated with 5-FC and locally radiation. Tumor volume were monitored and compared with those treated with 5-FC or radiation alone. In addition, the CDUPRTmDsRed distribution in hypoxic regions of tumor sections was visualized with fluorescent microscopy.
Results
Hypoxic induction of CDUPRTmDsRed protein correlated with increased sensitivity to 5-FC and 5-FU. Significant radiosensitization effects were detected after 5-FC treatments under hypoxic conditions. In the tumor xenografts, the distribution of CDUPRTmDsRed expression visualized with fluorescence microscopy was co-localized with the hypoxia marker pimonidazole positive staining cells. Furthermore, administration of 5-FC to mice in combined with local irradiation resulted in significant tumor regression, as comparison with 5-FC or radiation treatments alone.
Conclusions
Our data suggest that the hypoxia-inducible CDUPRT/5-FC gene therapy strategy has the ability to specifically target hypoxic cancer cells and significantly improves the tumor control in combination with radiotherapy.
Keywords: hypoxia, radiosensitization, cytosine deaminase, uracil phosphoribosyltransferase, 5-flurocytosine
Introduction
Hypoxia is a well-documented feature of most solid tumors. Accumulating evidence shows that up to 50-60% of locally advanced solid tumors exhibit heterogeneously distributed hypoxic areas [1]. Clinical studies have shown that local tumor control and overall survival are significantly reduced for hypoxic tumors relative to those of well oxygenated tumors [2-4]. Given its central role in tumour progression and resistance to therapy, tumour hypoxia might be considered a target that can be exploited cancer treatment [5].
The hypoxia-inducible factors (HIF) mediate the primary transcriptional responses to hypoxic stress in normal and tumor cells. HIFs are basic helix-loop-helix–PER–ARNT–SIM (bHLH–PAS) proteins that form heterodimeric complexes that are composed of an oxygen sensitive α-subunit (HIF1α, HIF2α or HIF3α) and a constitutively expressed β-subunit (HIF1β)[6]. Together, these subunits bind hypoxia-responsive elements (HREs) within the enhancer region of target genes that regulate important biological processes including angiogenesis, cell proliferation and survival, glucose metabolism, pH regulation and migration. Through introducing the HRE sequence into an appropriate expression cassette, hypoxia-induced regulation of exogenous therapeutic genes, such as prodrug-activating enzymes can be achieved [7]. Because the therapeutic genes can be induced in the hypoxic tumor microenvironment, but minimally in normal tissue, hypoxia-targeted gene expression with the HRE promoter may be an effective approach to increase efficacy of cancer gene therapy [8].
A well-established gene therapy approach, cytosine deaminase (CD) in combination with prodrug 5-flurocytosine (5-FC), has been examined for hypoxia-driven gene therapy in different tumor models [9-11]. However, the efficacy of CD/5FC strategy is limited by the conversion of 5-FU to its cytotoxic products based on endogenous cellular enzymatic mechanism. In this regard, uracil phosphoriboslytransferase (UPRT) can directly convert 5-FU to fluorouridine monophosphate, the rate-limited step of 5-FU metabolism, and thus significantly enhance cytotoxicity [12]. In a previous study, we demonstrated that the co-expression of CD and UPRT combined with the 5-FC treatment led to a greater radiosensitization and bystander effect than that in cells expressing CD alone [13].
In the present study, we generated a tumor model expressing CDUPRTmDsRed under the control of a hypoxia inducible promoter. Significant radiosensitization effects were demonstrated both in vitro and in vivo with 5-FC treatments. Our data suggest that the hypoxia-inducible CDUPRT/5-FC gene therapy has the ability to specifically target hypoxic cancer cells and significantly improves the tumor control in combination with radiotherapy. This novel model appears to be a valuable tool to study tumor hypoxia, radiation effect and hypoxia-target radio-gene therapy.
Materials and Methods
Plasmid construction
The hypoxia-inducible promoter consisted of an artificial nine tandem repeats of the HRE from human EPO gene and the SV40 minimal promoter (SV40min) [14]. The CDUPRT fusion gene from the SFG retroviral vector [15] was inserted into the plasmid p9HRE-TKeGFP constructed previously [14] by replacing the TKeGFP sequence. The 9HRE-CDUPRT sequences were then PCR from the vector and inserted into the multiple clone site of the vector pDsRed-momomer-Hyg-N1 (Clontech, Mountain View, CA). The resulting plasmid p9HRE-CDUPRTmDsRed contains the CD, UPRT and mDsRed fusion gene under the regulation of the hypoxia-inducible promoter, and a constitutively expressed Hygromycin B-resistance gene (Hygror) (Fig 1A).
Figure 1. Characterization of R3327-9HRE-CDUPRTmDsRed cell lines in vitro.

A. A schematic diagram depicting the 9HRE-CDUPRTmDsRed construct. The vector contains the fusion gene of CD, UPRT and mDsRed, under the regulation of a hypoxia-inducible promoter (nine tandem repeats of the HRE from the enhancer region of the human EPO gene linked to the SV40 minimal promoter), and the SV40-driven hygromycin-resistant gene (Hygror).
B. Western blot analysis of the CDUPRTmDsRed protein (73KDa) expression in aerobic cells and hypoxic cells (0.1% O2 for 12 to 72 hr).
C. Flow cytometric analysis of hypoxia-induced CDUPRTmDsRed expression: dashed curves are for aerobic cells, and solid curves for hypoxic cells (0.1% O2 for 12 to 72 hr).
D. Phase-contrast images (upper panels) and mDsRed fluorescent images (lower panels) of aerobic cells and hypoxic cells (0.1% O2 for 12 to 72 hr).
Cell culture and stable cell lines
R3327-AT rat prostate carcinoma cells were grown as monolayer in Dulbecco’s Modified Eagle medium (DMEM; Mediatech, Herndon, VA) supplemented with 10% fetal bovine serum (Gemini, West Sacramento, CA), 100 U/ml penicillin and 100 μg/ml streptomycin (Gemini). For normoxic culture, cells were incubated in a humidified atmosphere containing 5% CO2; for hypoxic culture, cells were incubated in an In Vivo2 400 Hypoxic workstation (Ruskinn Inc., Cincinnati, OH) with a gas mixture of 0.1% O2, 5% CO2, and 94.9% N2. To establish cell lines stably expressing 9HRE-CDUPRTmDsRed, parental R3327-AT cells were transfected with expressing plasmids described above by Lipofectamine2000 (Invitrogen, Carlsbad, CA) for 24 hr according to the manufacturer’s instructions and subsequently cultured with medium containing Hygromycin B (0.2mg/ml; Roche, Mannheim, Germany) for 3-4 weeks. The drug resistant cells were pooled and subjected to three cycles of fluorescence-activated cell sorting (FACS) [14]. Individual positive colonies were isolated, further identified by flow cytometry and expanded for further experiments.
Western blot
The cells were incubated under normoxic for 48 hr or 0.1% O2 conditions for 12, 24, 48, or 72 hr, and then whole cell extracts were prepared. The CDUPRTmDsRed protein was detected with the sheep anti-yCD polyclonal antibody (Biotrend, Cologne, Germany) [16].
Flow cytometry
The cells were incubated under the aerobic condition for 48 hr or 0.1% O2 condition for 12, 24, 48 or 72 hr. The cells were then trypsinized, centrifuged and resuspended in PBS at 4°C. The mDsRed fluorescence was measured by the cell sorter (Moflo) and analyzed with the Flowjo program (Tree Star Inc, Ashland, OR).
Fluorescence microscopy
The cells were incubated under the aerobic condition for 48 hr or 0.1% O2 condition for 12, 24, 48 or 72 hr. The cells were then fixed with fresh made 4% paraformaldehyde for 10 min and washed twice with PBS. The fluorescent images were acquired with a fluorescence microscope (Axiovert 200M, Zeiss) equipped with a filter (575 ± 50 nm wavelength) for mDsRed fluorescence.
Colony formation assay
The cells were treated with 5-FC or 5-FU (InvivoGen, San Diego, CA) at various concentrations under normoxic or 0.1% O2 conditions for 24 or 48 hr. After the drug treatment, cells were trypsinized, counted, serially diluted, and plated into 60 mm dishes. Clonogenic survival was determined by counting crystal violet-stained colonies 10-14 days afterwards. The survival fraction was normalized to the cell survival without drug treatments and plotted as a function of the drug concentration.
Radiation survival assay
The HRE-CDUPRTmDsRed cells were treated with 5-FC at 0, 5 or 100 μg/ml under aerobic or 0, 5μg/ml under 0.1% O2 conditions for 48 hr, and then irradiated for various doses using a Cs-137 unit (Mark 1 model 68, Shephard and Associate, San Fernando CA) at ~2.0Gy/min. Clonogenic survival was then determined by colony formation assay. The radiation survival fractions were normalized for plating efficiency using non-irradiated cells with or without 5-FC treatment under the same conditions and plotted as a function of radiation doses.
Xenograft model
Animal protocols were approved by the Institutional Animal Care and Use Committee at Memorial Sloan-Kettering Cancer Center. Xenografts were formed by injecting 3×10⁶ cells subcutaneously into the hind legs of 6-8 week old nude mice (athymic nu/nu; NCI Frederick Cancer Research Institute, Frederick, MD). When the xenografts reached ~ 12mm in diameter, the mice were injected i.v. with the hypoxia marker pimonidazole (80 mg/kg; HPI, MA). Two hours later, blood perfusion marker Hoechst 33342 (25 mg/kg; Sigma-Aldrich) was i.v injected, and one minute later, the mice were sacrified. Another group of mice with xenografts at ~ 10mm in diameter were breathed 10% oxygen and 90% nitrogen for 30 hr in a custom-made, sealed-environmental chamber (VetEquip) [14]. Pimonidazole and Hoechst 33342 were injected as described above. Immediately after animal sacrifice, tumors were excised and snap frozen in O.C.T. mounting medium (Sakura Finetek, Torrance, CA). Forzen sections of 8-μm thickness were prepared for the immunohistochemical analysis.
Tumor growth delay
Each tumor was measured with digital caliper in three orthogonal dimensions (a, b, and c), and tumor volume was calculated as πabc/6. When the tumor grew to approximately 150–200mm3, the mice were divided into four groups and treated with: (1) PBS, (2) 5-FC (i.p. 500 mg/kg), (3) radiation (3Gy), (4) 5-FC (i.p. 500 mg/kg) with radiation (3Gy, 2 hr after 5-FC treatments), respectively. The treatments were applied daily for seven days. The tumor volume was measured three times a week until the average volume exceeded 1000 mm3. The tumor volume relative to the volume at the beginning of treatments was calculated and plotted as a function of time after treatments. Six animals per group were used for tumor growth delay. Additional four mice in each group were sacrificed at 24 hr after the last treatment. Pimonidazole and Hoechst 33342 were injected as described above. Tumors were excised, snap frozen and cut into 8-μm thick sections for the immunohistochemical analysis.
Immunohistochemical staining and fluorescent microscopic imaging
Tumor sections were first imaged for the mDsRed and Hoechst 33342 fluorescence. Then, the sections were stained for pimonidazole using FITC-conjugated murine anti-pimonidazole monoclonal antibody [17]. The cell proliferation was detected by immunohistochemical staining with the anti-Ki-67 primary antibodies according to the manufacturer’s instructions (Cell Signaling Technology, Danvers, MA). Finally the sections were stained with hematoxyline-osin with the standard protocol. Fluorescence images were acquired at 50X magnification using a fluorescence microscope (Axiovert 200 M; Zeiss) equipped with a CCD digital camera, a computer-controlled motorized stage and Metamorph 7.0 Imaging software (Molecular Devices, CA).
Statistical analysis
Data points are presented as averages with mean standard error (±SE). Differences in cytotoxicity and radiosensitivity were determined using the Student’s t test. The differences in tumor growth delay was analyzed using 1-way ANOVA. A P value of <0.01 was considered statistically significant.
Results
Hypoxia-induced expression of CDUPRTmDsRed fusion protein
We constructed a vector encoding the CDUPRTmDsRed under the control of the 9HRE-SV40min promoters (Fig. 1A). In stable cell lines transfected with the designed plasmid, the hypoxia-induced CDUPRTmDsRed expression were examined with western blotting (Fig. 1B), flow cytometric analysis (Fig. 1C) and fluorescent microscopic imaging (Fig. 1D). The time course of hypoxia-induced CDUPRTmDsRed expression, measured in HRE cells incubated in 0.1% O2 for up to 72 hr (Fig. 1B), show steady increase unto 48 hr. In contrast, there was only a trace amount of CDUPRTmDsRed protein in aerobic cells. Flow cytometric (Fig. 1C) and fluorescence microscopic analysis (Fig. 1D) yielded similar results on the time-dependence of hypoxia-induced mDsRed fluorescence. The highest level of induction, at 48 hr after the hypoxic exposure, amounted to a 10-fold increase in mDsRed fluorescence (Fig. 1C).
Hypoxia-induced CDUPRT expression sensitizes cells to 5-FC and 5-FU
The surviving fractions of cells exposed to various concentrations of 5-FC or 5-FU under normoxic or hypoxic conditions for 24 or 48 hr, based on the colony formation assay, are shown in Figure 2. Whereas the aerobic cells are not sensitive to 5-FC, the survival of hypoxic cells decreased in a dose- and time-dependent manner, with lower cell survival for 48 hr treatment (Fig. 2B) than for 24 hr treatment (Fig. 2A). 5-FU treatment was toxic to both aerobic and hypoxic cells (Fig. 2C-D). Because of the hypoxia-driven expression of UPRT, the hypoxic cells were more sensitive to 5-FU than the aerobic cells, with higher cytoxicity for a longer treatment. Another method, MTT assay, was used to further assess hypoxia-induced CDUPRT function. As shown, in Supplementary Fig. 1A and 1B, cell growth under hypoxic conditions was significantly inhibited by 5-FC () or 5-FU, relative to that under normoxic conditions (Supplementary Fig. 1C and 1D).
Figure 2. 5-FC and 5-FU cytotoxicity in vitro.

HRE-CDUPRT cells treated at various concentration of 5-FC (A, B) or 5-FU (C, D) under 0.1% O2 (open symbols) or aerobic conditions (solid symbols) for 24 or 48 hr. Cell survival were determined using colony formation assay. The error bars are the standard errors from three independent experiments.
Hypoxia-driven CDUPRT expression and 5-FC treatment sensitizes cells to radiation
Data on the effect of 48 hr 5-FC treatments on the radiation response of aerobic and hypoxia HRE cells are presented in Figure 3. 5-FC had little radiosensitizing effect in aerobic HRE cells even at 100 μg/ml (Fig. 3A). However, 5-FC treatments at 5 μg/ml did enhance the radiosensitivity of hypoxic HRE-CDUPRTmDsRed cells (Fig. 3B).
Figure 3. Radiosensitizing effects in vitro.
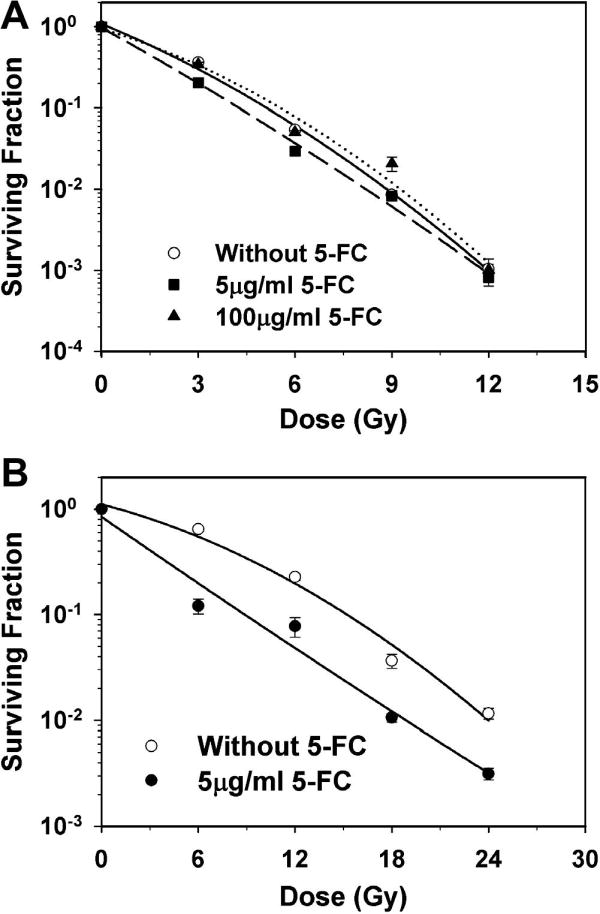
Surviving fractions were determined for aerobic (A) and hypoxic (B) HRE-CDUPRT cells treated with graded radiation doses, with and without 5-FC treatments.
Hypoxia-induced gene expression in vivo
To examine hypoxia-induced gene expression in vivo, HRE-CDUPRTmDsRed cells were transplanted into nude mice. Combined and merged fluorescence microscopic images of frozen tumor sections clearly showed that the distribution of hypoxia-induced mDsRed signal (red, Fig. 4A and 4C) was similar to that of the exogenous hypoxia marker pimonidazole (green, Fig. 4B and 4C) Neither mDsRed nor pimonidazole co-localized with the perfusion marker-Hoechst 33342 (blue, Fig. 4A~C). Another group of mice bearing smaller xenografts were kept in a chamber containing 10% oxygen for 30 hr before sacrifice to increase tumor hypoxia. In tumor sections from these animals, intensive mDsRed signal was observed, being co-localized with pimonidazole and away from the perfused vasculature (Fig. 4G~I). The intensity of mDsRed and pimonidazole signal in these tumors was increased in comparison of mice breathing air (Fig. D~F). The magnified view (Fig. 4J-L) of the region marked as rectangle in Figure 4G~I clearly showed that the mDsRed fluorescence (CDUPRTmDsRed protein) was specifically expressed in hypoxic cells as identified by pimonidazole staining.
Figure 4. Hypoxia-induced gene expression in vivo.

Fluorescence images were shown as mDsRed (red, left panels) and pimonidazole (green, middle panels), overlayed with Hoechst 33342 (blue). A~C (larger tumor) and D~F (smaller tumor) are from mice breathing air and G~I (smaller tumor) from mice breathing 10% O2, respectively. J~L are magnified view of the region marked as rectangle in the G~I.
Radiation combined with 5-FC treatments delayed the tumor growth
As shown in Figure 5A and 5B, 5-FC treatments (500 mg/kg i.p. per day for 7 days) by itself, or radiation (3Gy/fraction per day for 7 days) alone, slightly delayed the tumor growth. However, 5-FC treatments combined with irradiation showed significant tumor growth delay (P<0.01). Another four tumors from each group were resected at 24 hrs after the last treatment and stained with anti-Ki67 antibody. Tumors treated with 5-FC plus radiation were negative for Ki67, whereras the control, 5-FC alone and radiation alone groups were positive (Fig. 5C). The proliferation index (Ki-67 positive) in 5-FC plus radiation groups (1.35±0.25%) and radiation alone group (7.33±0.60%) was much lower than that of the control group (18.39±1.82%) and the 5-FC alone group (15.61±2.19%), P<0.01 (Fig. 5D).
Figure 5. Tumor control effects of HRE-CDUPRT/5-FC approach.

A. Tumor volume as a function of time after treatment with 7 daily doses of 5-FC (green circles), radiation (blue rectangles) or 5-FC plus radiation (red triangles). The error bars are SE from six tumors.
B. Tumor growth delay relative to the controlled group was compared among groups. ##:P < 0.01 compared with 5-FC alone; **: P < 0.01 compared with radiation alone (1-way ANOVA). Error bars represent the SE of six mice.
C. Ki-67 staining of control or tumors treated with 5-FC, radiation, and 5-FC plus radiation, respectively.
D. Proliferation index (Ki-67 positive ratio) was compared among four groups. #, $, &: P < 0.01 compared with control, 5-FC, and radiation alone, respectively (1-way ANOVA). Error bars represent the SE of 40 magnified fields (10 fields/tumor).
The distributions of CDUPRTmDsRed, pimonidazole and Hoechst 33342 compared, both incontrol and irradiated tumors. In control tumors, the distributions of mDsRed and pimonidazole were almost identical (Supplementary Fig. 2A~D). However, in irradiated tumors there was significant mismatch of mDsRed expression and pimonidazole staining (compare Supplementary Fig. 2F and 2E). In irradiation tumors, the expression of mDsRed was not restricted to hypoxic cells labeled with pimonidazole, and also detected in well-perfused region (Supplementary Fig. 2H, the overlap of mDsRed and Hoechst 33342). Quantative analysis of these fluorescent images showed that, following radiation treatment, there was an ~ 12-fold increase in the expression of mDsRed in the well-perfused area (P<0.01), whereras Hoechest 33342 positive region was decreased (P<0.01), as shown in supplementary Fig 3A and 3B, respectively.
Discussion
There have been extensive efforts to develop biological approaches relative to tumor hypoxia. In comparison to other tumor-specific transcription factor, the oxygen-sensing pathway through HIF has been demonstrated to be universally functional in mammalian cells and present in 70% of solid tumors. It makes HRE-regulated gene therapy an attractive strategy that can be applied to a wide range of cancers.
There have been a number of studies demonstrating the potential of hypoxia/HRE-regulated gene therapy for cancer. Investigators have employed HSV1-TK [8, 18], bacterial nitroreductase [19], pro-apoptotic protein Bax [20], bacterial CD [9, 11, 21] and yeast CD [10, 22] for hypoxia-regulated cancer gene therapy. To explore the possibility of the hypoxia-targeted bifunctional suicide gene therapy strategy, we designed and constructed the vector carrying CDUPRT fused with mDsRed driven by 9HRE-SV40 promoter. R3327-AT cell lines stably transfected with this hypoxia-inducible vectors were established. Hypoxic induction of CDUPRTmDsRed protein (Fig.1) led to increased sensitivity to 5-FC and 5-FU (Fig.2 and Supplementary Fig.1). At the same time, significant radiosensitizing effects were detected in vitro after 5-FC treatments in the hypoxia condition (Fig.3). More importantly, administration of 5-FC to the tumor-bearing mice in combination with localized irradiation resulted in significant tumor growth delay, as comparison with 5-FC or radiation treatments alone (Fig.5). These results clearly demonstrated the potential of hypoxia-targeted radio-gene therapy with HRE-CDUPRT/5-FC approach.
There are multiple factors that may impact the efficacy of hypoxia-mediated gene therapy. Firstly, large tumors or those with high hypoxia fraction would be the ideal targets for hypoxia-mediated suicide gene therapy. However, even in well-perfused tumors, such as the R3327-AT model used in the present study, the combined use of radiotherapy and hypoxia-mediated CDUPRT/5-FC treatment resulted in significant tumor growth delay. This is likely due to the radiosensitizing and bystander effects of hypoxia-mediated CDUPRT/5-FC treatment [13]. Secondly, HIF activity in tumors depends on availability of the HIF-1α/2α subunits, the levels of which increase under hypoxic conditions and through activation of oncogenes and/or inactivation of tumor suppressor genes (such as p53). Normal tissues, such as liver, spleen, and lung, are well oxygenated and carry wild-type p53. These differences between tumor and normal cells suggest that hypoxia-mediated CDUPRT expression (or of other suicide genes) may have positive therapeutic ratio [21]. Thirdly, the effect of hypoxia-mediated gene therapy likely depends on the oxygen level within the tumor, with the highest impact on the most hypoxic cells. Also, its effect will depend on the type of tumor hypoxia, whether chronic or acute.
An important characteristic of our tumor model is that the treatment and its efficacy are “imagable”. It has been demonstrated that the expression/function of CD and UPRT can be detected non-invasively with 19F magnetic resonance spectroscopy [15, 16]. At the same time, as CDUPRT is fused with mDsRed and under control of HRE, HIF activity can be monitored. In our xenograft model, intense red fluorescence signal are visualized in frozen tumor sections, and spatially correlated with the hypoxic cell marker pimonidazole (Fig. 4). Thus our model provides a valuable tool for the study of tumor hypoxia and hypoxia targeted radio-gene therapy. As shown in supplementary Fig. 2 and 3, mDsRed expression increased in irradiation tumors relative to that of controlled tumors. This result is similar to that of Moeller et al, who showed using a HRE-GFP tumor model that the majority of HRE signaling in irradiated tumors occurred in tissues with relatively high oxygenation levels [23]. It was suggested that post-radiation tumor reoxygenation led to nuclear accumulation of HIF-1, and enhanced translation of HIF-1 regulated transcripts secondary to stress granule depolymerization [23]. This has the implication that, when hypoxia-targeted suicide gene therapy is combined with radiation, the hypoxia-driven prodrug activation enzyme, e.g. CDUPRT, would be upregulated with reoxygenation after radiation, leading to cytotoxicity and radiosensitization with 5-FC treatment.
The use of rat tumor cells may be a limitation of the present study, although we have use such R3327-AT cells successfully as a model for human prostate cancer in previous studies on the topics of tumor hypoxia and hypoxia-targeted gene imaging [24, 25]. For more direct translation, future studies using human cancer cell models may be warranted.
In summary, our data suggest that the hypoxia-inducible CDUPRT/5-FC gene therapy has the ability to specifically target hypoxic cancer cells and significantly improves the tumor control in combination with radiotherapy. This novel model is an valuable tool to study tumor hypoxia, radiation effect and hypoxia-target radio-gene therapy.
Supplementary Material
HRE-CDUPRT cells were exposed to various concentration of 5-FC (A, B) or 5-FU (C, D) under hypoxic (open symbols) or aerobic (solid symbols) conditions for 24 or 48 hr. The cell viability was determined with the MTT assay. The viability ratios were normalized to that without drug treatments and plotted as the function of the drug concentration. SEs are from three independent experiments.
Fluorescent images were acquired for mDsRed (red), pimonidazole staining (green) and Hoechst 33342 (blue) signals. Representative images were shown for the tumors from the control group (A~D) and radiation alone group (E~H).
The mDsRed positive area (%) (A) and Hoechst 33342 positive area (%) (B) were quantified using Image J software from 1×1 mm region with high perfused (Hoechst >75% positive), median perfused (Hoechst 25~75% positive) and low perfused (Hoechst <25% positive). ***: P<0.01 (Student t test). Error bars represent the SE from 20 regions for each group (5 regions/tumor).
Acknowledgments
This work was supported in part by grants from National Institutes of Health (PO1 CA115675, RO1 CA56909, and R33 CA109772). This publication also acknowledges NCI grant P30-CA 08748, which provides partial support for the Research Animal Resource Center, Animal Imaging, Molecular Cytology and Flow Cytometry core facilities at MSKCC in conducting this investigation.
Footnotes
Conflict of Interest Statement
There is no conflict of interest to be disclosed.
Publisher's Disclaimer: This is a PDF file of an unedited manuscript that has been accepted for publication. As a service to our customers we are providing this early version of the manuscript. The manuscript will undergo copyediting, typesetting, and review of the resulting proof before it is published in its final citable form. Please note that during the production process errors may be discovered which could affect the content, and all legal disclaimers that apply to the journal pertain.
References
- 1.Tatum JL, Kelloff GJ, Gillies RJ, et al. Hypoxia: importance in tumor biology, noninvasive measurement by imaging, and value of its measurement in the management of cancer therapy. Int J Radiat Biol. 2006;82:699–757. doi: 10.1080/09553000601002324. [DOI] [PubMed] [Google Scholar]
- 2.Fyles A, Milosevic M, Hedley D, et al. Tumor hypoxia has independent predictor impact only in patients with node-negative cervix cancer. J Clin Oncol. 2002;20:680–687. doi: 10.1200/JCO.2002.20.3.680. [DOI] [PubMed] [Google Scholar]
- 3.Nordsmark M, Bentzen SM, Rudat V, et al. Prognostic value of tumor oxygenation in 397 head and neck tumors after primary radiation therapy. An international multi-center study. Radiother Oncol. 2005;77:18–24. doi: 10.1016/j.radonc.2005.06.038. [DOI] [PubMed] [Google Scholar]
- 4.Koukourakis MI, Bentzen SM, Giatromanolaki A, et al. Endogenous markers of two separate hypoxia response pathways (hypoxia inducible factor 2 alpha and carbonic anhydrase 9) are associated with radiotherapy failure in head and neck cancer patients recruited in the CHART randomized trial. J Clin Oncol. 2006;24:727–735. doi: 10.1200/JCO.2005.02.7474. [DOI] [PubMed] [Google Scholar]
- 5.Wilson WR, Hay MP. Targeting hypoxia in cancer therapy. Nat Rev Cancer. 2011;11:393–410. doi: 10.1038/nrc3064. [DOI] [PubMed] [Google Scholar]
- 6.Keith B, Johnson RS, Simon MC. HIF1alpha and HIF2alpha: sibling rivalry in hypoxic tumour growth and progression. Nat Rev Cancer. 2012;12:9–22. doi: 10.1038/nrc3183. [DOI] [PMC free article] [PubMed] [Google Scholar]
- 7.Marignol L, Lawler M, Coffey M, Hollywood D. Achieving hypoxia-inducible gene expression in tumors. Cancer Biol Ther. 2005;4:359–364. doi: 10.4161/cbt.4.4.1646. [DOI] [PubMed] [Google Scholar]
- 8.Binley K, Askham Z, Martin L, et al. Hypoxia-mediated tumour targeting. Gene Ther. 2003;10:540–549. doi: 10.1038/sj.gt.3301944. [DOI] [PubMed] [Google Scholar]
- 9.Liu J, Harada H, Ogura M, Shibata T, Hiraoka M. Adenovirus-mediated hypoxia-targeting cytosine deaminase gene therapy enhances radiotherapy in tumour xenografts. Br J Cancer. 2007;96:1871–1878. doi: 10.1038/sj.bjc.6603812. [DOI] [PMC free article] [PubMed] [Google Scholar]
- 10.Wang D, Ruan H, Hu L, et al. Development of a hypoxia-inducible cytosine deaminase expression vector for gene-directed prodrug cancer therapy. Cancer Gene Ther. 2005;12:276–283. doi: 10.1038/sj.cgt.7700748. [DOI] [PubMed] [Google Scholar]
- 11.Marignol L, Foley R, Southgate TD, Coffey M, Hollywood D, Lawler M. Hypoxia response element-driven cytosine deaminase/5-fluorocytosine gene therapy system: a highly effective approach to overcome the dynamics of tumour hypoxia and enhance the radiosensitivity of prostate cancer cells in vitro. J Gene Med. 2009;11:169–179. doi: 10.1002/jgm.1281. [DOI] [PubMed] [Google Scholar]
- 12.Erbs P, Regulier E, Kintz J, et al. In vivo cancer gene therapy by adenovirus-mediated transfer of a bifunctional yeast cytosine deaminase/uracil phosphoribosyltransferase fusion gene. Cancer Res. 2000;60:3813–3822. [PubMed] [Google Scholar]
- 13.Xing L, Sun X, Deng X, et al. Expression of the bifunctional suicide gene CDUPRT increases radiosensitization and bystander effect of 5-FC in prostate cancer cells. Radiother Oncol. 2009;92:345–352. doi: 10.1016/j.radonc.2009.04.003. [DOI] [PMC free article] [PubMed] [Google Scholar]
- 14.He F, Deng X, Wen B, et al. Noninvasive molecular imaging of hypoxia in human xenografts: comparing hypoxia-induced gene expression with endogenous and exogenous hypoxia markers. Cancer Res. 2008;68:8597–8606. doi: 10.1158/0008-5472.CAN-08-0677. [DOI] [PMC free article] [PubMed] [Google Scholar]
- 15.Gade TP, Koutcher JA, Spees WM, et al. Imaging transgene activity in vivo. Cancer Res. 2008;68:2878–2884. doi: 10.1158/0008-5472.CAN-07-6028. [DOI] [PMC free article] [PubMed] [Google Scholar]
- 16.Xing L, Deng X, Kotedia K, et al. Non-invasive molecular and functional imaging of cytosine deaminase and uracil phosphoribosyltransferase fused with red fluorescence protein. Acta Oncol. 2008;47:1211–1220. doi: 10.1080/02841860802256475. [DOI] [PMC free article] [PubMed] [Google Scholar]
- 17.Sun X, Li XF, Russell J, et al. Changes in tumor hypoxia induced by mild temperature hyperthermia as assessed by dual-tracer immunohistochemistry. Radiother Oncol. 2008;88:269–276. doi: 10.1016/j.radonc.2008.05.015. [DOI] [PMC free article] [PubMed] [Google Scholar]
- 18.Koshikawa N, Takenaga K, Tagawa M, Sakiyama S. Therapeutic efficacy of the suicide gene driven by the promoter of vascular endothelial growth factor gene against hypoxic tumor cells. Cancer Res. 2000;60:2936–2941. [PubMed] [Google Scholar]
- 19.Shibata T, Giaccia AJ, Brown JM. Hypoxia-inducible regulation of a prodrug-activating enzyme for tumor-specific gene therapy. Neoplasia. 2002;4:40–48. doi: 10.1038/sj.neo.7900189. [DOI] [PMC free article] [PubMed] [Google Scholar]
- 20.Ruan H, Wang J, Hu L, Lin CS, Lamborn KR, Deen DF. Killing of brain tumor cells by hypoxia-responsive element mediated expression of BAX. Neoplasia. 1999;1:431–437. doi: 10.1038/sj.neo.7900059. [DOI] [PMC free article] [PubMed] [Google Scholar]
- 21.Lee CH, Wu CL, Shiau AL. Hypoxia-induced cytosine deaminase gene expression for cancer therapy. Hum Gene Ther. 2007;18:27–38. doi: 10.1089/hum.2005.239. [DOI] [PubMed] [Google Scholar]
- 22.Chen JK, Hu LJ, Wang D, Lamborn KR, Deen DF. Cytosine deaminase/5-fluorocytosine exposure induces bystander and radiosensitization effects in hypoxic glioblastoma cells in vitro. Int J Radiat Oncol Biol Phys. 2007;67:1538–1547. doi: 10.1016/j.ijrobp.2006.12.020. [DOI] [PubMed] [Google Scholar]
- 23.Moeller BJ, Cao Y, Li CY, Dewhirst MW. Radiation activates HIF-1 to regulate vascular radiosensitivity in tumors: role of reoxygenation, free radicals, and stress granules. Cancer Cell. 2004;5:429–441. doi: 10.1016/s1535-6108(04)00115-1. [DOI] [PubMed] [Google Scholar]
- 24.Wen B, Burgman P, Zanzonico P, et al. A preclinical model for noninvasive imaging of hypoxia-induced gene expression; comparison with an exogenous marker of tumor hypoxia. Eur J Nucl Med Mol Imaging. 2004;31:1530–1538. doi: 10.1007/s00259-004-1673-z. [DOI] [PubMed] [Google Scholar]
- 25.Cho H, Ackerstaff E, Carlin S, et al. Noninvasive multimodality imaging of the tumor microenvironment: registered dynamic magnetic resonance imaging and positron emission tomography studies of a preclinical tumor model of tumor hypoxia. Neoplasia. 2009;11:247–259. doi: 10.1593/neo.81360. [DOI] [PMC free article] [PubMed] [Google Scholar]
Associated Data
This section collects any data citations, data availability statements, or supplementary materials included in this article.
Supplementary Materials
HRE-CDUPRT cells were exposed to various concentration of 5-FC (A, B) or 5-FU (C, D) under hypoxic (open symbols) or aerobic (solid symbols) conditions for 24 or 48 hr. The cell viability was determined with the MTT assay. The viability ratios were normalized to that without drug treatments and plotted as the function of the drug concentration. SEs are from three independent experiments.
Fluorescent images were acquired for mDsRed (red), pimonidazole staining (green) and Hoechst 33342 (blue) signals. Representative images were shown for the tumors from the control group (A~D) and radiation alone group (E~H).
The mDsRed positive area (%) (A) and Hoechst 33342 positive area (%) (B) were quantified using Image J software from 1×1 mm region with high perfused (Hoechst >75% positive), median perfused (Hoechst 25~75% positive) and low perfused (Hoechst <25% positive). ***: P<0.01 (Student t test). Error bars represent the SE from 20 regions for each group (5 regions/tumor).