

Abstract
Hepatocellular carcinoma (HCC) is one of the most common malignancies worldwide. Accurate diagnosis and assessment of disease extent are crucial for proper management of patients with HCC. Imaging plays a crucial role in early detection, accurate staging, and the planning of management strategies. A variety of imaging modalities are currently used in evaluating patients with suspected HCC; these include ultrasound, computed tomography (CT), magnetic resonance imaging (MRI), nuclear medicine, and angiography. Among these modalities, dynamic MRI and CT are regarded as the best imaging techniques available for the noninvasive diagnosis of HCC. Recent improvements in CT and MRI technology have made noninvasive and reliable diagnostic assessment of hepatocellular nodules possible in the cirrhotic liver, and biopsy is frequently not required prior to treatment. Until now, the major challenge for radiologists in imaging cirrhosis has been the characterization of small cirrhotic nodules smaller than 2 cm in diameter. Further technological advancement will undoubtedly have a major impact on liver tumor imaging. The increased speed of data acquisition in CT and MRI has allowed improvements in both spatial and temporal resolution, which have made possible a more precise evaluation of the hemodynamics of liver nodules. Furthermore, the development of new, tissue-specific contrast agents such as gadoxetic acid has improved HCC detection on MRI. In this review, we discuss the role of CT and MRI in the diagnosis and staging of HCC, recent technological advances, and the strengths and limitations of these imaging modalities.
Key Words: Contrast media, CT, Diagnosis, Hepatocellular carcinoma, MR imaging
Introduction
Early detection of hepatocellular carcinoma (HCC) is important, because the most effective treatment for HCC is surgical resection or local ablation therapy when the tumor is small [1]. The imaging criteria of HCC are usually based on the vascular findings of HCC (e.g., arterial enhancement followed by washout in the portal venous and equilibrium phases) [2, 3, 4]. Understanding the hemodynamics of HCC is important for precise imaging diagnosis and treatment because there is a good correlation between hemodynamics and pathophysiology. As multistep carcinogenesis progresses from regeneration to HCC, increased arterial neovascularization combined with decreased portal blood flow are the key changes occurring within the nodules, and these features have been reported by some investigators with computed tomography (CT) during hepatic arteriography (CTHA) and CT during arterial portography (CTAP) [5, 6]. The results of previous studies using CTAP and CTHA indicated that, during the early stage of hepatocarcinogenesis, the intranodular portal supply relative to the surrounding liver parenchyma decreases, whereas the intranodular arterial supply first decreases and then increases in parallel with increasing grade of malignancy of the nodules [7]. Furthermore, according to a recent study using CTAP and CTHA, the main drainage vessels of hepatocellular nodules change from hepatic veins to hepatic sinusoids and then to portal veins during multistep hepatocarcinogenesis, mainly as a result of disappearance of the hepatic veins from the nodules [8].
Recent progress in noninvasive imaging technologies include various techniques of harmonic ultrasound (US) imaging with new US contrast agents, and rapid high-quality multidetector row (MD) CT and MR techniques with new cell-specific contrast agents. As imaging modalities evolve, so do the potential benefits: for example, volumetric three-dimensional (3D) US could increase diagnostic accuracy by enabling a high signal-to-noise ratio, and contrast-enhanced (Sonazoid or Sonovue) US may improve vascularity assessment [9]. CT imaging has developed from two-dimensional (2D) imaging to 3D imaging, and recently, with the addition of the time axis to 3D imaging, so-called four-dimensional imaging has become possible [10]. Recently introduced 320-detector MDCT increases scan coverage. The advantages of MDCT are shorter scan times, thinner sections, and longer scan ranges. These CT machines are at least 5 times faster than those available in 2004, 20 times faster than those available in 2002, and 320 times faster than those available in 1991. Therefore, this kind of machine enables better detection of hypervascular HCC with excellent functionality, including double arterial-phase images and isotropic volume imaging. In addition, dual-energy CT could have potential clinical application in noncontrast imaging, including the assessment of liver for iron and fat content and the presence of biliary stones, whereas perfusion CT could differentiate diverse tumor tissues, although the radiation dosage incurred (10–20 mSv) is likely to limit its applicability [9]. Recent technical progress in liver magnetic resonance imaging (MRI) includes parallel-acquisition imaging (a powerful gradient system with increased speed), a new 3D gradient-echo sequence with increased resolution, 3-Tesla MRI, and phased-array coil MRI with increased signal-to-noise ratios. In addition, new contrast agents and elastography are now being developed to increase the effectiveness of detection and characterization of tumors [3, 11]. Furthermore, research into functional imaging such as perfusion imaging with CT or MRI, diffusion-weighted imaging (DWI), and elastography is making progress [12, 13, 14, 15, 16]. These techniques seem to have strong potential to improve detection and characterization of HCC [17, 18].
In this review, the techniques of new imaging methods will be described; these methods include low-tube-voltage CT scanning, dual-energy CT, perfusion imaging [such as perfusion CT or dynamic contrast-enhanced (DCE) MRI], elastography techniques, and recent MRI techniques with new contrast agents for detecting and diagnosing HCC.
What Are the Challenges in Imaging Diagnosis of HCC?
Although dynamic imaging techniques such as dynamic CT or dynamic MR are recommended for diagnosis of HCC, such dynamic techniques with extracellular contrast agents have a number of diagnostic limitations related largely to tumor size [4]. In cirrhotic nodules larger than 1 cm in diameter in patients with chronic liver disease, the depiction on dynamic CT or MRI of a characteristic enhancement pattern consisting of hyperenhancement during the late arterial phase and washout during the venous or delayed phase is associated with nearly 100% specificity for HCC diagnosis (fig. 1). Therefore, any new nodule that is larger than 1 cm and exhibits this combination of imaging findings can be considered HCC when it is observed in a cirrhotic liver [19, 20]. For de novo 1- to 2-cm nodules in a cirrhotic liver, the specificity and positive predictive power of the typical radiological pattern of HCC with a single dynamic technique (CT or MRI) have been found to be high in single-center studies, although negative predictive values of only 42% to 50% have been found [21, 22]. Due to the low sensitivity of the vascular profile for small HCCs, confirmation by biopsy is required in many cases [22, 23, 24]. Furthermore, for hypervascular nodules without washout that are larger than 1 cm, the chance of being HCC is as high as 66% [25]. Therefore, this radiological pattern can be troublesome for the diagnosis of HCC. In these cases, use of an additional imaging technique for detecting washout is advisable so that the malignancy can be confirmed without fine-needle biopsy. Another common problem related to dynamic imaging techniques is the great difficulty in differentiating small HCC from arterially enhancing pseudolesions or small hypervascular nodules other than HCCs [26]. Finally, hypovascular or isovascular HCC (such as early HCC) cannot be diagnosed with the aforementioned radiological criteria based on hemodynamic features and tumor size. The accurate detection and characterization of small hepatocellular nodules, including dysplastic nodules, early HCC, or small HCC less than 2 cm in diameter, remains a challenge when imaging patients with chronic liver disease [19]. Therefore, there is an unmet demand to improve the sensitivity of imaging for the diagnosis of small HCCs while maintaining high specificity. There have been several attempts to improve the sensitivity of CT or MR for detection of HCC, including (1) increasing the sensitivity of CT by improving detection of a small amount of iodine using low-peak-tube voltage (kVp) scanning methods or dual-energy CT scanning mode, (2) increasing the sensitivity of MR using DWI by showing restricted diffusion within malignant tumor tissue, (3) increasing the sensitivity of MR using hepatocyte-specific MR contrast media to increase the contrast between HCC and background liver parenchyma, and (4) increasing the sensitivity of CT or MR using perfusion imaging by improving temporal resolution.
Fig. 1.

Typical enhancement pattern of HCC on dynamic MDCT. a Axial ultrasound scan shows a hypoechoic nodule (arrow) in the right lobe of the liver. b–d On contrast-enhanced CT scans during the arterial (b), portal (c), and delayed (d) phases, the nodule (arrow) shows arterial hyperenhancement and washout on portal and delayed phases in the right lobe of the liver.
Approaches to Improving Sensitivity of CT for Iodinated Contrast Agents
1) Low-Tube-Voltage CT Imaging
It is of paramount importance in cirrhotic patients to acquire ideal arterial phase imaging with high spatial resolution and optimal timing. The standard liver CT protocol used in most institutions includes multiphasic CT scans at 120-kVp with the use of bolus-tracking methods and high-concentration contrast medium (120–150 ml of contrast medium, concentration > 300 mgI/ml). Current MDCT scanners enable routine acquisition of submillimeter sections (0.5–0.625 mm) with isotropic resolution, which is sufficient for creating high-quality 3D images. The two most important factors that influence the detection of HCCs are lesion size and intrinsic vascularity. Lesions as small as 1 mm have been detected by MDCT, although detection of subcentimeter HCCs is regarded as being relatively difficult. In addition, it is generally believed that a minimum difference of 10 HU between the tumor and normal liver parenchyma is required for the lesion to be detected. Many HCCs are more vascular than liver parenchyma and derive their blood supply from the hepatic artery and its branches. Therefore, to improve the sensitivity of CT for detecting HCC, we need to increase the sensitivity of CT for detecting a small amount of iodinated contrast medium in tumor tissue.
Because iodinated contrast material provides greater X-ray attenuation with low tube voltage settings through an increased photoelectric effect, iodinated contrast material is more conspicuous in low-tube-voltage images (such as 80-kVp) than in high-tube-voltage images (such as 120–140-kVp) [27]. By virtue of the nature of radiation attenuation, the contrast-to-noise ratio of HCCs in late arterial-phase images taken at 80-kVp can be better than those at 120-kVp, even though the overall noise level is higher in 80-kVp images than in 120-kVp images [28, 29] (figs. 2, 3). With the recent advent of very high output X-ray tubes for MDCT scanners that can generate high tube current peaks (up to 800 mA), the greater image noise of the low-tube-voltage technique can be partially compensated for by an increase in the tube current–time product. Previous studies demonstrated that the high-tube-current CT technique (with a low tube voltage) improves the conspicuity of malignant hypervascular liver tumors during the late hepatic arterial phase by substantially increasing the tumor-to-liver contrast-to-noise ratio; this technique also significantly reduces the patient radiation dose [30]. In addition, the image quality of low-tube-voltage liver scans can be further improved with the use of noise-reduction techniques such as the adaptive statistical iterative reconstruction algorithm [31].
Fig. 2.
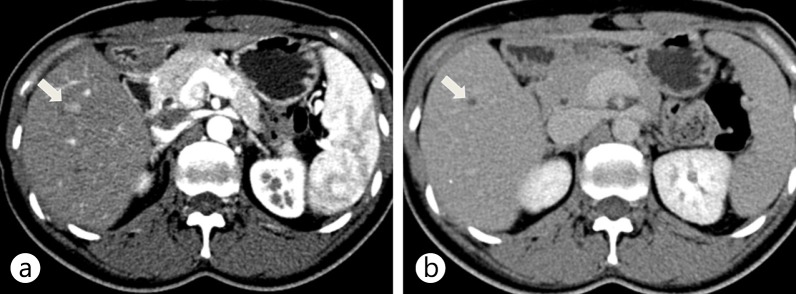
Low-tube-voltage CT imaging of the liver. a Arterial-phase CT scan using 80-kVp shows strong arterial enhancement of HCC (arrow) as well as strong enhancement of the aorta. b Delayed-phase CT scan using 120-kVp shows washout of the lesion (arrow).
Fig. 3.

Dual-energy CT scan of the liver using a dual-energy dual-source CT (SOMATOM Definition, Siemens) with a low kVp setting on the smaller detector array. These images were captured using the same window level and width. CT images show the enhancement of HCC (arrow) at the lipiodol deposit (arrowhead) from the previous transarterial chemoembolization. a A linearly blended image of both 80-kVp and 140-kVp images mimicking a conventional 120-kVp single-energy CT image. The dotted circle denotes the field of view of the smaller detector array. A linearly blended image shows moderate enhancement of HCC with the lowest noise level because of the use of data from both 80-kVp (b) and 140-kVp (c) images. b An 80-kVp image made with data from the smaller detector array only. Note that the 80-kVp image shows the strongest enhancement of HCC (arrow) at the lipiodolized nodule (arrowhead). c A 140-kVp image made with data from the larger array. The 140-kVp image has low noise, but the enhancement of HCC (arrow) is less conspicuous than on the 80-kVp image. d An iodine map showing iodine density in the tissues. The maximal lesion-to-parenchyma enhancement ratio of the iodine map can be achieved by subtraction of the background water density. Note the high density in the ribs and vertebral body both on the virtual noncontrast image and on the iodine map. This is caused by incomplete decomposition of calcium with two basis materials based on water and iodine. e A virtual noncontrast image that represents a water density map by material decomposition of 80-kVp and 140-kVp images. Note that the iodine enhancement of HCC is subtracted and becomes null (arrow). The lipiodolized nodule is also subtracted (arrowhead) because it contains iodine just like HCC does. This is a well known limitation of virtual noncontrast images.
2) Dual-Energy CT
Dual-energy CT was recently introduced and its use has become more widespread. Dual-source CT uses two energies, i.e., 140 and 80-kVp. This technique can measure chemical composition by means of the dual-energy index (DEI), which characterizes the spectral behavior of materials. The possibility of enhancing material differentiation by acquiring CT scans with different X-ray spectra had already been realized in the 1970s [32], but the technique did not become clinically available until dual-source CTs were introduced in 2006. Nowadays, there are two commercially available methods for carrying out dual-energy CT. One is a dual-source CT (the SOMATOM Definition and SOMATOM Definition Flash, both from Siemens) and the other is the fast-kVp switching method (the Discovery CT750HD from GE Healthcare).
Dual-energy CT allows materials to be differentiated in the abdominal region. Material decomposition and DEI analysis with dual-energy CT can characterize renal stones by their composition and quantify hepatic iron accumulation or fatty liver disease [33, 34, 35]. In addition, virtual noncontrast images (subtraction images) and iodine map images can be synthesized from dual-energy datasets (fig. 3). According to a previous study, these post-processed image sets may improve evaluation of the therapeutic response of HCC to radiofrequency ablation and may also lead to lower radiation doses if precontrast CT scans can be replaced by virtual noncontrast images [36]. Given that iodinated contrast material provides greater X-ray attenuation at low tube voltage settings through an increased photoelectric effect, it is expected that low-kVp images of dual-energy datasets will be more sensitive than high-kVp images in detecting hypervascular liver lesions such as HCC, despite the higher noise levels [28]. As an alternative approach for improving detection of hypervascular HCC on CT, fused images can be created by blending the CT datasets obtained at different tube energies [37]. Nonlinear blending (such as sigmoid blending) of dual-energy datasets can create images with better contrast-to-noise ratios than 80-kVp images or linear blending methods. This improvement is achieved by using data recorded at 80-kVp for highly attenuating materials and using data from 140-kVp for reducing noise [38]. Sophisticated blending techniques may be able to reduce contrast material usage and patient radiation exposure. Moreover, monochromatic images that provide energy-selective information can also be synthesized from dual-energy datasets. Monochromatic images are generated from CT images as if the X-ray source produced X-ray photons of a single energy only. Because monochromatic images are generated from projection-space data, they are considered to be less affected by beam-hardening artifacts [39, 40]. Further clinical research and technique refinement will be needed as the usage of these exciting technologies spreads.
Diffusion-Weighted Imaging
DWI is based on intravoxel incoherent motion (IVIM) and provides noninvasive quantification of water diffusion and microcapillary blood perfusion [41]. DWI has been widely used in neuroimaging to evaluate early-stage stroke or various grades of brain tumors, but it has played a limited role in abdominal imaging because DWI is highly sensitive to motion artifacts. However, recent technical advances in MR such as parallel imaging techniques and new scanners with improved B0 inhomogeneity make DWI applicable in abdominal imaging, especially in liver imaging. DWI is a quantitative imaging technique that assesses water proton mobility in living tissue by calculation of the apparent diffusion coefficient (ADC). In malignancy, tumor cells are densely packed in a tissue; high cellularity in a tissue restricts the motion of water molecules and results in decreased ADC values compared with the surrounding normal tissue. In contrast, benign lesions have relatively low cellularity, and water molecule movement is relatively free. Thus benign lesions exhibit higher ADC values than malignant lesions. DWI does not require gadolinium contrast material, which is attractive in patients with renal dysfunction and in patients at risk for nephrogenic systemic fibrosis.
DWI has been reported to improve the detection rate of focal liver lesions (FLLs) compared with the use of T2-weighted images [42, 43], and it adds value to the hepatobiliary phase of gadolinium-enhanced MR in the cirrhotic liver [44, 45, 46, 47]. In addition, DWI has been used to characterize FLLs; benign lesions such as hepatic cysts and hemangiomas exhibit higher ADC values than malignant lesions including HCCs and metastases [43, 48, 49, 50, 51, 52] (fig. 4). Another interesting application for DWI in liver cancer is the monitoring of treatment after chemotherapy or chemoembolization. DWI and ADC maps can be used to investigate tumor viability at the cellular level by providing insight into molecular water compositions [53]. Viable tumors are highly cellular, and these cells have an intact cell membrane, thus restricting the motion of water molecules and resulting in a decrease in the ADC value. In contrast, cellular necrosis causes increased membranous permeability, allowing free diffusion of water molecules and a marked increase in ADC. This technique enables the detection of early cellular necrosis [53]. DWI has been reported to be useful in monitoring treatment responses after chemotherapy, radioembolization, and chemoembolization [54, 55, 56, 57, 58, 59, 60, 61, 62].
Fig. 4.
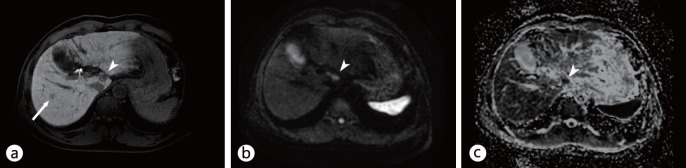
DWI for characterization of focal liver lesions in cirrhotic liver. a Contrast-enhanced T1-weighted image during t he hepatobiliary phase of G d-EOB-DTPA-enhanced MRI shows t wo nodules: one i n S egment VII (arrow) and one in Segment I (arrowhead). b, c DWI (b) and an ADC map (c) demonstrate that the nodule in Segment I (b, c, arrowheads) has diffusion restriction, whereas the other in Segment VII does not (b, c, arrow). On TACE, only the nodule in Segment I exhibited tumor staining. The other in Segment VII was reported as a high-grade dysplastic nodule; it showed interval growth and tumor staining on TACE 18 months later.
More recently, IVIM-DWI has been under investigation worldwide. IVIM-DWI quantitatively assesses all microscopic translational motions in a tissue, i.e., the motion of water molecules and the motion resulting from the microcirculation in randomly organized vessels, whereas conventional DWI is acquired on the assumption that all motions in a tissue are Brownian motion [63, 64, 65]. IVIM-DWI is able to differentiate the vascular contribution to overall water molecule movement using sufficient b-values, and it additionally calculates three perfusion parameters: true molecular diffusion, (which is pure molecular diffusion), pseudodiffusion, and the perfusion fraction. Several studies reported the usefulness of IVIM-DWI parameters in the differentiation of FLLs [66, 67] and the monitoring of treatment response after chemotherapy [68] (fig. 5). Although there have been only a few reports on IVIM-DWI, it is a promising tool for detection, characterization, and monitoring of FLLs, especially in patients who have renal parenchymal disease or are at risk from the adverse effect of contrast media, e.g., pregnant patients.
Fig. 5.

IVIM-DWI of a surgically confirmed HCC (arrowheads) in the right lobe of the liver. a An arterial-phase image shows strong arterial enhancement (arrowheads) of the lesion in segment V of the liver. b, c The lesion shows diffusion restriction on conventional DWI (b) and on an ADC map (c). d–f On IVIM-DWI, the tumor showed lower true diffusion (d), pseudodiffusion (e), and perfusion fraction (f) than hepatic parenchyma. Note that the hyperenhanced portion of the tumor exhibited a relatively high perfusion fraction (arrows).
Hepatocyte-Specific MR Contrast Agents
Based on emerging data, the most promising strategy for improving the diagnostic accuracy of imaging techniques for early HCC diagnosis may be the use of liver-specific contrast agents such as gadolinium-ethoxybenzyl-diethylenetriaminepentaacetic acid (Gd-EOB-DTPA, Primovist; Bayer HealthCare, Berlin, Germany) or gadobenate dimeglumine Gd-BOPTA (Multihance; Bracco Diagnostics, Milan, Italy) [69, 70]. The role of contrast-enhanced magnetic resonance (CE-MR) imaging with agents such as GD-EOB-DTPA is growing, with this modality being widely viewed as a problem-solving tool [9]. The biphasic nature of Gd-EOB-DTPA enables dynamic-phase imaging, and because approximately 50% of the contrast agent is taken up by organic anion transporter (OATP1B3) receptors in functioning liver hepatocytes, images can be obtained in the hepatobiliary phase [71, 72]. This makes Gd-EOB-DTPA MRI a comprehensive liver analysis tool, and these features are expected to improve tumor detection and characterization compared with other imaging modalities. In particular, this modality enables small lesions to be monitored over a long-term follow-up period, increases the accuracy of diagnosis of post-resection liver-related complications, and allows the anatomical and functional information obtained from imaging to be used for treatment planning [9, 73] (fig. 6).
Fig. 6.

Typical imaging features of HCC on Gd-EOB-DTPA-enhanced MRI. a Precontrast T2-weighted image shows a hyperintense nodule (arrow) in right lobe of the liver. b On a precontrast T1-weighted image, the nodule (arrow) shows hypointensity. c–e Dynamic scans during the arterial (c), portal (d), and delayed (e) phases show a well-defined, arterial hyperenhancing nodule (arrow) in segment VIII with washout on portal and delayed phases. f On a hepatobiliary-phase image, the nodule in segment VIII (arrow) shows decreased contrast uptake.
Use of extracellular contrast media for dynamic MRI provides sufficient information for confident diagnosis of typical enhancing HCC, but to identify hypovascular lesions and mimickers, more information is required. This information gap has traditionally been filled by fine-needle biopsies and immunohistochemical analysis; however, the extra information provided by dual-contrast agents such as Gd-EOB-DTPA, with the characteristics of both dynamic and hepatobiliary-phase imaging (HBPI), may allow a more detailed and confident diagnosis of cirrhotic liver lesions from one MRI procedure (figs. 7, 8). Updated guidelines on HCC detection and diagnosis from the Japan Society of Hepatology include HBPI information in their algorithm as a problem-solving tool when dynamic MR or CT imaging shows atypical vascular features [74] (fig. 7). In addition, the use of contrast-enhanced MRI with agents such as Gd-EOB-DTPA could improve the detectability rate of early HCC or daughter nodules (i.e., nodules around 1–1.5 cm) (fig. 8). In a study of 30 resected specimens, a low to slightly low signal intensity in the hepatobiliary phase of Gd-EOB-DTPA MRI correctly identified 23/24 hypovascular hepatocyte nodules as early HCCs [only 1 nodule was wrongly identified as a dysplastic nodule (DN) or a regenerative nodule (RN)]. An iso- to high intensity signal correctly identified 5/6 lesions as a DN or RN (only one nodule was wrongly identified as early HCC). The detection accuracy was 93% (28/30) in this study [75]. Furthermore, as the degree of OATP8 expression declines according to malignancy grade during multistep hepatocarcinogenesis, there will be a decline of enhancement ratio on hepatobiliary-phase images because of reduced Gd-EOB-DTPA uptake. Calculation of this enhancement ratio could be useful for estimating malignancy grade [76]. However, a small proportion of HCCs are iso- or hyperintense during the hepatobiliary phase of Gd-EOB-DTPA-enhanced MRI (i.e., around 5–10% of HCCs; these show prominent expression of OATP8, probably due to genetic alterations) (fig. 9). The presence of a focal defect in contrast media uptake and a hypointense rim can help to differentiate hyperintense HCC from benign lesions such as focal nodular hyperplasia-like nodule or dysplastic nodule [77]. Previous immunostaining studies showed that hypointense HCCs on HBPI have lower expression of OATP8 [72]. Furthermore, Gd-EOB-DTPA has shown favorable results in several studies for differentiation between arterial-enhancing pseudolesions (AEPs) and small HCCs [26]. The majority of HCCs in these studies (95.4%; n=42/44) displayed low hypointensity during the hepatobiliary phase of Gd-EOB-DTPA-enhanced MRI, whereas most AEPs were iso-intense on the hepatobiliary phase (94.3%; n=50/53); the sensitivity of Gd-EOB-DTPA MRI was significantly higher than that for multiphasic CT (93.9% and 90.9% [with two MRI reviewers] vs. 54.5% and 54.5% [with two CT reviewers], respectively) in these patients [26].
Fig. 7.

Comparison of nonspecific extracellular gadolinium chelate-enhanced dynamic MRI with Gd-EOB-DTPA-enhanced MRI in a patient with a single nodular HCC in segment VIII (arrow) a,b Extracellular contrast medium-enhanced dynamic MRI scans show a hyperenhancing nodule during the arterial phase (a) without showing washout on the delayed phase (b). Due to the atypical enhancement pattern of this HCC lesion, it is difficult to make a confident diagnosis with dynamic MRI. c–e Gd-EOB-DTPA-enhanced MRI scans during the arterial (c), delayed (d), and hepatobiliary (e) phases show a well-defined, arterial hyperenhancing nodule (arrow) with washout on delayed phases, and a decreased contrast uptake in segment VIII.
Fig. 8.

Comparison of dynamic MDCT and Gd-EOB-DTPA-enhanced MRI in a patient with a dominant hypervascular HCC in segment VIII as well as daughter nodules. a, b On contrast-enhanced CT scans during the arterial (a) and portal (b) phases, the main mass (arrow) showed arterial hyperenhancement and washout on the portal and delayed phases in the right lobe of the liver. c, d On Gd-EOB-DTPA-enhanced MR images during the arterial (c) and portal (d) phases, the main mass (arrow) shows a typical enhancing pattern of HCC in the right lobe of the liver. e On a hepatobiliary-phase image, two additional daughter nodules (open arrows) that were not detected on a CT scan were seen as hypointense nodules. f The gross specimen shows several additional daughter nodules (open arrows) around the main tumor.
Fig. 9.

Surgically confirmed HCC showing increased contrast uptake on hepatobiliary-phase imaging of Gd-EOB-DTPA-enhanced liver MRI. a An arterial-phase Gd-EOB-DTPA-enhanced liver MRI shows a hyperenhancing tumor (arrows) in the right posterior segment of the liver. b A portal-phase Gd-EOB-DTPA-enhanced liver MRI shows a hypointense lesion (arrows). c On a hepatobiliary-phase image, the tumor (arrows) shows hyperenhancement resulting from increased expression of OATP8, probably due to genetic alterations. d The gross specimen shows a large mass with mixed components and bile staining.
There is growing evidence that Gd-EOB-DTPA-enhanced MRI has high sensitivity for the diagnosis of HCC in cirrhosis. It provides additional imaging features in the hepatobiliary phase that can be useful in the characterization of borderline hepatocellular lesions, in the diagnosis of early HCC, and to characterize HCCs showing atypical vascular enhancing features. The high detection rate of HCC with Gd-EOB-DTPA-enhanced MRI seems not only to improve preoperative planning, but also has the potential to reduce the costs associated with further imaging.
Perfusion Imaging
The fundamental principle of perfusion CT or DCE-MRI is based on the temporal changes in tissue attenuation after intravenous administration of iodinated contrast media. Tissue enhancement can be divided into two phases: that of the intravascular compartment and that of the extravascular compartment. By obtaining a series of CT images in quick succession during these two phases and applying appropriate mathematic modeling, the parameters of tissue perfusion in the region of interest can be quantitated. Two representative kinetic modeling techniques can be used: compartmental analysis and deconvolution analysis [78]. Perfusion imaging techniques such as perfusion CT and DCE-MRI provide qualitative and quantitative data on the regional and global changes in hepatic blood flow, which help to characterize the hemodynamics of HCCs and background liver parenchyma [79, 80, 81, 82, 83, 84, 85, 86]. There has been a gradual increase in the utility of perfusion imaging in oncology, with the wide spectrum of clinical applications including (1) lesion characterization (differentiation between benign and malignant lesions); (2) identification of occult malignancies; (3) provision of prognostic information based on tumor vascularity; and (4) monitoring therapeutic effects of the various treatment regimens [1, 3, 15].
Considering that alteration in the relative arterial and portal venous blood flows in the liver is known to be associated with the evolution of liver cirrhosis and multistep hepatocarcinogenesis [87, 88, 89, 90], perfusion CT and DCE-MRI can be used for the diagnosis, prognostic evaluation, and monitoring of response to therapy of liver HCCs. In terms of diagnosis, malignant liver tumors have been reported to have high perfusion values (high blood flow, high blood volume, high permeability, and low mean transit time) compared with normal tissue [11, 12]. In terms of treatment monitoring, HCCs show a fall in blood flow, blood volume, and permeability after antiangiogenic treatment or chemoembolization [13, 14].
1) Perfusion CT
After injection of a bolus of contrast medium, perfusion CT is performed by the acquisition of serial images from which a time-attenuation curve is generated. From the time-attenuation curve, we can obtain quantitative perfusion parameters, including tissue blood flow, tissue blood volume, mean transit time, and permeability [10, 83, 91]. Various perfusion CT protocols have been proposed; the most appropriate should be chosen depending on the pertinent physiologic parameter that needs to be analyzed. Dynamic imaging acquisition includes a first-pass study, a delayed study, or both. The first-pass study comprises images acquired in the initial cine phases for a total of approximately 40–60 s. To measure the permeability, a second phase ranging from 2–10 min is added after the first-pass study. A contrast bolus of 40–70 mL and an injection rate ranging from 3.5 to 10 mL/s are usually required for optimal perfusion analysis [78]. Perfusion CT provides quantitative data regarding perfusion parameters and might, therefore, help differentiate diverse tumor tissue based on perfusion behavior, thereby allowing therapies to be monitored, biopsies to be planned, and tumors to be graded (fig. 10).
Fig. 10.

Perfusion CT of typical hypervascular HCC. a Some representative images from a perfusion CT scan demonstrate early enhancement and washout of an HCC lesion (arrow) in segment III. b Perfusion maps of blood flow, blood volume, permeability, arterial perfusion, and portal perfusion show the increased blood flow, blood volume, and arterial perfusion and decreased portal perfusion of the lesion compared with those of adjacent liver parenchyma.
Recent studies have reported the usefulness of perfusion CT for monitoring the response to antiangiogenic therapy and predicting outcomes in patients with HCC, which shows the feasibility of using perfusion parameters as in vivo biomarkers of tumor vascularity [55, 92, 93, 94]. Perfusion CT can also be used for detection of recurrence after radiofrequency ablation [95] and for patient selection and assessment of the early treatment response to transcatheter arterial chemoembolization (TACE) [96, 97, 98]. Perfusion CT may play a role in early detection and assessment of the severity of liver cirrhosis [99], and this functional evaluation of liver parenchyma may be important for planning surgery and evaluating therapy [86]. However, the major drawback of perfusion CT is the high radiation exposure, which makes it difficult to apply in HCC surveillance and in serial examination for evaluation of treatment response [83, 100]. Recent studies demonstrated that noise-reduction techniques such as adaptive statistical iterative reconstruction are able to decrease the radiation dose associated with perfusion CT by providing similar image quality at significantly lower radiation doses [31, 101, 102, 103]. Another approach for evaluating the hemodynamic changes of cirrhotic nodules using CT is quantitative CT color mapping of the arterial enhancement fraction (AEF, the ratio of the increased attenuation during the arterial phase to the increased attenuation during the portal venous phase) of the liver calculated from conventional dynamic CT images; the AEF may be used as a surrogate perfusion parameter without the requirement of exposing the patient to additional radiation [104, 105, 106, 107]. AEF imaging shows better conspicuity of the mass than conventional imaging. I believe that this technique can be applied in the detection of HCC and the monitoring of therapy.
2) Dynamic Contrast-Enhanced MRI
DCE-MRI is a noninvasive functional imaging method for investigating microvascular structure and function by tracking the pharmacokinetics of an injected contrast medium, in an approach similar to that of perfusion CT. DCE-MRI generates quantitative perfusion parameters such as the volume transfer coefficient (Ktrans) of contrast medium between the blood plasma and the extravascular extracellular space (EES), the volume of the EES, and the initial area under the curve [108, 109]. Malignant liver tumors have been reported to show high perfusion values (high blood flow, high blood volume, high permeability, and low mean transit time) compared to normal tissue, and these differences can be used for diagnosis, [91, 110] (fig. 11). Thanks to recent advances in MRI technology, whole-liver perfusion images can be obtained at high temporal and spatial resolution [41]. Therefore, DCE-MRI is a promising technique for HCC surveillance and can be performed without ionizing radiation [84]. Because the hemodynamic features of HCC can be detected and quantified by DCE-MRI, many clinical trials have used DCE-MRI as a biomarker of drug efficacy for evaluating antiangiogenic and vascular disrupting agents [108, 111, 112, 113, 114, 115, 116]. In terms of monitoring the response of HCC to antiangiogenic drugs such as Sorafenib or other new drugs, quantitative parameters derived from DCE-MRI have demonstrated correlation with drug activity [117, 118, 119, 120]. In addition, parameters obtained by DCE-MRI can be used for response monitoring or outcome prediction after regional chemotherapy [121] or TACE [122].
Fig. 11.
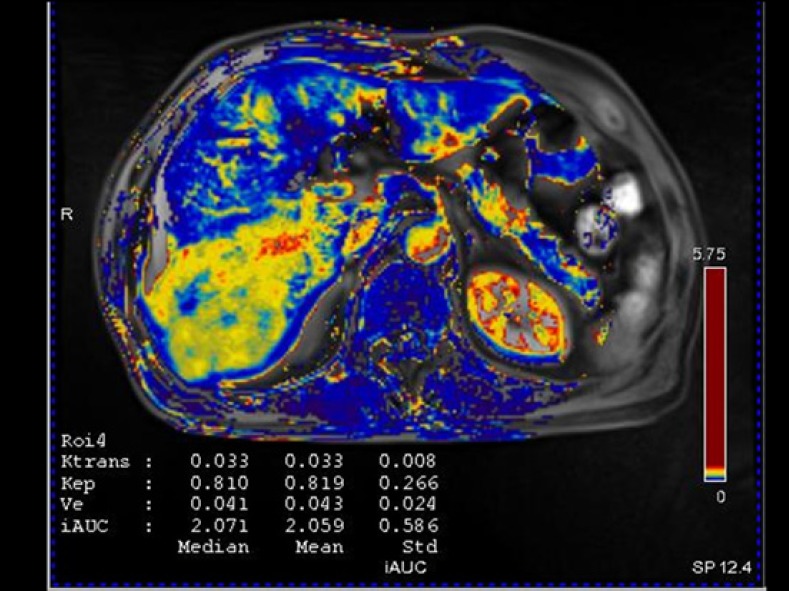
DCE-MRI of the same patient as that in Fig. 9. Although Gd-EOB-DTPA-enhanced MRI showed atypical enhancement of the pathologically confirmed HCC lesion in the right lobe of the liver, the Ktrans map of DCE-MRI shows increased Ktrans values compared with that of adjacent liver parenchyma.
Elastography
For evaluation of superficial organs, manual palpation is one of the most important diagnostic techniques of physicians to assess the stiffness of a lesion: normal tissue or benign lesions are soft, but malignant lesions are firm and rigid on palpation. Elastography is a recently developed method that quantitatively measures the stiffness of a tissue by detecting the wave propagation velocity in deeply seated organs such as the liver as well as in superficial organs using US (USE) or MR (MRE). The shear wave speed is high in hard tissue such as that in tumors and relatively low in the surrounding normal tissue [123, 124]. Because elastography was found to be a promising tool for detection and characterization of breast lesions, there have been attempts to evaluate the feasibility of elastography in detection and characterization of FLLs. USE and MRE have been used to estimate the stiffness of FLLs. USE techniques include transient elastography (TE), which is a nonimaging ultrasound method, and imaging ultrasound methods such as real-time elastography, acoustic radiation force impulse (ARFI) imaging, and supersonic shear imaging (SSI) or shear wave elastography (SWE). It has been reported that TE is a reproducible, noninvasive method for liver stiffness measurement; however, it does not provide anatomic information in B-mode. It also has limited applicability in obese patients [125]. ARFI and SSI are conventional US imaging-based techniques that enable operators to correlate anatomy with elastography. Both have been reported to give reproducible liver stiffness measurements [126, 127]. USE techniques are useful for FLL characterization [128, 129, 130] and can detect recurrence after local treatment [131] (fig. 12). In liver, SSI is still under investigation, whereas it is in regular use in the evaluation of breast focal lesions.
Fig. 12.
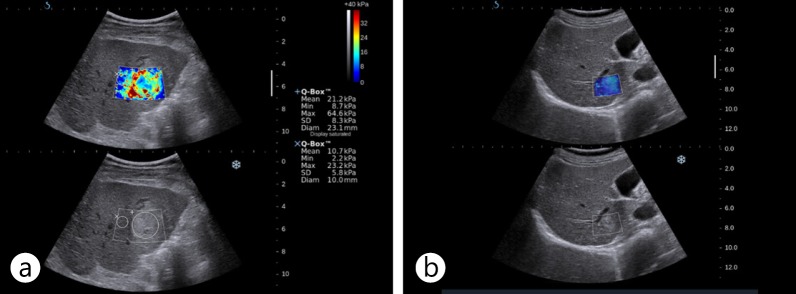
US elastography images of HCC and hemangioma. A hyperechoic mass was shown to have increased stiffness on US elastography using SSI (a). It was confirmed as HCC on biopsy. A small hyperechoic low-stiffness nodule with a stiffness value similar to that of liver parenchyma on US elastography using SSI (b) was revealed as a hemangioma on follow-up MR.
MRE is a phase contrast-based MR technique that is able to measure the propagating shear wave in a tissue generated by a vibration device [132, 133]. Preliminary studies showed its feasibility for characterization of hepatic focal lesions: malignant tumors showed higher stiffness values than benign tumors or normal liver parenchyma [134, 135] (fig. 13). Inspired by the successful application in clinical practice of MRE to noninvasive evaluation of fibrosis of the liver, recent studies have tried to evaluate the utility of MRE in characterizing liver tumors, and preliminary study results show that MRE is feasible for imaging and characterizing solid liver tumors [134]. Malignant tumors had greater stiffness values than benign tumors and normal liver parenchyma. Thus, MRE is a promising noninvasive technique for assessing solid liver tumors. Use of MRE may lead to new quantitative tissue characterization parameters for differentiating benign and malignant liver tumors. Although further investigation is needed, MRE has several advantages over TE or ARFI: MRE covers a larger volume of the liver [136] and can be applied in obese patients or patients with ascites. MRE and USE have been frequently used in evaluation of hepatic fibrosis, but these examination modalities have potential as tools for HCC diagnosis and monitoring.
Fig. 13.

MR elastography of a surgically confirmed huge infiltrative HCC. a, b On Gd-EOB-DTPA-enhanced MR images during the arterial (a) and portal (b) phases, the main mass (arrowheads) showed the typical enhancing pattern of HCC, with arterial enhancement and washout, in right lobe of the liver. c MR elastography showed the increased stiffness of the tumor compared with the adjacent liver parenchyma. d The gross specimen showed a large mass with an infiltrative growth pattern.
Summary
The role of liver imaging is no longer to provide anatomical information and to evaluate structural abnormality; it has evolved to a point where it can assess functional, cellular, and architectural alterations and provide important information on lesion or organ biology. Multiparametric functional studies, such as those including perfusion imaging, diffusion imaging, stiffness imaging, and cell imaging with tissue-specific contrast media, will, in combination with conventional imaging studies, become an essential part of HCC diagnosis in daily practice.
References
- 1.Choi BI, Lee JM. Advancement in HCC imaging: diagnosis, staging and treatment efficacy assessments: imaging diagnosis and staging of hepatocellular carcinoma. Journal of hepato-biliary-pancreatic sciences. 2010;17:369–373. doi: 10.1007/s00534-009-0227-y. [DOI] [PubMed] [Google Scholar]
- 2.Clavien PA, Lesurtel M, Bossuyt PM, Gores GJ, Langer B, Perrier A. Recommendations for liver transplantation for hepatocellular carcinoma: an international consensus conference report. Lancet Oncol. 2012;13:e11–e22. doi: 10.1016/S1470-2045(11)70175-9. [DOI] [PMC free article] [PubMed] [Google Scholar]
- 3.Lee JM, Choi BI. Hepatocellular nodules in liver cirrhosis: MR evaluation. Abdom Imaging. 2011;36:282–289. doi: 10.1007/s00261-011-9692-2. [DOI] [PubMed] [Google Scholar]
- 4.Bruix J, Sherman M. Management of hepatocellular carcinoma. Hepatology. 2005;42:1208–1236. doi: 10.1002/hep.20933. [DOI] [PubMed] [Google Scholar]
- 5.Matsui O. Imaging of multistep human hepatocarcinogenesis by CT during intra-arterial contrast injection. Intervirology. 2004;47:271–276. doi: 10.1159/000078478. [DOI] [PubMed] [Google Scholar]
- 6.Hayashi M, Matsui O, Ueda K, Kawamori Y, Kadoya M, Yoshikawa J, Gabata T, Takashima T, Nonomura A, Nakanuma Y. Correlation between the blood supply and grade of malignancy of hepatocellular nodules associated with liver cirrhosis: evaluation by CT during intraarterial injection of contrast medium. AJR Am J Roentgenol. 1999;172:969–976. doi: 10.2214/ajr.172.4.10587130. [DOI] [PubMed] [Google Scholar]
- 7.Matsui O, Kobayashi S, Sanada J, Kouda W, Ryu Y, Kozaka K, Kitao A, Nakamura K, Gabata T. Hepatocelluar nodules in liver cirrhosis: hemodynamic evaluation (angiography-assisted CT) with special reference to multi-step hepatocarcinogenesis. Abdom Imaging. 2011;36:264–272. doi: 10.1007/s00261-011-9685-1. [DOI] [PMC free article] [PubMed] [Google Scholar]
- 8.Kitao A, Zen Y, Matsui O, Gabata T, Nakanuma Y. Hepatocarcinogenesis: multistep changes of drainage vessels at CT during arterial portography and hepatic arteriography–radiologic-pathologic correlation. Radiology. 2009;252:605–614. doi: 10.1148/radiol.2522081414. [DOI] [PubMed] [Google Scholar]
- 9.Lee JM, Zech CJ, Bolondi L, Jonas E, Kim MJ, Matsui O, Merkle EM, Sakamoto M, Choi BI. Consensus report of the 4th International Forum for Gadolinium-Ethoxybenzyl-Diethylenetriamine Pentaacetic Acid Magnetic Resonance Imaging. Korean J Radiol. 2011;12:403–415. doi: 10.3348/kjr.2011.12.4.403. [DOI] [PMC free article] [PubMed] [Google Scholar]
- 10.Murakami T, Imai Y, Okada M, Hyodo T, Lee WJ, Kim MJ, Kim T, Choi BI. Ultrasonography, computed tomography and magnetic resonance imaging of hepatocellular carcinoma: toward improved treatment decisions. Oncology. 2011;81((suppl 1)):86–99. doi: 10.1159/000333267. [DOI] [PubMed] [Google Scholar]
- 11.Zech CJ, Reiser MF, Herrmann KA. Imaging of hepatocellular carcinoma by computed tomography and magnetic resonance imaging: state of the art. Dig Dis. 2009;27:114–124. doi: 10.1159/000218343. [DOI] [PubMed] [Google Scholar]
- 12.Hashimoto K, Murakami T, Dono K, Hori M, Kim T, Kudo M, Marubashi S, Miyamoto A, Takeda Y, Nagano H, et al. Assessment of the severity of liver disease and fibrotic change: the usefulness of hepatic CT perfusion imaging. Oncol Rep. 2006;16:677–683. [PubMed] [Google Scholar]
- 13.Chen BB, Hsu CY, Yu CW, Wei SY, Kao JH, Lee HS, Shih TT. Dynamic contrast-enhanced magnetic resonance imaging with Gd-EOB-DTPA for the evaluation of liver fibrosis in chronic hepatitis patients. Eur Radiol. 2012;22:171–180. doi: 10.1007/s00330-011-2249-5. [DOI] [PubMed] [Google Scholar]
- 14.Taouli B. Diffusion-weighted MR imaging for liver lesion characterization: a critical look. Radiology. 2012;262:378–380. doi: 10.1148/radiol.11112417. [DOI] [PubMed] [Google Scholar]
- 15.Park MS, Kim S, Patel J, Hajdu CH, Do RK, Mannelli L, Babb JS, Taouli B. Hepatocellular carcinoma: Detection with diffusion-weighted vs. contrast-enhanced MRI in pre-transplant patients. Hepatology. 2012 doi: 10.1002/hep.25681. [DOI] [PubMed] [Google Scholar]
- 16.Kim BH, Lee JM, Lee YJ, Lee KB, Suh KS, Han JK, Choi BI. MR elastography for noninvasive assessment of hepatic fibrosis: experience from a tertiary center in Asia. J Magn Reson Imaging. 2011;34:1110–1116. doi: 10.1002/jmri.22723. [DOI] [PubMed] [Google Scholar]
- 17.Coenegrachts K. Magnetic resonance imaging of the liver: New imaging strategies for evaluating focal liver lesions. World J Radiol. 2009;1:72–85. doi: 10.4329/wjr.v1.i1.72. [DOI] [PMC free article] [PubMed] [Google Scholar]
- 18.Choi BI. The current status of imaging diagnosis of hepatocellular carcinoma. Liver Transplantation. 2004;10((2 Suppl 1)):S20–25. doi: 10.1002/lt.20038. [DOI] [PubMed] [Google Scholar]
- 19.Lee JM, Trevisani F, Vilgrain V, Wald C. Imaging diagnosis and staging of hepatocellular carcinoma. Liver Transplantation. 2011;17(Suppl 2):S34–43. doi: 10.1002/lt.22369. [DOI] [PubMed] [Google Scholar]
- 20.Sherman M. The radiological diagnosis of hepatocellular carcinoma. Am J Gastroenterol. 2010;105:610–612. doi: 10.1038/ajg.2009.663. [DOI] [PubMed] [Google Scholar]
- 21.Fournier LS, Cuenod CA, de Bazelaire C, Siauve N, Rosty C, Tran PL, Frija G, Clement O. Early modifications of hepatic perfusion measured by functional CT in a rat model of hepatocellular carcinoma using a blood pool contrast agent. Eur Radiol. 2004;14:2125–2133. doi: 10.1007/s00330-004-2339-8. [DOI] [PubMed] [Google Scholar]
- 22.Sangiovanni A, Manini MA, Iavarone M, Romeo R, Forzenigo LV, Fraquelli M, Massironi S, Della Corte C, Ronchi G, Rumi MG, et al. The diagnostic and economic impact of contrast imaging techniques in the diagnosis of small hepatocellular carcinoma in cirrhosis. Gut. 2010;59:638–644. doi: 10.1136/gut.2009.187286. [DOI] [PubMed] [Google Scholar]
- 23.Forner A, Vilana R, Ayuso C, Bianchi L, Sole M, Ayuso JR, Boix L, Sala M, Varela M, Llovet JM, et al. Diagnosis of hepatic nodules 20 mm or smaller in cirrhosis: Prospective validation of the noninvasive diagnostic criteria for hepatocellular carcinoma. Hepatology. 2008;47:97–104. doi: 10.1002/hep.21966. [DOI] [PubMed] [Google Scholar]
- 24.Khalili K, Kim TK, Jang HJ, Yazdi LK, Guindi M, Sherman M. Indeterminate 1–2-cm nodules found on hepatocellular carcinoma surveillance: biopsy for all, some, or none? Hepatology. 2011;54:2048–2054. doi: 10.1002/hep.24638. [DOI] [PubMed] [Google Scholar]
- 25.Luca A, Caruso S, Milazzo M, Mamone G, Marrone G, Miraglia R, Maruzzelli L, Carollo V, Minervini MI, Vizzini G, et al. Multidetector-row computed tomography (MDCT) for the diagnosis of hepatocellular carcinoma in cirrhotic candidates for liver transplantation: prevalence of radiological vascular patterns and histological correlation with liver explants. Eur Radiol. 2010;20:898–907. doi: 10.1007/s00330-009-1622-0. [DOI] [PubMed] [Google Scholar]
- 26.Sun HY, Lee JM, Shin CI, Lee DH, Moon SK, Kim KW, Han JK, Choi BI. Gadoxetic acid-enhanced magnetic resonance imaging for differentiating small hepatocellular carcinomas (< or =2 cm in diameter) from arterial enhancing pseudolesions: special emphasis on hepatobiliary phase imaging. Invest Radiol. 2010;45:96–103. doi: 10.1097/RLI.0b013e3181c5faf7. [DOI] [PubMed] [Google Scholar]
- 27.Nakayama Y, Awai K, Funama Y, Hatemura M, Imuta M, Nakaura T, Ryu D, Morishita S, Sultana S, Sato N, et al. Abdominal CT with low tube voltage: preliminary observations about radiation dose, contrast enhancement, image quality, and noise. Radiology. 2005;237:945–951. doi: 10.1148/radiol.2373041655. [DOI] [PubMed] [Google Scholar]
- 28.Altenbernd J, Heusner TA, Ringelstein A, Ladd SC, Forsting M, Antoch G. Dual-energy-CT of hypervascular liver lesions in patients with HCC: investigation of image quality and sensitivity. Eur Radiol. 2011;21:738–743. doi: 10.1007/s00330-010-1964-7. [DOI] [PubMed] [Google Scholar]
- 29.Park JH, Kim SH, Park HS, Kim GH, Lee JY, Lee JM, Han JK, Choi BI. Added value of 80 kVp images to averaged 120 kVp images in the detection of hepatocellular carcinomas in liver transplantation candidates using dual-source dual-energy MDCT: results of JAFROC analysis. Eur J Radiol. 2011;80:e76–e85. doi: 10.1016/j.ejrad.2010.08.018. [DOI] [PubMed] [Google Scholar]
- 30.Marin D, Nelson RC, Samei E, Paulson EK, Ho LM, Boll DT, DeLong DM, Yoshizumi TT, Schindera ST. Hypervascular liver tumors: low tube voltage, high tube current multidetector CT during late hepatic arterial phase for detection–initial clinical experience. Radiology. 2009;251:771–779. doi: 10.1148/radiol.2513081330. [DOI] [PubMed] [Google Scholar]
- 31.Marin D, Nelson RC, Schindera ST, Richard S, Youngblood RS, Yoshizumi TT, Samei E. Low-tube-voltage, high-tube-current multidetector abdominal CT: improved image quality and decreased radiation dose with adaptive statistical iterative reconstruction algorithm–initial clinical experience. Radiology. 2010;254:145–153. doi: 10.1148/radiol.09090094. [DOI] [PubMed] [Google Scholar]
- 32.Brooks RA. A quantitative theory of the Hounsfield unit and its application to dual energy scanning. J Comput Assist Tomogr. 1977;1:487–493. doi: 10.1097/00004728-197710000-00016. [DOI] [PubMed] [Google Scholar]
- 33.Joe E, Kim SH, Lee KB, Jang JJ, Lee JY, Lee JM, Han JK, Choi BI. Feasibility and accuracy of dual-source dual-energy CT for noninvasive determination of hepatic iron accumulation. Radiology. 2012;262:126–135. doi: 10.1148/radiol.11110060. [DOI] [PubMed] [Google Scholar]
- 34.Boll DT, Patil NA, Paulson EK, Merkle EM, Simmons WN, Pierre SA, Preminger GM. Renal stone assessment with dual-energy multidetector CT and advanced postprocessing techniques: improved characterization of renal stone composition–pilot study. Radiology. 2009;250:813–820. doi: 10.1148/radiol.2503080545. [DOI] [PubMed] [Google Scholar]
- 35.Johnson TR, Krauss B, Sedlmair M, Grasruck M, Bruder H, Morhard D, Fink C, Weckbach S, Lenhard M, Schmidt B, et al. Material differentiation by dual energy CT: initial experience. Eur Radiol. 2007;17:1510–1517. doi: 10.1007/s00330-006-0517-6. [DOI] [PubMed] [Google Scholar]
- 36.Lee SH, Lee JM, Kim KW, Klotz E, Kim SH, Lee JY, Han JK, Choi BI. Dual-energy computed tomography to assess tumor response to hepatic radiofrequency ablation: potential diagnostic value of virtual noncontrast images and iodine maps. Invest Radiol. 2011;46:77–84. doi: 10.1097/RLI.0b013e3181f23fcd. [DOI] [PubMed] [Google Scholar]
- 37.Kim KS, Lee JM, Kim SH, Kim KW, Kim SJ, Cho SH, Han JK, Choi BI. Image fusion in dual energy computed tomography for detection of hypervascular liver hepatocellular carcinoma: phantom and preliminary studies. Invest Radiol. 2010;45:149–157. doi: 10.1097/RLI.0b013e3181d32119. [DOI] [PubMed] [Google Scholar]
- 38.Holmes DR, 3rd, Fletcher JG, Apel A, Huprich JE, Siddiki H, Hough DM, Schmidt B, Flohr TG, Robb R, McCollough C, et al. Evaluation of non-linear blending in dual-energy computed tomography. Eur J Radiol. 2008;68:409–413. doi: 10.1016/j.ejrad.2008.09.017. [DOI] [PMC free article] [PubMed] [Google Scholar]
- 39.Kaza RK, Platt JF, Cohan RH, Caoili EM, Al-Hawary MM, Wasnik A. Dual-energy CT with single- and dual-source scanners: current applications in evaluating the genitourinary tract. Radiographics. 2012;32:353–369. doi: 10.1148/rg.322115065. [DOI] [PubMed] [Google Scholar]
- 40.Lee YH, Park KK, Song HT, Kim S, Suh JS. Metal artefact reduction in gemstone spectral imaging dual-energy CT with and without metal artefact reduction software. European Radiology. 2012 doi: 10.1007/s00330-011-2370-5. [DOI] [PubMed] [Google Scholar]
- 41.Taouli B, Ehman RL, Reeder SB. Advanced MRI methods for assessment of chronic liver disease. AJR Am J Roentgenol. 2009;193:14–27. doi: 10.2214/AJR.09.2601. [DOI] [PMC free article] [PubMed] [Google Scholar]
- 42.Ichikawa T, Haradome H, Hachiya J, Nitatori T, Araki T. Diffusion-weighted MR imaging with a single-shot echoplanar sequence: detection and characterization of focal hepatic lesions. AJR Am J Roentgenol. 1998;170:397–402. doi: 10.2214/ajr.170.2.9456953. [DOI] [PubMed] [Google Scholar]
- 43.Parikh T, Drew SJ, Lee VS, Wong S, Hecht EM, Babb JS, Taouli B. Focal liver lesion detection and characterization with diffusion-weighted MR imaging: comparison with standard breath-hold T2-weighted imaging. Radiology. 2008;246:812–822. doi: 10.1148/radiol.2463070432. [DOI] [PubMed] [Google Scholar]
- 44.Lee MH, Kim SH, Park MJ, Park CK, Rhim H. Gadoxetic acid–enhanced hepatobiliary phase MRI and high-b-value diffusion-weighted imaging to distinguish well-differentiated hepatocellular carcinomas from benign nodules in patients with chronic liver disease. AJR Am J Roentgenol. 2011;197:W868–W875. doi: 10.2214/AJR.10.6237. [DOI] [PubMed] [Google Scholar]
- 45.Holzapfel K, Eiber MJ, Fingerle AA, Bruegel M, Rummeny EJ, Gaa J. Detection, classification, and characterization of focal liver lesions: value of diffusion-weighted MR imaging, gadoxetic acid-enhanced MR imaging and the combination of both methods. Abdom Imaging. 2011;37:74–82. doi: 10.1007/s00261-011-9758-1. [DOI] [PubMed] [Google Scholar]
- 46.Kim YK, Lee MW, Lee WJ, Kim SH, Rhim H, Lim JH, Choi D, Kim Y, Jang KM, Lee SJ. Diagnostic accuracy and sensitivity of diffusion-weighted and of gadoxetic acid-enhanced 3-T MR imaging alone or in combination in the detection of small liver metastasis (≤ 1.5 cm in Diameter) Invest Radiol. 2012;47:159–166. doi: 10.1097/RLI.0b013e31823a1495. [DOI] [PubMed] [Google Scholar]
- 47.Xu PJ, Yan FH, Wang JH, Lin J, Ji Y. Added value of breathhold diffusion-weighted MRI in detection of small hepatocellular carcinoma lesions compared with dynamic contrast-enhanced MRI alone using receiver operating characteristic curve analysis. J Magn Reson Imaging. 2009;29:341–349. doi: 10.1002/jmri.21650. [DOI] [PubMed] [Google Scholar]
- 48.Namimoto T, Yamashita Y, Sumi S, Tang Y, Takahashi M. Focal liver masses: characterization with diffusion-weighted echo-planar MR imaging. Radiology. 1997;204:739–744. doi: 10.1148/radiology.204.3.9280252. [DOI] [PubMed] [Google Scholar]
- 49.Chan JH, Tsui E, Luk S, Fung A, Yuen M, Szeto M, Cheung Y, Wong K. Diffusion-weighted MR imaging of the liver: distinguishing hepatic abscess from cystic or necrotic tumor. Abdom Imaging. 2001;26:161–165. doi: 10.1007/s002610000122. [DOI] [PubMed] [Google Scholar]
- 50.Taouli B, Vilgrain V, Dumont E, Daire JL, Fan B, Menu Y. Evaluation of liver diffusion isotropy and characterization of focal hepatic lesions with two single-shot echo-planar MR imaging sequences: prospective study in 66 patients. Radiology. 2003;226:71–78. doi: 10.1148/radiol.2261011904. [DOI] [PubMed] [Google Scholar]
- 51.Goshima S, Kanematsu M, Kondo H, Yokoyama R, Kajita K, Tsuge Y, Watanabe H, Shiratori Y, Onozuka M, Moriyama N. Diffusion-weighted imaging of the liver: Optimizing b value for the detection and characterization of benign and malignant hepatic lesions. J Magn Reson Imaging. 2008;28:691–697. doi: 10.1002/jmri.21467. [DOI] [PubMed] [Google Scholar]
- 52.Löwenthal D, Zeile M, Lim W, Wybranski C, Fischbach F, Wieners G, Pech M, Kropf S, Ricke J, Dudeck O. Detection and characterisation of focal liver lesions in colorectal carcinoma patients: comparison of diffusion-weighted and Gd-EOB-DTPA enhanced MR imaging. Eur Radiol. 2011;21:832–840. doi: 10.1007/s00330-010-1977-2. [DOI] [PubMed] [Google Scholar]
- 53.Kamel IR, Liapi E, Reyes DK, Zahurak M, Bluemke DA, Geschwind JF. Unresectable hepatocellular carcinoma: serial early vascular and cellular changes after transarterial chemoembolization as detected with MR imaging. Radiology. 2009;250:466–473. doi: 10.1148/radiol.2502072222. [DOI] [PMC free article] [PubMed] [Google Scholar]
- 54.Schraml C, Schwenzer NF, Martirosian P, Bitzer M, Lauer U, Claussen CD, Horger M. Diffusion-weighted MRI of advanced hepatocellular carcinoma during sorafenib treatment: initial results. AJR Am J Roentgenol. 2009;193:W301–W307. doi: 10.2214/AJR.08.2289. [DOI] [PubMed] [Google Scholar]
- 55.Maksimovic O, Schraml C, Hartmann JT, Bitzer M, Claussen CD, Pintoffl J, Horger M. Evaluation of response in malignant tumors treated with the multitargeted tyrosine kinase inhibitor sorafenib: a multitechnique imaging assessment. AJR Am J Roentgenol. 2010;194:5–14. doi: 10.2214/AJR.09.2744. [DOI] [PubMed] [Google Scholar]
- 56.Geschwind JF, Artemov D, Abraham S, Omdal D, Huncharek MS, McGee C, Arepally A, Lambert D, Venbrux AC, Lund GB. Chemoembolization of liver tumor in a rabbit model: assessment of tumor cell death with diffusion-weighted MR imaging and histologic analysis. J Vasc Interv Radiol. 2000;11:1245–1255. doi: 10.1016/s1051-0443(07)61299-8. [DOI] [PubMed] [Google Scholar]
- 57.Kamel IR, Bluemke DA, Eng J, Liapi E, Messersmith W, Reyes DK, Geschwind JF. The role of functional MR imaging in the assessment of tumor response after chemoembolization in patients with hepatocellular carcinoma. J Vasc Interv Radiol. 2006;17:505–512. doi: 10.1097/01.RVI.0000200052.02183.92. [DOI] [PubMed] [Google Scholar]
- 58.Kamel IR, Bluemke DA, Ramsey D, Abusedera M, Torbenson M, Eng J, Szarf G, Geschwind JF. Role of diffusion-weighted imaging in estimating tumor necrosis after chemoembolization of hepatocellular carcinoma. AJR Am J Roentgenol. 2003;181:708–710. doi: 10.2214/ajr.181.3.1810708. [DOI] [PubMed] [Google Scholar]
- 59.Kamel IR, Reyes DK, Liapi E, Bluemke DA, Geschwind JF. Functional MR imaging assessment of tumor response after 90Y microsphere treatment in patients with unresectable hepatocellular carcinoma. J Vasc Interv Radiol. 2007;18:49–56. doi: 10.1016/j.jvir.2006.10.005. [DOI] [PubMed] [Google Scholar]
- 60.Mannelli L, Kim S, Hajdu CH, Babb JS, Clark TW, Taouli B. Assessment of tumor necrosis of hepatocellular carcinoma after chemoembolization: diffusion-weighted and contrast-enhanced MRI with histopathologic correlation of the explanted liver. AJR Am J Roentgenol. 2009;193:1044–1052. doi: 10.2214/AJR.08.1461. [DOI] [PubMed] [Google Scholar]
- 61.Deng J, Miller FH, Rhee TK, Sato KT, Mulcahy MF, Kulik LM, Salem R, Omary RA, Larson AC. Diffusion-weighted MR imaging for determination of hepatocellular carcinoma response to yttrium-90 radioembolization. J Vasc Interv Radiol. 2006;17:1195–1200. doi: 10.1097/01.RVI.0000227234.81718.EB. [DOI] [PubMed] [Google Scholar]
- 62.Rhee TK, Naik NK, Deng J, Atassi B, Mulcahy MF, Kulik LM, Ryu RK, Miller FH, Larson AC, Salem R. Tumor response after yttrium-90 radioembolization for hepatocellular carcinoma: comparison of diffusion-weighted functional MR imaging with anatomic MR imaging. J Vasc Interv Radiol. 2008;19:1180–1186. doi: 10.1016/j.jvir.2008.05.002. [DOI] [PubMed] [Google Scholar]
- 63.Le Bihan D, Breton E, Lallemand D, Aubin ML, Vignaud J, Laval-Jeantet M. Separation of diffusion and perfusion in intravoxel incoherent motion MR imaging. Radiology. 1988;168:497–505. doi: 10.1148/radiology.168.2.3393671. [DOI] [PubMed] [Google Scholar]
- 64.Le Bihan D, Turner R. The capillary network: a link between IVIM and classical perfusion. Magn Reson Med. 1992;27:171–178. doi: 10.1002/mrm.1910270116. [DOI] [PubMed] [Google Scholar]
- 65.Lemke A, Schad L, Stieltjes B, Laun F. Evidence for a vascular contribution to the biexponential signal decay as a function of the b-value in DWI: A verification of the IVIM-model. In; Preceedings 17th scientific meeting, International Society of Magnetic Resonance in Medicine. 2009:P1365. [Google Scholar]
- 66.Yamada I, Aung W, Himeno Y, Nakagawa T, Shibuya H. Diffusion coefficients in abdominal organs and hepatic lesions: evaluation with intravoxel incoherent motion echo-planar MR imaging. Radiology. 1999;210:617–623. doi: 10.1148/radiology.210.3.r99fe17617. [DOI] [PubMed] [Google Scholar]
- 67.Moteki T, Horikoshi H, Oya N, Aoki J, Endo K. Evaluation of hepatic lesions and hepatic parenchyma using diffusion-weighted reordered turboFLASH magnetic resonance images. J Magn Reson Imaging. 2002;15:564–572. doi: 10.1002/jmri.10101. [DOI] [PubMed] [Google Scholar]
- 68.Lewin M, Fartoux L, Vignaud A, Arrivé L, Menu Y, Rosmorduc O. The diffusion-weighted imaging perfusion fraction f is a potential marker of sorafenib treatment in advanced hepatocellular carcinoma: a pilot study. Eur Radiol. 2011;21:281–290. doi: 10.1007/s00330-010-1914-4. [DOI] [PubMed] [Google Scholar]
- 69.Kim TK, Lee KH, Jang HJ, Haider MA, Jacks LM, Menezes RJ, Park SH, Yazdi L, Sherman M, Khalili K. Analysis of gadobenate dimeglumine-enhanced MR findings for characterizing small (1–2-cm) hepatic nodules in patients at high risk for hepatocellular carcinoma. Radiology. 2011;259:730–738. doi: 10.1148/radiol.11101549. [DOI] [PubMed] [Google Scholar]
- 70.Di Martino M, Marin D, Guerrisi A, Baski M, Galati F, Rossi M, Brozzetti S, Masciangelo R, Passariello R, Catalano C. Intraindividual comparison of gadoxetate disodium-enhanced MR imaging and 64-section multidetector CT in the Detection of hepatocellular carcinoma in patients with cirrhosis. Radiology. 2010;256:806–816. doi: 10.1148/radiol.10091334. [DOI] [PubMed] [Google Scholar]
- 71.Vander Elst L, Maton F, Laurent S, Seghi F, Chapelle F, Muller RN. A multinuclear MR study of Gd-EOB-DTPA: comprehensive preclinical characterization of an organ specific MRI contrast agent. Magn Reson Med. 1997;38:604–614. doi: 10.1002/mrm.1910380415. [DOI] [PubMed] [Google Scholar]
- 72.Kitao A, Zen Y, Matsui O, Gabata T, Kobayashi S, Koda W, Kozaka K, Yoneda N, Yamashita T, Kaneko S, et al. Hepatocellular carcinoma: signal intensity at gadoxetic acid-enhanced MR Imaging–correlation with molecular transporters and histopathologic features. Radiology. 2010;256:817–826. doi: 10.1148/radiol.10092214. [DOI] [PubMed] [Google Scholar]
- 73.Bartolozzi C, Crocetti L, Lencioni R, Cioni D, Della Pina C, Campani D. Biliary and reticuloendothelial impairment in hepatocarcinogenesis: the diagnostic role of tissue-specific MR contrast media. Eur Radiol. 2007;17:2519–2530. doi: 10.1007/s00330-007-0602-5. [DOI] [PubMed] [Google Scholar]
- 74.Kudo M, Izumi N, Kokudo N, Matsui O, Sakamoto M, Nakashima O, Kojiro M, Makuuchi M. Management of hepatocellular carcinoma in Japan: Consensus-Based Clinical Practice Guidelines proposed by the Japan Society of Hepatology (JSH) 2010 updated version. Dig Dis. 2011;29:339–364. doi: 10.1159/000327577. [DOI] [PubMed] [Google Scholar]
- 75.Kudo M. The 2008 Okuda lecture: Management of hepatocellular carcinoma: from surveillance to molecular targeted therapy. J Gastroenterol Hepatol. 2010;25:439–452. doi: 10.1111/j.1440-1746.2009.06207.x. [DOI] [PubMed] [Google Scholar]
- 76.Kitao A, Matsui O, Yoneda N, Kozaka K, Shinmura R, Koda W, Kobayashi S, Gabata T, Zen Y, Yamashita T, et al. The uptake transporter OATP8 expression decreases during multistep hepatocarcinogenesis: correlation with gadoxetic acid enhanced MR imaging. Eur Radiol. 2011;21:2056–2066. doi: 10.1007/s00330-011-2165-8. [DOI] [PubMed] [Google Scholar]
- 77.Suh YJ, Kim MJ, Choi JY, Park YN, Park MS, Kim KW. Differentiation of hepatic hyperintense lesions seen on gadoxetic acid-enhanced hepatobiliary phase MRI. AJR Am J Roentgenol. 2011;197:W44–52. doi: 10.2214/AJR.10.5845. [DOI] [PubMed] [Google Scholar]
- 78.Kambadakone AR, Sahani DV. Body perfusion CT: technique, clinical applications, and advances. Radiol Clin North Am. 2009;47:161–178. doi: 10.1016/j.rcl.2008.11.003. [DOI] [PubMed] [Google Scholar]
- 79.Ippolito D, Sironi S, Pozzi M, Antolini L, Invernizzi F, Ratti L, Leone EB, Fazio F. Perfusion CT in cirrhotic patients with early stage hepatocellular carcinoma: assessment of tumor-related vascularization. Eur J Radiol. 2010;73:148–152. doi: 10.1016/j.ejrad.2008.10.014. [DOI] [PubMed] [Google Scholar]
- 80.Ippolito D, Capraro C, Casiraghi A, Cestari C, Sironi S. Quantitative assessment of tumour associated neovascularisation in patients with liver cirrhosis and hepatocellular carcinoma: role of dynamic-CT perfusion imaging. Eur Radiol. 2011 doi: 10.1007/s00330-011-2307-z. [DOI] [PubMed] [Google Scholar]
- 81.Li JP, Zhao DL, Jiang HJ, Huang YH, Li DQ, Wan Y, Liu XD, Wang JE. Assessment of tumor vascularization with functional computed tomography perfusion imaging in patients with cirrhotic liver disease. Hepatobiliary Pancreat Dis Int. 2011;10:43–49. doi: 10.1016/s1499-3872(11)60006-4. [DOI] [PubMed] [Google Scholar]
- 82.Motosugi U, Ichikawa T, Sou H, Morisaka H, Sano K, Araki T. Multi-organ perfusion CT in the abdomen using a 320-detector row CT scanner: Preliminary results of perfusion changes in the liver, spleen, and pancreas of cirrhotic patients. Eur J Radiol. 2012 doi: 10.1016/j.ejrad.2011.11.054. [DOI] [PubMed] [Google Scholar]
- 83.Goh V, Padhani AR. Imaging tumor angiogenesis: functional assessment using MDCT or MRI? Abdom Imaging. 2006;31:194–199. doi: 10.1007/s00261-005-0387-4. [DOI] [PubMed] [Google Scholar]
- 84.Pandharipande PV, Krinsky GA, Rusinek H, Lee VS. Perfusion imaging of the liver: current challenges and future goals. Radiology. 2005;234:661–673. doi: 10.1148/radiol.2343031362. [DOI] [PubMed] [Google Scholar]
- 85.Van Beers BE, Leconte I, Materne R, Smith AM, Jamart J, Horsmans Y. Hepatic perfusion parameters in chronic liver disease: dynamic CT measurements correlated with disease severity. AJR Am J Roentgenol. 2001;176:667–673. doi: 10.2214/ajr.176.3.1760667. [DOI] [PubMed] [Google Scholar]
- 86.Okada M, Kim T, Murakami T. Hepatocellular nodules in liver cirrhosis: state of the art CT evaluation (perfusion CT/volume helical shuttle scan/dual-energy CT, etc.) Abdom Imaging. 2011;36:273–281. doi: 10.1007/s00261-011-9684-2. [DOI] [PubMed] [Google Scholar]
- 87.Kudo M, Hatanaka K, Inoue T, Maekawa K. Depiction of portal supply in early hepatocellular carcinoma and dysplastic nodule: value of pure arterial ultrasound imaging in hepatocellular carcinoma. Oncology. 2010;78((suppl 1)):60–67. doi: 10.1159/000315232. [DOI] [PubMed] [Google Scholar]
- 88.Matsui O, Gabata T, Kobayashi S, Terayama N, Sanada J, Kouda W, Kawashima H. Imaging of multistep human hepatocarcinogenesis. Hepatol Res. 2007;37((suppl 2)):S200–S205. doi: 10.1111/j.1872-034X.2007.00185.x. [DOI] [PubMed] [Google Scholar]
- 89.Kudo M. Multistep human hepatocarcinogenesis: correlation of imaging with pathology. J Gastroenterol. 2009;44((suppl 19)):112–118. doi: 10.1007/s00535-008-2274-6. [DOI] [PubMed] [Google Scholar]
- 90.Stankovic Z, Csatari Z, Deibert P, Euringer W, Blanke P, Kreisel W, Abdullah Zadeh Z, Kallfass F, Langer M, Markl M. Normal and Altered Three-dimensional Portal Venous Hemodynamics in Patients with Liver Cirrhosis. Radiology. 2012;262:862–873. doi: 10.1148/radiol.11110127. [DOI] [PubMed] [Google Scholar]
- 91.Sahani DV, Holalkere NS, Mueller PR, Zhu AX. Advanced hepatocellular carcinoma: CT perfusion of liver and tumor tissue–initial experience. Radiology. 2007;243:736–743. doi: 10.1148/radiol.2433052020. [DOI] [PubMed] [Google Scholar]
- 92.Zhu AX, Holalkere NS, Muzikansky A, Horgan K, Sahani DV. Early antiangiogenic activity of bevacizumab evaluated by computed tomography perfusion scan in patients with advanced hepatocellular carcinoma. Oncologist. 2008;13:120–125. doi: 10.1634/theoncologist.2007-0174. [DOI] [PubMed] [Google Scholar]
- 93.Petralia G, Fazio N, Bonello L, D'Andrea G, Radice D, Bellomi M. Perfusion computed tomography in patients with hepatocellular carcinoma treated with thalidomide: initial experience. J Comput Assist Tomogr. 2011;35:195–201. doi: 10.1097/RCT.0b013e31820ccf51. [DOI] [PubMed] [Google Scholar]
- 94.Jiang T, Kambadakone A, Kulkarni NM, Zhu AX, Sahani DV. Monitoring response to antiangiogenic treatment and predicting outcomes in advanced hepatocellular carcinoma using image biomarkers, CT perfusion, tumor density, and tumor size (RECIST) Invest Radiol. 2012;47:11–17. doi: 10.1097/RLI.0b013e3182199bb5. [DOI] [PubMed] [Google Scholar]
- 95.Meijerink MR, van Waesberghe JH, van der Weide L, van den Tol P, Meijer S, Comans EF, Golding RP, van Kuijk C. Early detection of local RFA site recurrence using total liver volume perfusion CT initial experience. Acad Radiol. 2009;16:1215–1222. doi: 10.1016/j.acra.2009.03.023. [DOI] [PubMed] [Google Scholar]
- 96.Choi SH, Chung JW, Kim HC, Baek JH, Park CM, Jun S, Kim MU, Lee ES, Cho HR, Jae HJ, et al. The role of perfusion CT as a follow-up modality after transcatheter arterial chemoembolization: an experimental study in a rabbit model. Invest Radiol. 2010;45:427–436. doi: 10.1097/RLI.0b013e3181e07516. (Note: Kim, Hyo-Choel [corrected to Kim, Hyo-Cheol]). [DOI] [PubMed] [Google Scholar]
- 97.Yang L, Zhang XM, Zhou XP, Tang W, Guan YS, Zhai ZH, Dong GL. Correlation between tumor perfusion and lipiodol deposition in hepatocellular carcinoma after transarterial chemoembolization. J Vasc Interv Radiol. 2010;21:1841–1846. doi: 10.1016/j.jvir.2010.08.015. [DOI] [PubMed] [Google Scholar]
- 98.Ippolito D, Bonaffini PA, Ratti L, Antolini L, Corso R, Fazio F, Sironi S. Hepatocellular carcinoma treated with transarterial chemoembolization: dynamic perfusion-CT in the assessment of residual tumor. World J Gastroenterol. 2010;16:5993–6000. doi: 10.3748/wjg.v16.i47.5993. [DOI] [PMC free article] [PubMed] [Google Scholar]
- 99.Ronot M, Asselah T, Paradis V, Michoux N, Dorvillius M, Baron G, Marcellin P, Van Beers BE, Vilgrain V. Liver fibrosis in chronic hepatitis C virus infection: differentiating minimal from intermediate fibrosis with perfusion CT. Radiology. 2010;256:135–142. doi: 10.1148/radiol.10091295. [DOI] [PubMed] [Google Scholar]
- 100.Choi BI. Advances of imaging for hepatocellular carcinoma. Oncology. 2010;78((suppl 1)):46–52. doi: 10.1159/000315230. [DOI] [PubMed] [Google Scholar]
- 101.Martinsen AC, Saether HK, Hol PK, Olsen DR, Skaane P. Iterative reconstruction reduces abdominal CT dose. Eur J Radiol. 2011 doi: 10.1016/j.ejrad.2011.04.021. [DOI] [PubMed] [Google Scholar]
- 102.Prakash P, Kalra MK, Kambadakone AK, Pien H, Hsieh J, Blake MA, Sahani DV. Reducing abdominal CT radiation dose with adaptive statistical iterative reconstruction technique. Invest Radiol. 2010;45:202–210. doi: 10.1097/RLI.ob013e3181dzfeec. [DOI] [PubMed] [Google Scholar]
- 103.Mitsumori LM, Shuman WP, Busey JM, Kolokythas O, Koprowicz KM. Adaptive statistical iterative reconstruction versus filtered back projection in the same patient: 64 channel liver CT image quality and patient radiation dose. Eur Radiol. 2012;22:138–143. doi: 10.1007/s00330-011-2186-3. [DOI] [PubMed] [Google Scholar]
- 104.Kim KW, Lee JM, Klotz E, Park HS, Lee DH, Kim JY, Kim SJ, Kim SH, Lee JY, Han JK, et al. Quantitative CT color mapping of the arterial enhancement fraction of the liver to detect hepatocellular carcinoma. Radiology. 2009;250:425–434. doi: 10.1148/radiol.2501072196. [DOI] [PubMed] [Google Scholar]
- 105.Joo I, Lee JM, Kim KW, Klotz E, Han JK, Choi BI. Liver metastases on quantitative color mapping of the arterial enhancement fraction from multiphasic CT scans: evaluation of the hemodynamic features and correlation with the chemotherapy response. Eur J Radiol. 2011;80:e278–e283. doi: 10.1016/j.ejrad.2010.12.002. [DOI] [PubMed] [Google Scholar]
- 106.Kang SE, Lee JM, Klotz E, Kim KW, Kim JH, Han JK, Choi BI. Quantitative color mapping of the arterial enhancement fraction in patients with diffuse liver disease. AJR Am J Roentgenol. 2011;197:876–883. doi: 10.2214/AJR.10.5943. [DOI] [PubMed] [Google Scholar]
- 107.Kim KW, Lee JM, Kim JH, Klotz E, Kim HC, Han JK, Choi BI. CT color mapping of the arterial enhancement fraction of VX2 carcinoma implanted in rabbit liver: comparison with perfusion CT. AJR Am J Roentgenol. 2011;196:102–108. doi: 10.2214/AJR.09.3971. [DOI] [PubMed] [Google Scholar]
- 108.O'Connor JP, Jackson A, Parker GJ, Jayson GC. DCE-MRI biomarkers in the clinical evaluation of antiangiogenic and vascular disrupting agents. Br J Cancer. 2007;96:189–195. doi: 10.1038/sj.bjc.6603515. [DOI] [PMC free article] [PubMed] [Google Scholar]
- 109.Steingoetter A, Menne D, Braren RF. Assessing antiangiogenic therapy response by DCE-MRI: development of a physiology driven multi-compartment model using population pharmacometrics. PLoS ONE. 2011;6:e26366. doi: 10.1371/journal.pone.0026366. [DOI] [PMC free article] [PubMed] [Google Scholar]
- 110.Ippolito D, Sironi S, Pozzi M, Antolini L, Ratti L, Alberzoni C, Leone EB, Meloni F, Valsecchi MG, Fazio F. Hepatocellular carcinoma in cirrhotic liver disease: functional computed tomography with perfusion imaging in the assessment of tumor vascularization. Acad Radiol. 2008;15:919–927. doi: 10.1016/j.acra.2008.02.005. [DOI] [PubMed] [Google Scholar]
- 111.Koh TS, Thng CH, Hartono S, Tai BC, Rumpel H, Ong AB, Sukri N, Soo RA, Wong CI, Low AS, et al. A comparative study of dynamic contrast-enhanced MRI parameters as biomarkers for anti-angiogenic drug therapy. NMR Biomed. 2011;24:1169–1180. doi: 10.1002/nbm.1680. [DOI] [PubMed] [Google Scholar]
- 112.Kelly RJ, Rajan A, Force J, Lopez-Chavez A, Keen C, Cao L, Yu Y, Choyke P, Turkbey B, Raffeld M, et al. Evaluation of KRAS mutations, angiogenic biomarkers, and DCE-MRI in patients with advanced non-small-cell lung cancer receiving sorafenib. Clin Cancer Res. 2011;17:1190–1199. doi: 10.1158/1078-0432.CCR-10-2331. [DOI] [PMC free article] [PubMed] [Google Scholar]
- 113.Hahn OM, Yang C, Medved M, Karczmar G, Kistner E, Karrison T, Manchen E, Mitchell M, Ratain MJ, Stadler WM. Dynamic contrast-enhanced magnetic resonance imaging pharmacodynamic biomarker study of sorafenib in metastatic renal carcinoma. J Clin Oncol. 2008;26:4572–4578. doi: 10.1200/JCO.2007.15.5655. [DOI] [PMC free article] [PubMed] [Google Scholar]
- 114.Mita MM, Spear MA, Yee LK, Mita AC, Heath EI, Papadopoulos KP, Federico KC, Reich SD, Romero O, Malburg L, et al. Phase 1 first-in-human trial of the vascular disrupting agent plinabulin(NPI-2358) in patients with solid tumors or lymphomas. Clin Cancer Res. 2010;16:5892–5899. doi: 10.1158/1078-0432.CCR-10-1096. [DOI] [PubMed] [Google Scholar]
- 115.Ricart AD, Ashton EA, Cooney MM, Sarantopoulos J, Brell JM, Feldman MA, Ruby KE, Matsuda K, Munsey MS, Medina G, et al. A phase I study of MN-029 (denibulin), a novel vascular-disrupting agent, in patients with advanced solid tumors. Cancer Chemother Pharmacol. 2011;68:959–970. doi: 10.1007/s00280-011-1565-4. [DOI] [PubMed] [Google Scholar]
- 116.Baar J, Silverman P, Lyons J, Fu P, Abdul-Karim F, Ziats N, Wasman J, Hartman P, Jesberger J, Dumadag L, et al. A vasculature-targeting regimen of preoperative docetaxel with or without bevacizumab for locally advanced breast cancer: impact on angiogenic biomarkers. Clin Cancer Res. 2009;15:3583–3590. doi: 10.1158/1078-0432.CCR-08-2917. [DOI] [PMC free article] [PubMed] [Google Scholar]
- 117.Hsu C, Yang TS, Huo TI, Hsieh RK, Yu CW, Hwang WS, Hsieh TY, Huang WT, Chao Y, Meng R, et al. Vandetanib in patients with inoperable hepatocellular carcinoma: A phase II, randomized, double-blind, placebo-controlled study. J Hepatol. 2012 doi: 10.1016/j.jhep.2011.12.013. [DOI] [PubMed] [Google Scholar]
- 118.Yau T, Chen PJ, Chan P, Curtis CM, Murphy PS, Suttle AB, Gauvin J, Hodge JP, Dar MM, Poon RT. Phase I dose-finding study of pazopanib in hepatocellular carcinoma: evaluation of early efficacy, pharmacokinetics, and pharmacodynamics. Clin Cancer Res. 2011;17:6914–6923. doi: 10.1158/1078-0432.CCR-11-0793. [DOI] [PubMed] [Google Scholar]
- 119.Hsu CY, Shen YC, Yu CW, Hsu C, Hu FC, Hsu CH, Chen BB, Wei SY, Cheng AL, Shih TT. Dynamic contrast-enhanced magnetic resonance imaging biomarkers predict survival and response in hepatocellular carcinoma patients treated with sorafenib and metronomic tegafur/uracil. J Hepatol. 2011;55:858–865. doi: 10.1016/j.jhep.2011.01.032. [DOI] [PubMed] [Google Scholar]
- 120.Yopp AC, Schwartz LH, Kemeny N, Gultekin DH, Gonen M, Bamboat Z, Shia J, Haviland D, D'Angelica MI, Fong Y, et al. Antiangiogenic therapy for primary liver cancer: correlation of changes in dynamic contrast-enhanced magnetic resonance imaging with tissue hypoxia markers and clinical response. Ann Surg Oncol. 2011;18:2192–2199. doi: 10.1245/s10434-011-1570-1. [DOI] [PMC free article] [PubMed] [Google Scholar]
- 121.Jarnagin WR, Schwartz LH, Gultekin DH, Gonen M, Haviland D, Shia J, D'Angelica M, Fong Y, Dematteo R, Tse A, et al. Regional chemotherapy for unresectable primary liver cancer: results of a phase II clinical trial and assessment of DCE-MRI as a biomarker of survival. Ann Oncol. 2009;20:1589–1595. doi: 10.1093/annonc/mdp029. [DOI] [PMC free article] [PubMed] [Google Scholar]
- 122.Braren R, Altomonte J, Settles M, Neff F, Esposito I, Ebert O, Schwaiger M, Rummeny E, Steingoetter A. Validation of preclinical multiparametric imaging for prediction of necrosis in hepatocellular carcinoma after embolization. J Hepatol. 2011;55:1034–1040. doi: 10.1016/j.jhep.2011.01.049. [DOI] [PubMed] [Google Scholar]
- 123.Skovorda A, Klishko A, Gusakian D, Maevskii E, Ermilova V, Oranskaia G, Sarvazian A. Quantitative analysis of mechanical characteristics of pathologically altered soft biological tissues. Biofizika. 1995;40:1335. [PubMed] [Google Scholar]
- 124.Yeh WC, Li PC, Jeng YM, Hsu HC, Kuo PL, Li ML, Yang PM, Lee PH. Elastic modulus measurements of human liver and correlation with pathology. Ultrasound Med Biol. 2002;28:467–474. doi: 10.1016/s0301-5629(02)00489-1. [DOI] [PubMed] [Google Scholar]
- 125.Castera L, Forns X, Alberti A. Non-invasive evaluation of liver fibrosis using transient elastography. J Hepatol. 2008;48:835–847. doi: 10.1016/j.jhep.2008.02.008. [DOI] [PubMed] [Google Scholar]
- 126.D'Onofrio M, Gallotti A, Mucelli RP. Tissue quantification with acoustic radiation force impulse imaging: measurement repeatability and normal values in the healthy liver. AJR Am J Roentgenol. 2010;195:132–136. doi: 10.2214/AJR.09.3923. [DOI] [PubMed] [Google Scholar]
- 127.Bavu É, Gennisson JL, Couade M, Bercoff J, Mallet V, Fink M, Badel A, Vallet-Pichard AĻ, Nalpas B, Tanter M. Noninvasive In Vivo Liver Fibrosis Evaluation Using Supersonic Shear Imaging: A Clinical Study on 113 Hepatitis C Virus Patients. Ultrasound in medicine & biology. 2011 doi: 10.1016/j.ultrasmedbio.2011.05.016. [DOI] [PubMed] [Google Scholar]
- 128.Cho SH, Lee JY, Han JK, Choi BI. Acoustic radiation force impulse elastography for the evaluation of focal solid hepatic lesions: preliminary findings. Ultrasound Med Biol. 2010;36:202–208. doi: 10.1016/j.ultrasmedbio.2009.10.009. [DOI] [PubMed] [Google Scholar]
- 129.Gallotti A, D'Onofrio M, Romanini L, Cantisani V, Pozzi Mucelli R. Acoustic Radiation Force Impulse (ARFI) ultrasound imaging of solid focal liver lesions. European Journal of Radiology. 2011 doi: 10.1016/j.ejrad.2010.12.071. [DOI] [PubMed] [Google Scholar]
- 130.Heide R, Strobel D, Bernatik T, Goertz R. Characterization of focal liver lesions (FLL) with acoustic radiation force impulse (ARFI) elastometry. Ultraschall Med. 2010;31:405. doi: 10.1055/s-0029-1245565. [DOI] [PubMed] [Google Scholar]
- 131.Kwon HJ, Kang MJ, Cho JH, Oh JY, Nam KJ, Han SY, Lee SW. Acoustic radiation force impulse elastography for hepatocellular carcinoma-associated radiofrequency ablation. World Journal of Gastroenterology. 2011;17:1874. doi: 10.3748/wjg.v17.i14.1874. [DOI] [PMC free article] [PubMed] [Google Scholar]
- 132.Manduca A, Oliphant T, Dresner M, Mahowald J, Kruse S, Amromin E, Felmlee J, Greenleaf J, Ehman R. Magnetic resonance elastography: non-invasive mapping of tissue elasticity. Med Image Anal. 2001;5:237–254. doi: 10.1016/s1361-8415(00)00039-6. [DOI] [PubMed] [Google Scholar]
- 133.Muthupillai R, Lomas D, Rossman P, Greenleaf J, Manduca A, Ehman R. Magnetic resonance elastography by direct visualization of propagating acoustic strain waves. Science. 1995;269:1854–1857. doi: 10.1126/science.7569924. [DOI] [PubMed] [Google Scholar]
- 134.Venkatesh SK, Yin M, Glockner JF, Takahashi N, Araoz PA, Talwalkar JA, Ehman RL. MR elastography of liver tumors: preliminary results. AJR Am J Roentgenol. 2008;190:1534–1540. doi: 10.2214/AJR.07.3123. [DOI] [PMC free article] [PubMed] [Google Scholar]
- 135.Doblas S, Garteiser P, Haddad N, Daire J, Wagner M, Leitao H, Vilgrain V, Sinkus R, Van Beers B. Magnetic resonance elastography measurements of viscosity: a novel biomarker for human hepatic tumor malignancy? In Proc. Intl. Soc. Reson. Med. 2011;19:389. [Google Scholar]
- 136.Bensamoun SF, Wang L, Robert L, Charleux F, Latrive JP, Ho Ba Tho MC. Measurement of liver stiffness with two imaging techniques: magnetic resonance elastography and ultrasound elastometry. J Magn Reson Imaging. 2008;28:1287–1292. doi: 10.1002/jmri.21523. [DOI] [PubMed] [Google Scholar]