

Abstract
Leptin deficiency in mice results in chronic thymic atrophy, suppressed cell-mediated immunity, and decreased numbers of total lymphocytes, suggesting a key role for the metabolic hormone leptin in regulating thymopoiesis and overall immune homeostasis. The thymus unfortunately is highly susceptible to stress-induced acute involution. Prolonged thymus atrophy in stress situations can contribute to peripheral T cell deficiency or inhibit immune reconstitution. Little is known however about specific roles for leptin signaling in the thymus or the underlying mechanisms driving thymic involution or thymic recovery after acute stress. We report here that leptin receptor expression is restricted in thymus to medullary epithelial cells. Using a model of endotoxemia-induced acute thymic involution and recovery, we have demonstrated a role for supraphysiologic leptin in protection of thymic epithelial cells. We also present data in support of our hypothesis that leptin treatment decreases in vivo endotoxemia-induced apoptosis of double positive thymocytes and promotes proliferation of double negative thymocytes through a leptin receptor isoform b-specific mechanism. Furthermore, our studies have revealed that leptin treatment increases thymic expression of IL-7, an important soluble thymocyte growth factor produced by medullary thymic epithelial cells. Taken together, these studies support an intrathymic role for the metabolic hormone leptin in maintaining healthy thymic epithelium and promoting thymopoiesis, which is revealed when thymus homeostasis is perturbed by endotoxemia.
Keywords: Thymopoiesis, Leptin, Leptin Receptor, Lipopolysaccharride
Introduction
The neuro-endocrine hormone leptin is known to have many roles, including regulating insulin sensitivity and reproductive function, but is most extensively characterized for its critical function as a satiety hormone (Harris, 2000). Interestingly, mice with naturally occurring mutations in leptin (ob/ob mice) or membrane-bound leptin receptor (db/db mice) also suggest a role for leptin in immune function. Leptin-deficient ob/ob mice exhibit chronic thymic atrophy, suppressed cell-mediated immunity, and decreased numbers of total lymphocytes (Howard et al., 1999). Leptin receptor-deficient db/db mice also exhibit chronic thymic atrophy and suppressed peripheral immune responses (Mandel and Mahmoud, 1978).
New insights into the role of leptin in immunity are now emerging, and generally define leptin in the immune system as promoting phagocytosis, development of T helper 1 (Th1) cells, and general inflammation (Fantuzzi and Faggioni, 2000). Leptin has also been shown to play a role in autoimmune disorders by enhancing autoimmune dysregulation through increased Th1 type immune responses (Matarese et al., 2007) and inhibition of T regulatory cells (De Rosa et al., 2007). Leptin receptors (OBR) have been identified on human NK cells (Zhao et al., 2003), monocytes (Najib and Sanchez-Margalet, 2002), mature peripheral T lymphocytes (Maccarrone et al., 2003), bone marrow cells (Gainsford et al., 1996), and on murine peripheral T cells, B cells, and monocytes/macrophages (Papathanassoglou et al., 2006). Alternative splicing occurs during translation of the leptin receptor gene and results in multiple isoforms. The long OBRb isoform is the only isoform capable of biologically functional signaling (Bjorbaek et al., 1997). Leptin receptor-deficient db/db mice have a mutation truncating OBRb into a non-signaling short isoform variant, thus rendering db/db mice incapable of responding to leptin (Ahima and Osei, 2004).
Stress-induced acute thymic atrophy is a complication accompanying many infections, such as bacterial sepsis and HIV/AIDS, and is also seen in restraint, starvation, clinical preparative regimens for stem cell transplant, and cancer treatments (Wang et al., 1994; Howard et al., 1999; Haynes et al., 2000; Wang et al., 2007; Wang et al., 2009). Thymus involution results in reduced output of naïve T cells and constriction of the T cell repertoire, thus leaving the host potentially vulnerable to infection. Despite a number of efforts to blunt thymic atrophy with agents such as keratinocyte growth factor (KGF) or anti-osteopontin antibodies (Min et al., 2002; Wang et al., 2009), currently there are no clinically available treatments to protect against acute thymus involution. Moreover, little is known about the mechanisms that drive thymic involution and recovery. Lipopolysaccharide (LPS)-induced thymus atrophy is a useful model to study the mechanisms involved in thymic involution and recovery (Gruver and Sempowski, 2008). Systemic LPS challenge results in a rise in plasma corticosterone levels and a pro-inflammatory cytokine cascade, which contribute to thymic involution via the preferential loss of double positive (DP) thymocytes and characteristic remodeling of thymic stromal architecture (Hick et al., 2006; Gruver and Sempowski, 2008). The interplay between the supporting stromal environment and developing thymocytes has been well-described in the literature to be crucial for robust thymopoiesis to occur (Manley, 2000). Several studies utilizing bone marrow chimeras have speculated that leptin receptor expression on radio-resistant thymus stroma may be important for thymic homeostasis during endocrine dysfunction (i.e. hypercorticosteronemia) (Palmer et al., 2006; Trotter-Mayo and Roberts, 2008).
We have previously reported that leptin has therapeutic potential in this endotoxemia-induced thymic atrophy model, which was partially mediated by the blunting of systemic corticosteroid and cytokine responses (Hick et al., 2006). These observations led to our current hypothesis that additional intrathymic mechanisms are involved. In the present study we investigated intrathymic mechanisms of leptin-mediated protection from endotoxemia-induced thymic involution in both thymic stromal and lymphoid compartments. We report herein that leptin receptor isoform expression in the thymus is restricted to medullary epithelial cells, and describe the novel intrathymic effects of leptin on thymic epithelial cell subset content and thymopoiesis. Overall, these findings suggest a physiological role for intrathymic leptin signaling in thymus for regulating both thymic epithelium and T cell development in settings of acute stress-induced thymic involution.
Materials & Methods
Experimental animals, treatments, and reagents
Female C57BL/6 and leptin receptor-deficient db/db mice (8–12 weeks old) were purchased from Jackson Laboratory. Female BALB/c mice (8–12 weeks old) were purchased from Charles River. All mice were housed in a specific pathogen-free environment with 12-hour light/dark cycles at 20 – 25°C in accordance with all Duke University IACUC-approved animal protocols. Escherichia coli-derived LPS (100 ug) (L-2880, Sigma-Aldrich) and/or mouse recombinant leptin (1 ug/g body weight) (OB-497, R&D Systems) were simultaneously administered by intraperitoneal injection (Jamieson et al.). Animals were pulsed with 1 mg bromodeoxyuridine (BrdU) (BD Biosciences) one hour prior to harvest. Mice were euthanized in a pre-charged CO2 chamber for 10 minutes followed by cervical dislocation. Thymus tissue was removed, weighed, one half placed in RPMI 1640 (Invitrogen) with 5% (v/v) fetal calf serum (Hyclone) and one half snap frozen. Enriched thymus stromal fractions were obtained by vigorously pipetting sliced thymus in 10 mL RPMI 1640 (3X) to remove the majority of thymocytes (Gray et al., 2002).
Quantitative Reverse Transcriptase PCR (qRT-PCR) for leptin receptor isoforms
Total RNA was extracted using Trizol Reagent (Invitrogen) and quantified by spectrophotometry (260 nm). RNA was cleaned with RNeasy Mini Kit (Qiagen). Primer and probe sequences for leptin receptor isoforms a, b, c, were previously reported (Cohen et al., 2005). Primer and probe sequences for GAPDH were: Forward primer (5’-AAT GTG TCC GTC GTG GAT CTG-3’); reverse primer (5’-CAA CCT GGT CCT CAG TGT AGC’3’); probe (5’-TXRD-GGT GCC GCC TGG AGA AAC CTG-BHQ-1–3’). qRT-PCR was done per manufacturer’s protocol using One Step iScript kit for probes (BioRad). Briefly, primers and probes (100 nM) and 250 ng/well total RNA were combined with reverse transcriptase and iTaq. Cycle conditions were 10 minutes (50°C), 5 minutes (95°C), 45 PCR cycles of 95°C (15 seconds) and 55°C (1 minute). BioRad iCycler IQ detected and quantified amplified product present based on FAM or TXRD fluorescence. Cycle threshold (Ct) values of the leptin receptor steady-state transcript levels were normalized to GAPDH as previously described (Lambert et al., 2003). Ct values over 40 cycles (normalized Ct > 20.0) were considered non-significant as per assay controls. Fold-change was calculated with sample and housekeeping gene Ct values using the GeneX excel macro (BioRad).
Immunofluorescent staining of tissue and isolated cells
Thymus tissue was removed from BALB/c mice as described above and embedded in O.C.T. Tissue Tek medium (Sakura). Freshly isolated thymocytes or 3T3-L1 cells were resuspended in 8% BSA in PBS to a final concentration of 0.6 × 10⁶ cells/mL and centrifuged at 600 rpm for 5 minutes onto a microscope slide using Cytospin3 (Shandon/Lipshaw).
Slides (spun cells or 5 µm sections) were fixed for 2 minutes in ice cold acetone (−20°C) and air dried. Sections were blocked in PBS/1% (w/v) BSA and incubated with polyclonal biotinylated goat anti-leptin receptor antibody (BAF497, R&D Systems), anti-IA/IE-PE (MHC Class II) (557000, BD Biosciences), anti-CD11c–PE (12–0114, ebioscience), and rabbit anti-cytokeratin 5 (Covance, Berkeley, CA). Streptavidin-APC or Streptavidin-FITC (BD Biosciences) and anti-rabbit-FITC (Southern Biotech) were used as secondary antibodies. Polyclonal goat-IgG-biotin (R&D Systems) and secondary antibody alone were used as controls. 4',6-diamidino-2-phenylindole (DAPI) (Anaspec) was used at 1 ug/mL. Analysis was performed with the Nikon Eclipse TE2000-E and NIS Elements 2.0 software (Nikon Instruments Inc) in the DHVI Light Microscopy Shared Resource (Durham NC).
Lymphocyte isolation, flow cytometry, and cell sorting
Thymus tissue was teased to a single-cell suspension through a 70 µm cell strainer (BD Labware) in tissue medium. Cells were centrifuged at 1,500 rpm for 5 minutes and resuspended in tissue medium for cell counts using a Coulter Z1 dual threshold cell counter (Coulter). Direct immunofluorescence staining was performed with anti-mouse directly-conjugated monoclonal antibodies: anti-CD3 FITC, anti-CD4 PE-TXRD, and anti-CD8 PerCP-Cy5 (BD Biosciences) as previously described (Hick et al., 2006). Data were acquired on a BD LSRII and analyzed with FlowJo software (TreeStar, Inc., DHVI Research Flow Cytometry Facility, Durham, NC). For apoptosis/proliferation assessment, cells were either permeabolized and stained with anti-active caspase 3 PE and anti-BrdU APC or stained for Annexin V/7AAD per manufacturer’s protocol (BD Biosciences) and immediately acquired on BD FACS CANTO and analyzed with FlowJo software. Thymocytes were sorted on a BD FACS Aria to >95% purity based on CD4/CD8 expression off a CD3 gate. 3T3-L1 cells (ATCC CL-173) were grown at 37°C, 10% CO2 in DMEM (Sigma-Aldrich) with 10% Bovine Calf Serum (Sigma). Total thymocytes and 3T3-L1 cells were stained with anti-leptin receptor antibody or isotype control.
Thymic epithelial cell isolation and flow cytometry
Thymic epithelial cells were isolated as previously described (Gray et al., 2002). Ten million cells were stained with anti-CD45.2-FITC, anti-IA/IE-PE (BD Biosciences), and anti-Ly-51-AF647 (Biolegend). Data were acquired on BD FACS CANTO and analyzed with FlowJo software.
qRT-PCR for cytokine transcripts
Total RNA was extracted and quantified as described above. Primers used for murine interleukin-7 (mIL-7) were: forward primer (5’-TGT ACT GAT GAT CAG CAT CGA TGA-3’); reverse primer (5’-GTA AGT GGA CAT TGA ATT CTT CAC TGA TAT-3’). Primers used for murine KGF were: forward primer (5’-AAG GGA CCC AGG AGA TGA AGA A-3’); reverse primer (5’-GAA GTT GCA ATC CTC ATT GCA TT-3’). GAPDH primers were as above. qRT-PCR was done per manufacturer’s protocol using the One Step iScript kit SYBR Green system (BioRad). Briefly, primers (100 nM) and 500 ng/well total RNA were combined with reverse transcriptase, iTaq, and SYBR Green reporter dye. The cycle conditions were 50°C (10 minutes), 95°C (5 minutes), followed by 40 cycles at 95°C for 10 sec, and 55°C for 30 sec. Final cycles were 95°C (1 minute), 55°C (1 minute) and 95°C for 15 seconds. A melt curve analysis was done starting at 55°C with the temperature increasing by 0.5°C every 10 sec. A single fluorescence peak was analyzed and Ct values obtained.
Quantitative PCR (qPCR) for mouse signal joint TCR delta excision circles (mTREC)
Molecules of mouse genomic TCRD TREC were quantified in whole thymus DNA extracts by real-time PCR using a standard curve of known number of molecules of mouse (m) TREC, specific primers and fluorescent probe as previously described (Sempowski et al., 2002).
Statistics
For animal studies, two-tailed Student’s t test was employed to compare the means between data sets. For qRT-PCR experiments, a non-parametric Kruskal-Wallis test was used to determine significance of differences between normalized Ct values. Differences were considered significant with p ≤ 0.05.
Results
Leptin receptor isoforms are expressed within the murine thymus
To determine which leptin receptor isoforms were present in thymus, qRT-PCR on thymic RNA was performed for three leptin receptor isoforms: the short isoforms OBRa and OBRc and the long isoform OBRb. Steady-state mRNA transcripts for all three isoforms were detected (Table I).We next determined if leptin receptor gene expression was differentially expressed between the thymic lymphoid compartment (thymocytes) and stromal compartment. Short isoforms were detectable in both thymocytes and enriched stroma (Table I). Long isoform (OBRb) was expressed in enriched stroma, but below detection in isolated thymocytes (Table I), suggesting OBRb expression in freshly isolated total thymocytes is exceedingly low or negative.
Table I.
| OBRa | OBRb | OBRc | |
|---|---|---|---|
| Whole Thymus | 10.52 ± 0.71 | 18.08 ± 1.04 | 11.92 ± 2.59 |
| Enriched Thymus Stromal Fraction | 5.15 ± 1.03 | 12.92 ± 0.73 | 8.60 ± 0.71 |
| Thymocyte Fraction | 15.78 ± 2.59 | > 20.0 | 11.05 ± 0.95 |
| CD4+ SP Thymocytes | 17.53 ± 2.43 | > 20.0 | 10.53 ± 0.31 |
| CD4+CD8+ (DP) Thymocytes | 18.59 ± 1.41 | > 20.0 | 9.67 ± 0.72 |
| CD8+ SP Thymocytes | 18.87 ± 1.38 | > 20.0 | 10.28 ± 1.23 |
| CD4-CD8- (DN) Thymocytes | 16.83 ± 1.89 | > 20.0 | 11.70 ± 1.85 |
Cycle Threshold (Ct) values normalized to GAPDH (mean ± SD, n = 3)
Normalized Ct values > 20.0 correlate to OBR Ct values > 40.0 cycles, and are considered to be undetectable.
Comparative expression of leptin receptor isoform steady-state mRNA among thymic compartments was determined using the relative quantification method (2−ΔΔCt method) (Livak and Schmittgen, 2001). The fold-change in leptin receptor gene expression in thymocyte and stromal fractions were calculated and compared to the expression level of whole thymus whose expression level was set equal to 1.0 (Fig. 1). OBRa was primarily expressed in the thymic stromal compartment, with levels in the enriched stromal fraction 50-fold higher than whole thymus (Fig. 1 A). OBRa expression was 80-fold higher in whole thymus than isolated thymocytes (Fig. 1 A). Similar expression patterns were seen with OBRb gene expression, where OBRb expression in enriched stromal fraction was nearly 30-fold greater than whole thymus (Fig. 1 B). OBRb expression was 6-fold lower in thymocytes than whole thymus (Fig. 1 B). Expression levels of OBRc were not significantly different between lymphoid and stromal compartments (Fig. 1 C).
Figure 1. Leptin receptor (OBR) gene expression is greater in thymus stroma than thymus lymphoid compartment.

Fold-change of OBRa (A), OBRb (B), and OBRc (C) steady-state mRNA isoform gene expression in thymocytes and thymic stroma fractions compared to whole thymus (Set to 1). Data presented are mean ± SD from three mice per group. *p ≤ 0.05, stromal fraction versus thymocyte fraction.
Although OBRb gene expression was exceedingly low or negative in the bulk thymocyte fraction, it is possible that transcripts could be limited to a particular thymocyte developmental subset. Therefore, we also determined the expression profile of leptin receptor isoforms among individual thymocyte developmental subsets (Table I). Steady-state mRNA for OBRa was detected in all FACS-sorted thymocyte subsets, as were steady-state mRNA levels of OBRc (Table I). Consistent with our findings in the mixed thymocyte population, Ct values for OBRb were below the lower limit of detection in each thymocyte developmental subset (Table I). Taken together, these data showed mouse thymus expresses both long and short OBR isoforms at varying levels. OBRa and OBRb are differentially expressed among lymphoid and stromal compartments, with significantly high steady-state levels of gene expression in the thymus stromal compartment.
Leptin receptor protein expression is restricted to medullary thymus stroma
Immunofluorescence was next used to specifically identify leptin receptor protein distribution in freshly isolated murine thymus tissue. Figure 2 is a representative thymus section from one of three young mice. Individual nuclei of thymocytes are visualized with DAPI (blue). Areas of cortex, distinguished by bright areas that are densely populated with thymocytes, and areas of medulla, distinguished by darker areas with diffuse lymphocyte distribution, are easily visualized (Fig. 2 A). The medullary thymic epithelial cell marker K5 (green) visualizes a light lacy pattern consistent with a mesh-like network of epithelial cells containing cytokeratin intermediate filaments (Fig. 2 B). Leptin receptor isoform-specific reagents are not available for histology; therefore all isoforms of the leptin receptor are visualized in red (Fig. 2 C). Leptin receptor (red) staining localizes to K5+ medullary regions (Fig. 2 D and E). Figure 2 F shows leptin receptor expression at higher magnification. No staining is seen when an isotype control primary antibody is used (Fig. 2 G).
Figure 2. Leptin receptor (OBR) protein expression is restricted to thymic medullary epithelial cells.
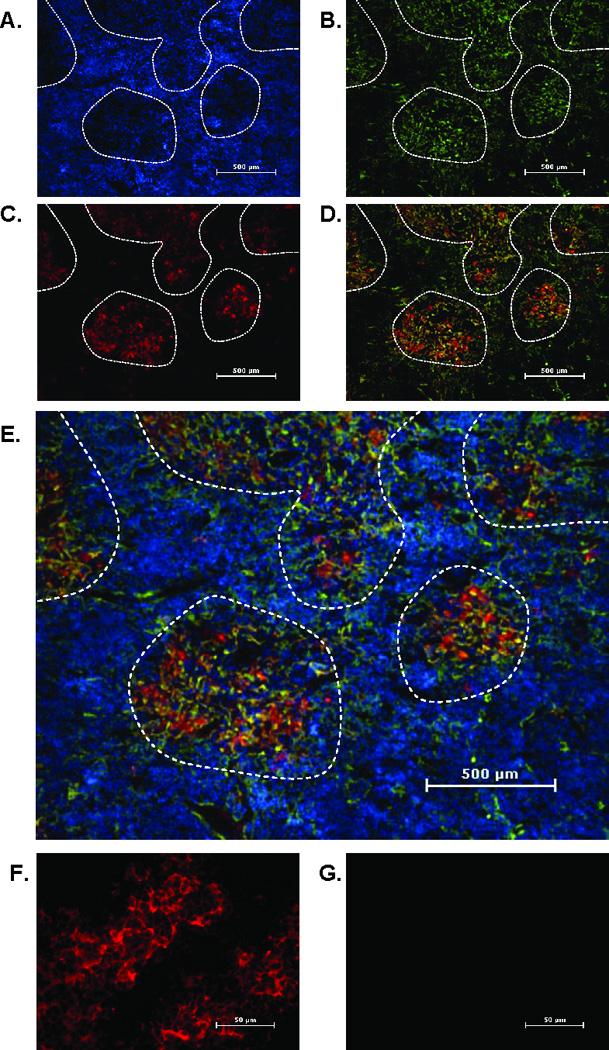
Frozen thymus sections from 12 week old mice were stained with an mTEC marker, cytokeratin 5 (K5) (green), and leptin receptor (pan marker, red). Nuclei were stained with DAPI (blue). Panels depict staining for DAPI (A), cytokeratin 5 (B), leptin receptor (C), leptin receptor and K5 overlay (D) and leptin receptor and K5 overlay with DAPI (E). Final magnification 40X. Areas of medulla are outlined by dashed line. Final magnification 400X shows leptin receptor (red) (F) or isotype control antibody (G). Representative section from five mice per group.
Analysis of these sections suggested no detectable leptin receptor protein on thymocytes. To investigate this further, freshly isolated thymocytes were stained for leptin receptor and compared to a positive control cell line (3T3-L1 cells) (Figure 3 A, C, and E). Purified thymocytes (DAPI+) do not show detectable protein levels either by flow cytometry (Fig. 3 B) or by immunofluorescence (Fig. 3, D and F). Taken together, these data indicated that leptin receptor protein expression in the thymus is restricted to the stromal compartment and is low or negative on developing thymocytes.
Figure 3. Leptin receptor (OBR) protein expression is not detectable on thymocytes.

Representative flow cytometry analysis of mouse 3T3-L1 cells (positive control) (A) and isolated thymocytes from 12 week old mice (B) stained for leptin receptor (open curve) or isotype control (shaded curve). Cytospin preparation of 3T3-L1 cells (C, E) or isolated thymocytes (D, F) stained for the leptin receptor (red) and with the nuclear stain DAPI (blue). Final magnification 100X. Representative of three mice per group.
To further define leptin receptor expression on cell types found in thymus stroma (i.e. medulla), we stained fresh sections for MHC Class II, a cell surface receptor expressed on thymic epithelial cells (TECs). Figure 4 A shows MHC Class II (red) in thymus, and the staining pattern is consistent with a cellular surface marker, which is distinct from the more diffuse, lacy pattern of staining seen with K5 staining (green) (Fig. 4 B). The merge of MHC Class II and K5 staining in figure 4 C shows areas of co-expression (yellow), but also distinct areas of separate staining (red and green). These distinct areas of separate staining are most likely due to the different cellular location of MHC Class II (cell surface) and K5 (intracellular).
Figure 4. Leptin receptor (OBR) colocalized to MHC Class II+ thymic epithelial cells but not thymic dendritic cells.
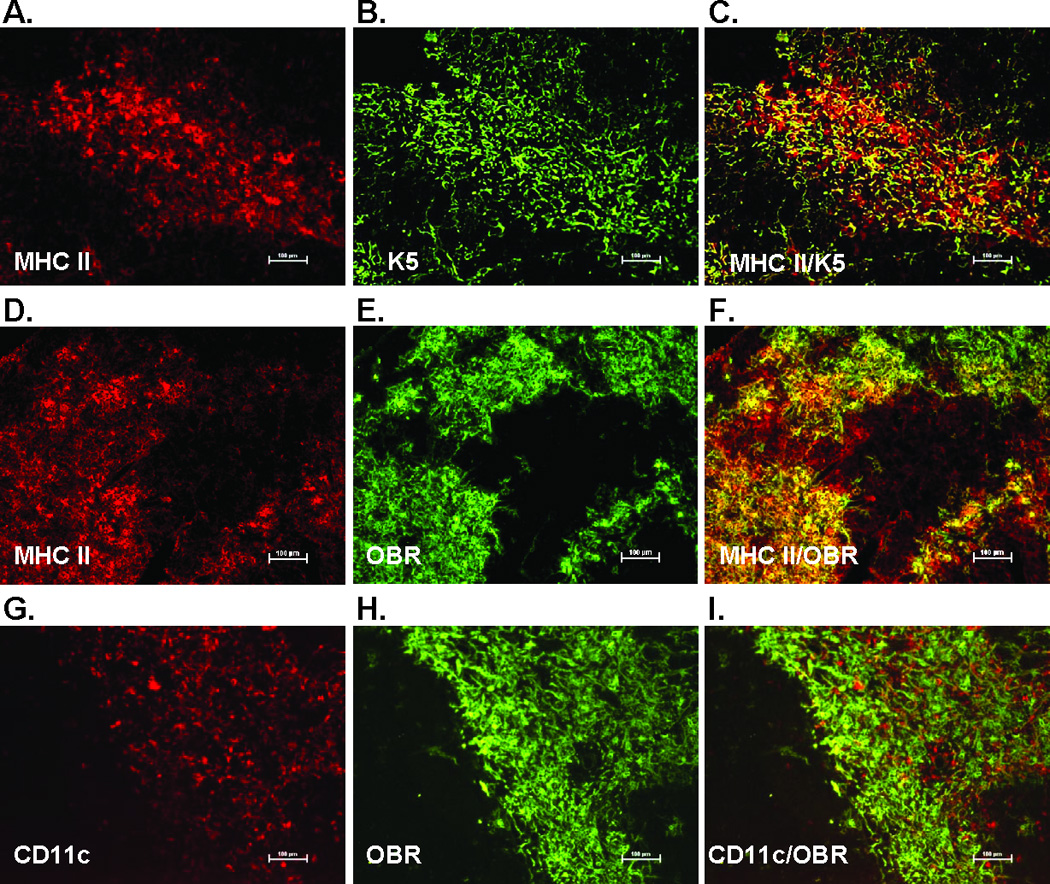
Frozen thymus sections from 12 week old mice were stained with the thymic epithelial cell marker K5, MHC Class II (red) cytokeratin 5 (K5)(green), dendritic cell marker CD11c (red), and leptin receptor (pan marker, green). Final magnification 100X. Representative section from three mice per group.
We next looked to see if leptin receptor expression colocalized with MHC Class II in the thymus medulla. MHC Class II (red) and leptin receptor (green) have similar expression patterns (Fig 4. D and E). The merge in figure 4 F shows the colocalization of the majority of these two markers (yellow), indicating leptin receptor is expressed on TECs. Since MHC Class II is also expressed on dendritic cells in addition to TECs, we stained for the pan dendritic cell marker CD11c. Staining patterns for thymic CD11c (red) are clearly distinct from leptin receptor staining patterns (green) and do not colocalize, demonstrating that thymic dendritic cells do not express leptin receptor (Fig. 4 G – I). Taken together with the observation that leptin receptor expression is restricted to areas of thymic medulla, these findings strongly suggested that leptin receptor is expressed specifically on medullary TECs (mTECs).
Leptin protects against loss of thymic epithelial cell populations during stress-induced acute thymic atrophy
Having established OBRb gene expression is restricted to mTECs, we next determined if leptin treatment could modulate thymus architecture and TEC content during recovery from endotoxemia-induced acute thymic atrophy. Mice were injected with saline or leptin with or without simultaneous lipopolysaccharide (LPS) challenge. Histologic analysis of snap-frozen thymus was used to define cortical and medullary regions of the thymus seven days post challenge (Fig. 5 A). Consistent with our expectations for stress-induced acute thymic atrophy, LPS treatment disrupted the distinction between cortex and medulla seen both by hematoxylin and eosin (H&E) (Fig. 5 A) and DAPI staining (Fig. 5 B). Leptin alone had no impact, but was able to fully restore thymus architecture in the LPS thymic atrophy stress model within seven days (Fig. 5 A and B). Distinct areas of cortex and medulla in leptin-treated stressed mice can be seen by both H&E (Fig. 5 A) and DAPI staining (Fig. 5 B).
Figure 5. Leptin-mediated protection of thymic stroma during LPS challenge.
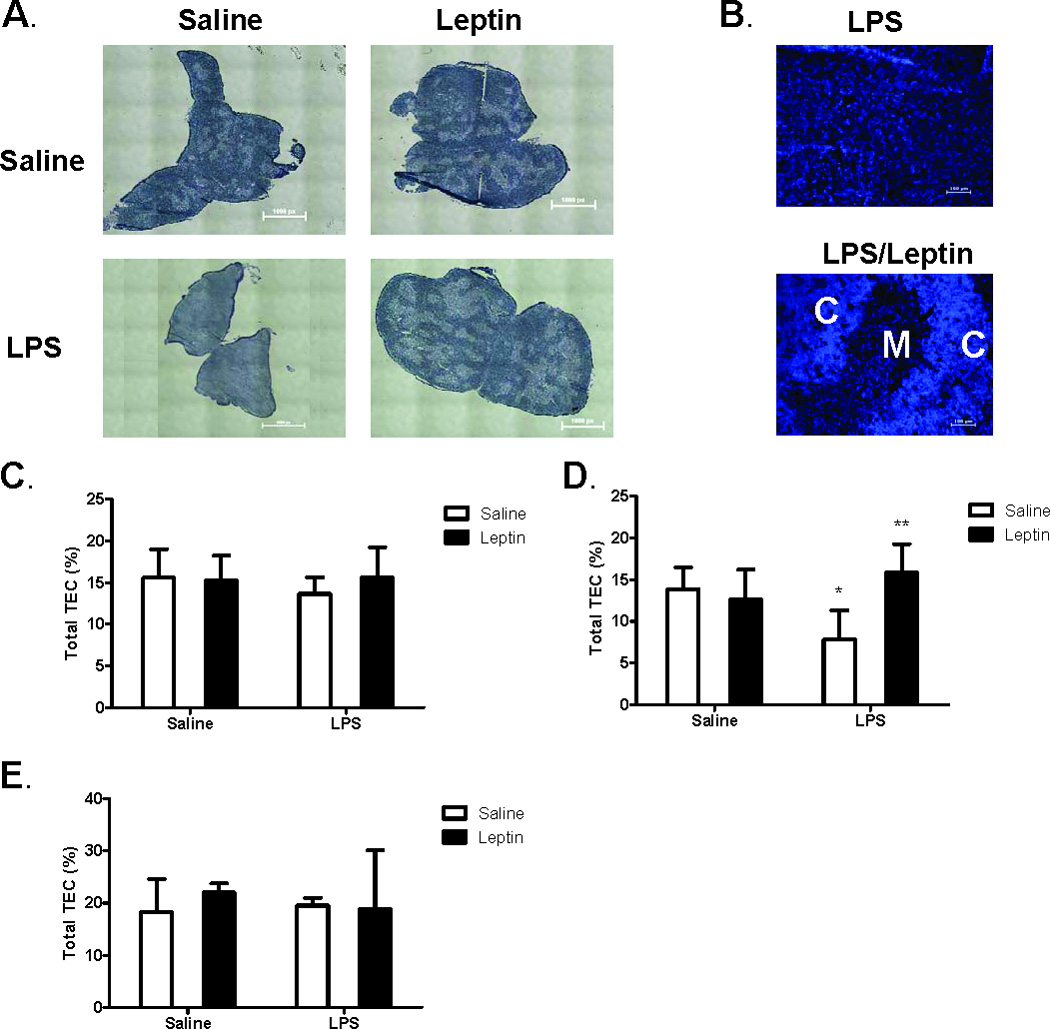
Female C57BL/6 mice were administered either saline or leptin (1 µg/g body weight, IP) and simultaneously challenged with either saline or E. coli LPS (100 µg/mouse, IP). Hematoxylin and Eosin staining of representative thymus sections (A) seven days post treatment. Whole tissue stitched image, total magnification (40X). Calibration 1.61 µm equals 1.0 pixels. DAPI staining of thymocyte nuclei (B) depict distinct areas of cortex (C) and medulla (M). Total magnification (100X). Frequency of thymic epithelial cells (MHC Class II+ cells) in CD45- stromal cell population one day (C), three days (D), and seven days (E) post treatment. Data presented are mean ± SD from four mice per group. * p ≤ 0.05 compared with saline-treated controls. ** p ≤ 0.05 compared with LPS-treated controls.
We next determined if leptin in our LPS model could impact the different cell types in the thymus stromal compartment. Total cells from digested whole thymus tissue were stained with anti-CD45 to exclude cells of hematopoietic origin from analysis. MHC Class II (MHC II) was used to identify thymic epithelial cells (TEC), and Ly-51 was used to differentiate between cortical and medullary TECs (Gray et al., 2006). Supplemental Figure 1 shows the flow cytometric gating strategy used to analyze these cell populations. No significant changes were seen in frequency of total TECs (CD45-, MHC II+) with LPS treatment at one day or seven days post challenge (Fig. 5 C and E). LPS modestly, yet significantly, decreased the frequency of total TECs three days post challenge (Fig. 5 D). Leptin alone had no effect on the frequency of total TECs, but simultaneous leptin was found to protect against the LPS-induced decrease in total TEC frequency three days post LPS challenge (Fig. 5 D).
To further investigate this observation, absolute number of total TECs per thymus was calculated at this time point (Day 3). LPS significantly decreased the absolute number of total TEC per thymus three days post challenge (Fig. 6 A). Leptin alone had no effect on the number of total TECs, but leptin partially protected against the LPS-induced reduction in total TEC number per thymus (Fig. 6 A). We hypothesized that because leptin receptor expression was localized to the thymic medulla, mTECs might be more sensitive to leptin-mediated protection against LPS-induced thymic atrophy. To test this hypothesis, total cortical (CD45-, MHC Class II+, Ly-51+) and total medullary (CD45-, MHC Class II+, Ly-51- ) TEC numbers were determined. Similar to total TEC numbers per thymus in figure 6 A, LPS challenge significantly decreased both total cortical and medullary TEC populations. LPS-treated mice had 1.02 ± 0.50 × 10⁴ cortical TECs (cTECs) versus 16.06 ± 3.01 × 10⁴ cTECs in saline-treated mice (p = 0.0004) and 2.21 ± 0.41 × 10⁴ mTECs versus 19.28 ± 1.78 × 10⁴ mTECs in saline-treated mice (p = 0.00002). Focusing specifically on the effects of leptin in the context of LPS damage, figure 6 B shows simultaneous leptin significantly boosted mTEC numbers three days post treatment. Leptin slightly increased cTEC numbers compared to LPS alone, these changes were not statistically significant (Fig. 6 B). Leptin alone had no effect on cTEC or mTEC numbers (data not shown). Additionally, gene expression of the long isoform leptin receptor (OBRb) was determined 8 hours post challenge. LPS stress resulted in a significant 6-fold decrease in OBRb mRNA steady-state levels (data not shown). While leptin treatment alone had no effect, expression levels in leptin-treated LPS-challenged mice were not statistically different from saline alone or leptin alone controls, suggesting that OBRb expression is maintained in leptin-treated mice during LPS challenge (data not shown). These data indicated that medullary TECs are more sensitive to the protective effects of leptin during LPS-induced stromal damage. These findings support our hypothesis that medullary TECs play a preferential role in mediating the thymo-protective effects of leptin in LPS-induced acute thymic atrophy.
Figure 6. Leptin-mediated protection of thymic epithelial cells during LPS challenge.

Female C57BL/6 mice were administered either saline or leptin (1 µg/g body weight, IP) and simultaneously challenged with either saline or E. coli LPS (100 µg/mouse, IP). Total number of thymic epithelial cells (CD45-, MHC Class II+) three days post treatment (A). Total number of cTEC (CD45-, MHC Class II+, Ly-51+) and mTEC (CD45-, MHC Class II+, Ly-51-) cells three days post treatment (B). Data presented are mean ± SD from four mice per group. * p ≤ 0.05 compared with saline-treated controls. ** p ≤ 0.05 compared with LPS-treated controls.
OBRb-dependent mechanism of leptin modulation of thymocyte proliferation and apoptosis during LPS-induced thymic involution
Given an absence of detectable leptin receptor expression on thymocytes themselves in our study (Figure 2 and 3, Table I), we hypothesized that leptin may have an indirect impact on thymopoiesis in this acute atrophy model due to its strong role in maintaining the thymic stromal compartment. As stress-induced loss of developing thymocytes is a major hallmark of acute thymic atrophy, we therefore determined the effect of leptin on the thymic lymphoid compartment. Mice were injected simultaneously with saline or leptin with or without LPS challenge. Eight out of ten mice were fully responsive to LPS as determined by loss of thymus weight, cellularity, and T Cell Receptor (TCR) alpha gene rearrangement (89, 294 ± 18,530 mTREC/mg thymus in LPS-treated mice versus 216,776 ± 87,222 mTREC/mg thymus in saline-treated mice, p = 0.051, and data not shown). As expected for this well-described model, we observed a loss of DP thymocyte frequency with LPS treatment (Fig. 7 A) (Gruver and Sempowski, 2008). While leptin treatment alone had no effect, leptin given concurrently with LPS challenge significantly blocked the loss in frequency of DP thymocytes (Fig. 7 A). We also observed a previously un-described significant increase in frequency of DN thymocytes with leptin treatment in the context of LPS damage (p = 0.024 vs. LPS alone controls) (Fig. 7 B).
Figure 7. Leptin-induced thymic protection is characterized by increased thymocyte proliferation and decreased thymocyte apoptosis.

Female C57BL/6 mice were administered either saline or leptin (1 µg/g body weight, IP) and simultaneously challenged with either saline or E. coli LPS (100 µg/mouse, IP). Frequency of DP thymocytes (A) and frequency of DN thymocytes (B) were determined one and three days post treatment, respectively. Frequency of DN thymocytes positive for BrdU (C) was determined three days post treatment. Frequency of DP thymocytes positive for active caspase 3 was determined in C57BL/6 (D) or db/db (E) mice one day post treatment. Percent reduction of active caspase 3-positive cells in LPS challenged mice with leptin treatment in C57BL/6 and db/db mouse strains (F). Data presented are mean ± SD from five mice per group.* p ≤ 0.05 compared with saline-treated controls. ** p ≤ 0.05 compared with LPS-treated controls.
We hypothesized that these indirect effects on developing thymocytes were due in part to either stimulation of thymocyte proliferation or protection from apoptosis in the complex thymic microenvironment (i.e. stroma/thymocytes). We speculated that both mechanisms were occurring in the thymus, and that this effect would be dependent on the long isoform the leptin receptor (OBRb). To test this hypothesis, we treated C57BL/6 and leptin receptor-deficient db/db mice (C57BL/6 background, lack OBRb) with saline or leptin with or without concurrent LPS challenge and assessed thymocyte proliferation and apoptosis. LPS treatment significantly reduced the frequency of BrdU+ proliferating cells in the DN compartment three days post treatment (Fig. 7 C). This effect was significantly blunted with leptin administration, suggesting a positive role for leptin in promoting or maintaining DN cell proliferation (Fig 7 C). LPS was found to also increase the frequency of active caspase 3-positive (Fig. 7 D) DP thymocytes in C57BL/6 mice. This is consistent with DP thymocytes being acutely sensitive to LPS- and corticosteroid-induced apoptosis (Kato et al., 1995). Leptin significantly inhibited the increase in DP thymocyte apoptosis induced by LPS, thus demonstrating a positive role for leptin in inhibiting DP cell apoptosis (Fig. 7 D). Anti-apoptotic effects of leptin on thymocytes were further confirmed with an alternative approach using Annexin V/7AAD staining (data not shown).
In leptin receptor-deficient db/db mice, leptin did not impact the LPS-induced rise of active caspase 3-positive DP thymocytes (Fig. 7 E), nor did leptin impact DN thymocyte proliferation (data not shown). In comparison, leptin decreased the LPS-induced active caspase 3 response by 87% in wild-type C57BL/6 mice whereas in leptin receptor-deficient db/db mice there was no significant change observed in active caspase 3 levels with simultaneous leptin treatment (Fig. 7 F). Together these data supported our hypothesis that leptin-mediated protection of the thymus during times of stress is OBRb-dependent.
Leptin modulation of IL-7 mRNA transcripts
We hypothesized an mTEC-derived soluble factor could be mediating effects observed in the thymic lymphoid compartment, so we next assessed gene expression levels of two soluble factors, IL-7 and KGF. IL-7, an essential cytokine for thymocyte development and survival, is produced predominantly by mTECs in the adult thymus (Zamisch et al., 2005). KGF acts on thymic epithelial cells and is produced by fibroblasts and thymocytes, but not mTECs (Rubin et al., 1989; Erickson et al., 2002). LPS significantly reduced IL-7 mRNA steady-state levels 12-fold compared to saline controls (Relative expression = 0.078 ± 0.052, p < 0.001). As predicted, there was no change in KGF mRNA transcript levels in LPS-challenged mice compared to saline controls (data not shown). Leptin alone did not modulate either IL-7 or KGF gene expression. In the setting of LPS-induced thymic damage however, leptin significantly increased expression of thymic-derived IL-7 2-fold over LPS-challenged mice but failed to impact KGF (Relative expression = 0.229 ± 0.110, p = 0.014).
Discussion
Data presented herein provide evidence that the metabolic hormone leptin can mediate protection against loss of thymus stroma and thymopoiesis in an endotoxemia model of acute stress-induced thymic atrophy. We have defined for the first time restricted expression of leptin receptor protein on medullary thymic epithelial cells in young mouse thymus, and the positive effect of leptin on DN thymocyte proliferation. Together, these data support our novel hypothesis that in conjunction with systemic effects (i.e. blunting of corticosterone and inflammatory cytokines), leptin functions intrathymically to preferentially protect against loss of medullary TECs. This contributes to the overall protection of the thymus from endotoxemia-induced damage, which may be extrapolated to other settings of thymic stress and recovery.
These studies addressed the effects of leptin-mediated protection against acute thymic atrophy in two thymic compartments: stromal and lymphoid. The detailed characterization of leptin receptor expression in these thymic compartments was critical to the understanding of putative function of leptin in the thymus. To our knowledge, this is the first report to extensively characterize leptin receptor expression in normal mouse thymus. It has previously been reported that leptin receptor mRNA is detectable in whole thymus extracts (Fujita et al., 2002; Palmer et al., 2006). Our study confirmed these observations, and by using a quantitative isoform-specific approach coupled with multi-color immunofluorescent staining of mouse thymus tissue, leptin receptor expression was shown to be preferentially expressed in the stromal compartment of the thymus, and most likely not expressed on developing thymocytes. Specifically, mRNA expression level of the long signaling leptin receptor isoform (OBRb) was 180-fold higher in the stromal fraction than in the thymocyte fraction. Furthermore, protein expression was observed to be colocalized to medullary TEC populations expressing MHC Class II and cytokeratin 5, and not present on thymocytes, thymic fibroblasts, thymic dendritic cells, or cortical thymic epithelial cells. These data support our hypothesis that both direct and indirect mechanisms of action could be occurring in OBR positive and OBR negative thymic compartments, respectively, during leptin-mediated protection against endotoxemia-induced thymic damage.
Our previous work suggested a partial role for leptin in systemic inhibition of corticosteroid and inflammatory cytokines in this model (Hick et al., 2006). We hypothesized that if leptin was mediating protection of the thymus only via systemic mechanisms, both the cortical and medullary TECs would have equal protection. We found however leptin-mediated protection from LPS-induced loss of TEC to be preferentially in the medullary compartment. While we can not rule out that leptin-mediated systemic factors are having an impact, the absence of a significant protective effect in the OBR-negative cortical TEC population suggested a direct intrathymic effect of leptin on OBR-positive medullary TECs. Therefore, we speculate a medullary TEC-mediated protective effect of leptin is occurring during acute endotoxemia-induced thymic atrophy.
In the lymphoid compartment, we did not detect leptin receptor protein or find detectable levels of RNA for the long signaling leptin receptor isoform (OBRb) on freshly isolated thymocytes. We did however observe that systemic leptin treatment protected against LPS-induced apoptosis of DP thymocytes and promoted or maintained proliferation of DN thymocytes, suggesting an indirect intrathymic mechanism of action for leptin in protection against stress-induced acute thymic atrophy. Moreover, we found using leptin receptor-deficient db/db mice, that the long OBRb isoform is necessary for these thymo-protective roles. These observations coupled with the new findings regarding protein expression and preferential protection against loss of medullary TECs support an intrathymic indirect mechanism in which supraphysiologic leptin may affect thymocytes through OBR-positive mTEC cells in a setting of stress-induced thymic atrophy (i.e. endotoxemia).
A limited cytokine analysis showed a 2-fold increase in IL-7 steady-state mRNA which may correlate with increased mTEC cell numbers in our system. The current paradigm is that constitutive levels of thymic IL-7 support a finite number of thymocytes (Fry and Mackall, 2005; Mazzucchelli and Durum, 2007). In the event of thymocyte depletion, such as in the setting of LPS or endotoxin stress, it is thought that more IL-7 is available on a per cell basis, and can signal increased proliferation and differentiation until homeostasis is restored (Fry and Mackall, 2005; Mazzucchelli and Durum, 2007). Therefore, we speculate leptin may be protecting the mTEC population, resulting in increased available IL-7 that in turn is driving DN thymocyte development. These effects may also contribute to the faster regeneration of thymic architecture observed with leptin treatment after endotoxemia-induced damage (Fig. 5 A and B). Future studies involving a full cytokine/growth factor analysis, as well as functional studies into direct effects of leptin on mTEC cytokine production, are needed to identify more soluble factors involved in this mechanism and are beyond the scope of the present study.
While our data indicated an absence of leptin receptor expression on resting thymocytes, a direct effect of leptin on thymocytes cannot be completely ruled out. Studies have shown leptin receptor expression on rat thymocytes (Mansour et al., 2006) and mature peripheral murine lymphocytes (Papathanassoglou et al., 2006). These reports indicate the possibility of induced OBR expression on mature T cells and a direct mechanism of action of leptin on cultured thymocytes, which could be possible through low density leptin receptor expression currently undetectable by flow cytometry or immunofluorescent staining (Fig. 3). Our gene expression analysis on thymocytes (Table I) supports this low-level expression possibility. One report showed leptin treatment to inhibit dexamethasone-induced apoptosis in cultured mouse thymocytes (Howard et al., 1999). This reported responsiveness to leptin suggests the possibility of a direct mechanism of action on thymocytes, but could not be replicated in our laboratory. An elegant study evaluating chimeras between wild-type and leptin receptor-deficient db/db mice found augmented thymus cellularity in wild-type to db/db chimeras, even in the presence of increased corticosterone levels (Trotter-Mayo and Roberts, 2008). These findings suggested that leptin can act peripherally (i.e. not via CNS) on radio-resistant immune cells, and the authors speculated that leptin receptor expression on thymocytes was decreasing thymocyte sensitivity to corticosterone-induced apoptosis, although definitive studies on thymocytes themselves were not conducted. This may explain the effects of leptin we observe on DP thymocyte apoptosis in our LPS model. Future studies however are needed to tease apart these complex possibilities and definitively identify the mechanism of action of leptin affecting DP thymocyte apoptosis.
In summary, we have shown leptin receptor expression is restricted to medullary thymic epithelial cells. Using a murine endotoxin (LPS) model of acute stress-induced thymic involution, we have shown leptin to preferentially protect against LPS-induced loss of medullary TECs. We have demonstrated that leptin can indirectly buffer DP thymocyte apoptosis and promote DN thymocyte proliferation in vivo, which results in restoration of thymus architecture and increased TCR gene rearrangement. Our studies have reported for the first time that these thymo-protective effects are dependent upon the long signaling form of the leptin receptor (OBRb). Together, these data support a model in which leptin can function to protect the thymus gland from stress-induced acute damage by reduction of systemic corticosteroid and pro-inflammatory cytokine responses, and through an intrathymic mechanism orchestrated by medullary thymic epithelial cells and their soluble mediators (e.g. IL-7). These studies suggest a physiological role for leptin signaling in the thymus for maintaining healthy thymic epithelium and promoting thymopoiesis, which is revealed when thymus homeostasis is perturbed by stress.
Supplementary Material
Representative flow plot showing gating on CD45 negative thymic stromal cells (A). Cells were next gated on MHC Class II positive expression (B). Lastly, cells were analyzed by Ly-51 expression to determine cortical (Ly-51+), and medullary (Ly-51-) cell populations (C).
Acknowledgements
This work was supported in part by AG25150, the Regional Biocontainment Laboratory at Duke (AI58607), and the Duke Center for Translational Research (AI51445).
We acknowledge the technical assistance of Ms. Kristina Riebe and Mr. Jeffrey Hale, and the expert input and advice from Drs. Nancy Manley, Pam Fraker, Mark Trottier, Barton F. Haynes and Laura P. Hale. Flow cytometry was performed in the Duke Human Vaccine Institute Research Flow Cytometry Shared Resource, Durham NC.
Abbreviations
- BSA
bovine serum albumin
- DN
double negative
- DP
double positive
- LPS
Lipopolysaccharide
- OBR
leptin receptor
- qRT-PCR
quantitative reverse transcriptase PCR
- qPCR
quantitative PCR
- TEC
thymic epithelial cell
Footnotes
Disclosures
The authors have no financial conflicts of interest.
References
- Ahima RS, Osei SY. Leptin signaling. Physiology and Behavior. 2004;81:223–241. doi: 10.1016/j.physbeh.2004.02.014. [DOI] [PubMed] [Google Scholar]
- Bjorbaek C, Uotani S, da Silva B, Flier JS. Divergent signaling capacities of the long and short isoforms of the leptin receptor. Journal of Biological Chemistry. 1997;272:32686–32695. doi: 10.1074/jbc.272.51.32686. [DOI] [PubMed] [Google Scholar]
- Cohen P, Yang G, Yu X, Soukas AA, Wolfish CS, Friedman JM, Li C. Induction of leptin receptor expression in the liver by leptin and food deprivation. Journal of Biological Chemistry. 2005;280:10034–10039. doi: 10.1074/jbc.M413684200. [DOI] [PubMed] [Google Scholar]
- De Rosa V, Procaccini C, Cali G, Pirozzi G, Fontana S, Zappacosta S, La Cava A, Matarese G. A key role of leptin in the control of regulatory T cell proliferation. Immunity. 2007;26:241–255. doi: 10.1016/j.immuni.2007.01.011. [DOI] [PubMed] [Google Scholar]
- Erickson M, Morkowski S, Lehar S, Gillard G, Beers C, Dooley J, Rubin JS, Rudensky A, Farr AG. Regulation of thymic epithelium by keratinocyte growth factor. Blood. 2002;100:3269–3278. doi: 10.1182/blood-2002-04-1036. [DOI] [PubMed] [Google Scholar]
- Fantuzzi G, Faggioni R. Leptin in the regulation of immunity, inflammation, and hematopoiesis. J Leukoc Biol. 2000;68:437–446. [PubMed] [Google Scholar]
- Fry TJ, Mackall CL. The many faces of IL-7: from lymphopoiesis to peripheral T cell maintenance. J Immunol. 2005;174:6571–6576. doi: 10.4049/jimmunol.174.11.6571. [DOI] [PubMed] [Google Scholar]
- Fujita Y, Murakami M, Ogawa Y, Masuzaki H, Tanaka M, Ozaki S, Nakao K, Mimori T. Leptin inhibits stress-induced apoptosis of T lymphocytes. Clinical and Experimental Immunology. 2002;128:21–26. doi: 10.1046/j.1365-2249.2002.01797.x. [DOI] [PMC free article] [PubMed] [Google Scholar]
- Gainsford T, Willson TA, Metcalf D, Handman E, McFarlane C, Ng A, Nicola NA, Alexander WS, Hilton DJ. Leptin can induce proliferation, differentiation, and functional activation of hemopoietic cells. Proceedings of the National Academy of Sciences U S A. 1996;93:14564–14568. doi: 10.1073/pnas.93.25.14564. [DOI] [PMC free article] [PubMed] [Google Scholar]
- Gray DH, Chidgey AP, Boyd RL. Analysis of thymic stromal cell populations using flow cytometry. Journal of Immunological Methods. 2002;260:15–28. doi: 10.1016/s0022-1759(01)00493-8. [DOI] [PubMed] [Google Scholar]
- Gray DH, Seach N, Ueno T, Milton MK, Liston A, Lew AM, Goodnow CC, Boyd RL. Developmental kinetics, turnover, and stimulatory capacity of thymic epithelial cells. Blood. 2006;108:3777–3785. doi: 10.1182/blood-2006-02-004531. [DOI] [PubMed] [Google Scholar]
- Gruver AL, Sempowski GD. Cytokines, leptin, and stress-induced thymic atrophy. Journal of Leukocyte Biology. 2008;84:915–923. doi: 10.1189/jlb.0108025. [DOI] [PMC free article] [PubMed] [Google Scholar]
- Harris RB. Leptin--much more than a satiety signal. Annual Review of Nutrition. 2000;20:45–75. doi: 10.1146/annurev.nutr.20.1.45. [DOI] [PubMed] [Google Scholar]
- Haynes BF, Markert ML, Sempowski GD, Patel DD, Hale LP. The role of the thymus in immune reconstitution in aging, bone marrow transplantation, and HIV-1 infection. Annual Review of Immunology. 2000;18:529–560. doi: 10.1146/annurev.immunol.18.1.529. [DOI] [PubMed] [Google Scholar]
- Hick RW, Gruver AL, Ventevogel MS, Haynes BF, Sempowski GD. Leptin selectively augments thymopoiesis in leptin deficiency and lipopolysaccharide-induced thymic atrophy. Journal of Immunology. 2006;177:169–176. doi: 10.4049/jimmunol.177.1.169. [DOI] [PMC free article] [PubMed] [Google Scholar]
- Howard JK, Lord GM, Matarese G, Vendetti S, Ghatei MA, Ritter MA, Lechler RI, Bloom SR. Leptin protects mice from starvation-induced lymphoid atrophy and increases thymic cellularity in ob/ob mice. Journal of Clinical Investigation. 1999;104:1051–1059. doi: 10.1172/JCI6762. [DOI] [PMC free article] [PubMed] [Google Scholar]
- Jamieson BD, Douek DC, Killian S, Hultin LE, Scripture-Adams DD, Giorgi JV, Marelli D, Koup RA, Zack JA. Generation of functional thymocytes in the human adult. Immunity. 1999;10:569–575. doi: 10.1016/s1074-7613(00)80056-4. [DOI] [PubMed] [Google Scholar]
- Kato Y, Morikawa A, Sugiyama T, Koide N, Jiang GZ, Takahashi K, Yokochi T. Role of tumor necrosis factor-alpha and glucocorticoid on lipopolysaccharide (LPS)-induced apoptosis of thymocytes. FEMS Immunology and Medical Microbiology. 1995;12:195–204. doi: 10.1111/j.1574-695X.1995.tb00192.x. [DOI] [PubMed] [Google Scholar]
- Lambert AL, Mangum JB, DeLorme MP, Everitt JI. Ultrafine carbon black particles enhance respiratory syncytial virus-induced airway reactivity, pulmonary inflammation, and chemokine expression. Toxicological Sciences. 2003;72:339–346. doi: 10.1093/toxsci/kfg032. [DOI] [PubMed] [Google Scholar]
- Livak KJ, Schmittgen TD. Analysis of relative gene expression data using real-time quantitative PCR and the 2(-Delta Delta C(T)) Method. Methods. 2001;25:402–408. doi: 10.1006/meth.2001.1262. [DOI] [PubMed] [Google Scholar]
- Maccarrone M, Di Rienzo M, Finazzi-Agro A, Rossi A. Leptin activates the anandamide hydrolase promoter in human T lymphocytes through STAT3. Journal of Biological Chemistry. 2003;278:13318–13324. doi: 10.1074/jbc.M211248200. [DOI] [PubMed] [Google Scholar]
- Mandel MA, Mahmoud AA. Impairment of cell-mediated immunity in mutation diabetic mice (db/db) J Immunol. 1978;120:1375–1377. [PubMed] [Google Scholar]
- Manley NR. Thymus organogenesis and molecular mechanisms of thymic epithelial cell differentiation. Seminars in Immunology. 2000;12:421–428. doi: 10.1006/smim.2000.0263. [DOI] [PubMed] [Google Scholar]
- Mansour E, Pereira FG, Araujo EP, Amaral ME, Morari J, Ferraroni NR, Ferreira DS, Lorand-Metze I, Velloso LA. Leptin inhibits apoptosis in thymus through a janus kinase-2-independent, insulin receptor substrate-1/phosphatidylinositol-3 kinase-dependent pathway. Endocrinology. 2006;147:5470–5479. doi: 10.1210/en.2006-0223. [DOI] [PubMed] [Google Scholar]
- Matarese G, Leiter EH, La Cava A. Leptin in autoimmunity: many questions, some answers. Tissue Antigens. 2007;70:87–95. doi: 10.1111/j.1399-0039.2007.00886.x. [DOI] [PubMed] [Google Scholar]
- Mazzucchelli R, Durum SK. Interleukin-7 receptor expression: intelligent design. Nat Rev Immunol. 2007;7:144–154. doi: 10.1038/nri2023. [DOI] [PubMed] [Google Scholar]
- Min D, Taylor PA, Panoskaltsis-Mortari A, Chung B, Danilenko DM, Farrell C, Lacey DL, Blazar BR, Weinberg KI. Protection from thymic epithelial cell injury by keratinocyte growth factor: a new approach to improve thymic and peripheral T-cell reconstitution after bone marrow transplantation. Blood. 2002;99:4592–4600. doi: 10.1182/blood.v99.12.4592. [DOI] [PubMed] [Google Scholar]
- Najib S, Sanchez-Margalet V. Human leptin promotes survival of human circulating blood monocytes prone to apoptosis by activation of p42/44 MAPK pathway. Cellular Immunology. 2002;220:143–149. doi: 10.1016/s0008-8749(03)00027-3. [DOI] [PubMed] [Google Scholar]
- Palmer G, Aurrand-Lions M, Contassot E, Talabot-Ayer D, Ducrest-Gay D, Vesin C, Chobaz-Peclat V, Busso N, Gabay C. Indirect Effects of Leptin Receptor Deficiency on Lymphocyte Populations and Immune Response in db/db Mice. Journal of Immunology. 2006;177:2899–2907. doi: 10.4049/jimmunol.177.5.2899. [DOI] [PubMed] [Google Scholar]
- Papathanassoglou E, El-Haschimi K, Li XC, Matarese G, Strom T, Mantzoros C. Leptin receptor expression and signaling in lymphocytes: kinetics during lymphocyte activation, role in lymphocyte survival, and response to high fat diet in mice. Journal of Immunology. 2006;176:7745–7752. doi: 10.4049/jimmunol.176.12.7745. [DOI] [PubMed] [Google Scholar]
- Rubin JS, Osada H, Finch PW, Taylor WG, Rudikoff S, Aaronson SA. Purification and characterization of a newly identified growth factor specific for epithelial cells. Proc Natl Acad Sci U S A. 1989;86:802–806. doi: 10.1073/pnas.86.3.802. [DOI] [PMC free article] [PubMed] [Google Scholar]
- Sempowski GD, Gooding ME, Liao HX, Le PT, Haynes BF. T cell receptor excision circle assessment of thymopoiesis in aging mice. Molecular Immunology. 2002;38:841–848. doi: 10.1016/s0161-5890(01)00122-5. [DOI] [PubMed] [Google Scholar]
- Trotter-Mayo RN, Roberts MR. Leptin acts in the periphery to protect thymocytes from glucocorticoid-mediated apoptosis in the absence of weight loss. Endocrinology. 2008;149:5209–5218. doi: 10.1210/en.2008-0476. [DOI] [PMC free article] [PubMed] [Google Scholar]
- Wang KX, Shi Y, Denhardt DT. Osteopontin regulates hindlimb-unloading-induced lymphoid organ atrophy and weight loss by modulating corticosteroid production. Proc Natl Acad Sci U S A. 2007;104:14777–14782. doi: 10.1073/pnas.0703236104. [DOI] [PMC free article] [PubMed] [Google Scholar]
- Wang KX, Shi YF, Ron Y, Kazanecki CC, Denhardt DT. Plasma osteopontin modulates chronic restraint stress-induced thymus atrophy by regulating stress hormones: inhibition by an anti-osteopontin monoclonal antibody. J Immunol. 2009;182:2485–2491. doi: 10.4049/jimmunol.0803023. [DOI] [PubMed] [Google Scholar]
- Wang SD, Huang KJ, Lin YS, Lei HY. Sepsis-induced apoptosis of the thymocytes in mice. Journal of Immunology. 1994;152:5014–5021. [PubMed] [Google Scholar]
- Zamisch M, Moore-Scott B, Su DM, Lucas PJ, Manley N, Richie ER. Ontogeny and regulation of IL-7-expressing thymic epithelial cells. J Immunol. 2005;174:60–67. doi: 10.4049/jimmunol.174.1.60. [DOI] [PubMed] [Google Scholar]
- Zhao Y, Sun R, You L, Gao C, Tian Z. Expression of leptin receptors and response to leptin stimulation of human natural killer cell lines. Biochemical and Biophysical Research Communications. 2003;300:247–252. doi: 10.1016/s0006-291x(02)02838-3. [DOI] [PubMed] [Google Scholar]
Associated Data
This section collects any data citations, data availability statements, or supplementary materials included in this article.
Supplementary Materials
Representative flow plot showing gating on CD45 negative thymic stromal cells (A). Cells were next gated on MHC Class II positive expression (B). Lastly, cells were analyzed by Ly-51 expression to determine cortical (Ly-51+), and medullary (Ly-51-) cell populations (C).