Abstract
Microgravity induced bone loss represents a critical health problem in astronauts, particularly occurred in weight-supporting skeleton, which leads to osteopenia and increase of fracture risk. Lack of suitable evaluation modality makes it difficult for monitoring skeletal status in long term space mission and increases potential risk of complication. Such disuse osteopenia and osteoporosis compromise trabecular bone density, and architectural and mechanical properties. While X-ray based imaging would not be practical in space, quantitative ultrasound may provide advantages to characterize bone density and strength through wave propagation in complex trabecular structure. This study used a scanning confocal acoustic diagnostic and navigation system (SCAN) to evaluate trabecular bone quality in 60 cubic trabecular samples harvested from adult sheep. Ultrasound image based SCAN measurements in structural and strength properties were validated by μCT and compressive mechanical testing. This result indicated a moderately strong negative correlations observed between broadband ultrasonic attenuation (BUA) and μCT-determined bone volume fraction (BV/TV, R2=0.53). Strong correlations were observed between ultrasound velocity (UV) and bone’s mechanical strength and structural parameters, i.e., bulk Young’s modulus (R2=0.67) and BV/TV (R2=0.85). The predictions for bone density and mechanical strength were significantly improved by using a linear combination of both BUA and UV, yielding R2=0.92 for BV/TV and R2=0.71 for bulk Young’s modulus. These results imply that quantitative ultrasound can characterize trabecular structural and mechanical properties through measurements of particular ultrasound parameters, and potentially provide an excellent estimation for bone’s structural integrity.
Keywords: quantitative ultrasound, scanning confocal ultrasound, ultrasound attenuation, ultrasound velocity, bone loss in space, disuse osteoporosis, bone adaptation, bone mineral density, speed of sound, dual-energy X-ray absorptiometry, bone quality
Introduction
Musculoskeletal deterioration and bone loss as well as associated complications, i.e., disuse osteopenia and risk of fractures, are significant threats for astronauts during long-term space mission, e.g., in space station and the trip to Mars [1]. Accumulated data from over 40 years of space exploration have demonstrated that space flight, particularly in lone-term missions, has detrimental effects on bone and muscle. Results from short-term space mission (2–12 weeks) indicated that space flight with microgravity alters calcium metabolism and bone mineral density (BMD) in several hundreds of men and women who have flown in space. Osteopenia is a disease characterized by long term loss of bone tissue, particularly in the weight-supporting skeleton [2]. On average, the magnitude and rate of the loss is staggering; astronauts lose bone mineral in the lower appendicular skeleton at a rate approaching 2% per month [3–7]. While osteopenia can affect the whole body, complications often occur predominantly at specific sites of the skeleton with great load bearing demands. The greatest BMD losses in space have been observed in the skeleton of the lower body, i.e., in pelvic bones (−11.99±1.22%) and in the femoral neck (−8.17±1.24%), while there was no apparent decay found in the skull region [3–5]. Moreover, it is apparent that full recovery of bone mass may never occur [8–14], potentiating skeletal complications later in the astronaut’s life [11]. Similar results were found in the bedrest study. In a −6 degrees head-down tilt 7-day bed rest model for microgravity, it was observed that there was a decreased bone formation rate in the iliac crest [15]. Thus, assuming in a 2.5-year return-trip to Mars, half of an astronaut’s bone density may vanish, severely jeopardizing their health and well-being. Following aging induced human osteoporosis pattern, it is predicted that if a round trip to Mars would take 18–30 months, significant bone loss would occur and impact the skeletal sustainability [16]. Moreover, the progressive adaptation of the human biological system for short and long term space flight still remain largely unknown, i.e., current exercise countermeasure protocol can not sufficiently prevent bone loss [17]. Part of the reasons is the extremely difficult to monitor continuous adaptive decay of bone loss during the space flight. As human space exploration now plan and prepare to extend the mission to out orbital, such as human being flight to Mars through extended manned vehicle with 18 to 36 months of duration, one can imagine that the risk and the challenge in the musculoskeletal system will be tremendous, and there are so little progress has been made in understanding the significance of the problem. There is almost completely lack of on board measurements for assessing longitudinal bone loss and muscle atrophy, as well as associated evaluation of countermeasure outcome. To elucidate microgravity affected skeleton disorders will lead to a better understanding of the barriers to long-term space exploration and to assist in the development of countermeasures to assure safe and productive missions. To understand these effects, we need a better description of human adaptation to space and with this information create a prevention and countermeasure strategy through new technology. To develop new technologies will lead to a better understanding of the barriers to long-term space exploration and to assist in the development of countermeasures to assure safe and productive missions.
Bone mineral density (BMD) measurements are predominantly used in the diagnosis of osteopenia and osteoporosis [18–21]. BMD measurement using dual-energy X-ray absorptiometry (DXA), commonly used in the clinic, has several benefits, including relatively high precision (~2%) and the capability of assessing several independent sites, such as the spine, hip and wrist. However, DXA is also limited, as the source and detector are separated by the whole body, and the accuracy of the method may be compromised, as it inherently includes layers of soft tissue and is incapable of segregating cortical from trabecular bone. DXA-determined BMD is an apparent two-dimensional (2D) index of the three-dimensional (3D) structure rather than a true representation of the 3D density. Thus, use of DXA to define the structural quality of bone in vivo, whether in normal or osteoporotic subjects, remains largely unknown. Quantitative ultrasound (QUS) as a noninvasive modality to measure the peripheral skeleton has raised considerable interest in bioengineering and clinical disciplines in recent years [22]. New methods have emerged with the potential to estimate not only the density of trabecular bone, but the strength and modulus of the bone tissue. QUS provides an intriguing method for characterizing the material properties of bone in a manner which is noninvasive, non-ionized radiation, nondestructive, and also relatively accurate. Previous researches have demonstrated significance of QUS to quantify bone mass and structural stiffness [23–25]. Using several available clinical devices, studies in vivo have shown the capability of QUS to discriminate patients with osteoporotic fractures from age-matched controls [26–30]. It has been demonstrated that QUS predicts risk of future fracture generally as well as DXA [31,32]. However, there are several notable limitations in the current setting of the ultrasound technologies, including the tissue boundary interaction, the nonlinear function of density associated with bone ultrasonic attenuation, a single index covering a broad range of tissues (including cortical and trabecular regions), and the interpolation of the results.
Research efforts have been made using scanning mode of the ultrasound pulses in a 2-D or 3-D pattern [33,34,34–36]. Such technology is intended to provide true images reflecting the structural and strength properties of bone at particular skeletal sites in peripheral limbs and, in the future, has the potential to measure bones in deep tissues, like the great trochanter. This may further provide both density and strength assessments in the regions of interest for fracture risk [34,36]. QUS uses several parameters to characterize bone quantity and quality, i.e., ultrasonic wave propagation velocity (UV), simple ultrasound attenuation (ATT), and broadband ultrasound attenuation (BUA), which are closely related to acoustic transmission in a porous structure that have been used to identify those individuals at risk of osteoporotic fracture as reliably as BMD [31,32,37]. It has been shown that both BUA and UV are decreased in individuals with risk factors for osteoporosis, i.e., primary hyperparathyroidism [38–41], kidney disease [42], and glucocorticoid use [43,44].
To improve the specificity and resolution of image based quantitative ultrasonic assessment, a scanning confocal acoustic navigation (SCAN) approach was developed to identify the quality of trabecular bone. The objective of this study was to evaluate both bone structural and strength properties using ultrasound scanning. The SCAN results were then validated using μCT-determined morphologic properties and mechanical testing.
Methods
Sample preparation
A total of 60 trabecular bone cubes (1×1×1 cm), were harvested from the distal femoral condyle of 18 adult female sheep (Warhill, intact ewes, 60–80 kg, 6–8 years of age) that had previously undergone 2 years of vibratory mechanical stimulation as part of an unrelated research study[45] using a low-speed diamond blade saw (Microslice, Metals Research Limited, Cambridge, England) with continuous water cooling. 3–4 bone cubes were harvested from each sheep. Prior to cutting, the femoral shaft was placed at a 45° angle to the blade (Fig. 1) so that the axes of the resultant samples corresponded to the physiologic and anatomic directions, i.e., longitudinal (LG) (animal’s weight-bearing direction), anteroposterior (AP), and mediolateral (ML). Femoral rotation was standardized further by positioning the bone so that the inferior surfaces of both condyles were equally in contact with the cutting surface. All harvesting was performed consistently using standard visual guidelines for all femoral cuts (e.g., the inferior-most transverse section was made just proximal to the intercondylar fossa) to ensure that the cubes were harvested from the same relative location from each femur.
Figure 1.
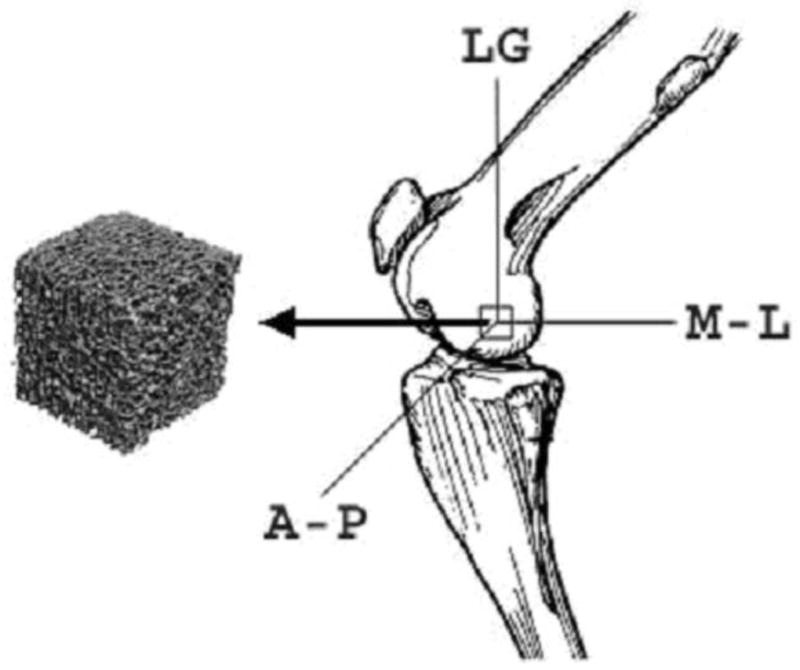
Trabecular bone samples were carefully extracted from the sheep distal femoral condyle. LG: Longitudinal direction in weight-bearing (45 degree with the long axis of bone); ML: Mediolateral direction; AP: Anteroposterior direction.
These bones were stored in a solution of half 70% ethanol and half normal saline at 4 °C with the marrow intact. This storage method was chosen based upon the previous work of Ashman and colleagues, in which they harvested cancellous bone specimens for mechanical testing and ultrasound studies [23,46]. They performed specific experiments and demonstrated that this solution preserved the elastic behavior of the ex vivo bone specimens for several months at room temperature [47]. Using a nanomechanical testing method in our own studies, however, showed that after 12 months of storage in this solution at 4 1 °C, an average 30% reduction in modulus and strength is observed [48]. For this experiment, the time from the first bone harvested to the last bone mechanically tested was approximately four months, with a mean time between harvesting and materials testing of only about one month per bone—well within the time frame analyzed by Ashman et al. The leaching of minerals over time that ultimately results in this loss of bone strength, however, would not affect the geometry of the samples as visualized by μCT.
Quantitative ultrasound measurement
The specimen was submerged in a testing water tank filled with degassed water. The bone cubes were measured quantitative SCAN in three orthogonal directions. The SCAN device consists of a computer-controlled 2D scanner unit with an attached, focused transmitter and receiver transducers (Panametrics V303, 1 MHz, 0.5″ in diameter with target focus of 0.8″; GE Panametrics, Billerica, MA). The specimen was placed in the middle of the transducers and surrounded by sound-blocking materials. The transducers were coaxially aligned to each other in bone, so that the focal points for both the transmitting and receiving ultrasound transducers converged at the point of testing. Because we used a broadband transducer, even if its center frequency were 1 MHz, it would still have a broad frequency response at 300 to 700 kHz, which is sufficient for ultrasound measurement. The transmitter was driven by pulse signals, and the signals passing through bone were received by the receiver amplifier unit (Panametrics, Model 5072PR) and digitized at 25 MHz using a high speed digitizer (Gagescope, CS1250) embedded in a computer (Dell Dimension, Round Rock, TX). The control software was written in the C++ language. The measurement procedure consisted of confocal scanning with the ultrasonic beam through the central region (2D plane) of the sample with a resolution of 0.5 mm pixel size (Fig. 2). A recording of the ultrasound wave was made over a 20×20 array (10×10 mm field of view). At first, the reference wave was recorded without the bone sample in the ultrasound pathway. Then the sample was inserted, and the test wave was recorded. These waveforms were processed to calculate the ATT (dB), the log-ratio of the energy of the reference wave to the test wave, as shown in Equation 1.
Figure 2.
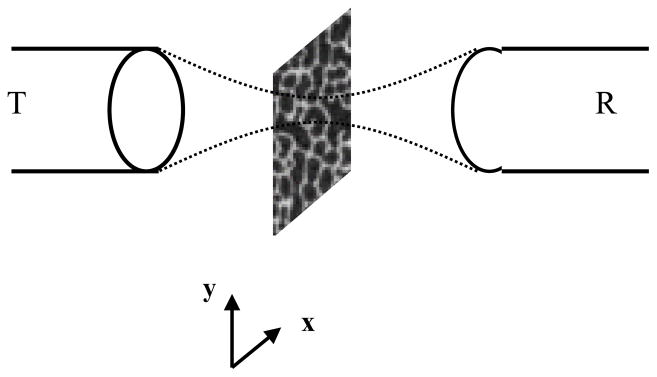
A diagram indicates the design of the scanning confocal acoustic diagnostic setup. Both the transmitting (T) and receiving (R) transducers were co-focused at the point of interest in the trabecular bone. The scan was performed so that the middle plan in bone was scanned in 2D.
| (1) |
where sr(t) is the reference waveform and sb(t) is the bone waveform. The BUA (dB/MHz) is defined as the slope of the frequency-dependent attenuation within the 300 to 700k Hz bandwidth, where the attenuation is linear [49]. The UV was calculated using the time-of-flight method, which is based on the arrival time differences between the reference signal and the bone signal. The second zero crossing point was used as the marker to identify the arrival of the ultrasound wave. These ultrasonic values were further processed to generate images of ATT, BUA, and UV. A 14×14 grid (0.5 mm pixel size, 7×7 mm field of view) region of interest (ROI) was then determined from the images of ATT, BUA, and UV to derive ultrasound parameters. Averaged values of the above parameters were also calculated.
Ultrasound attenuation in trabecular bone is usually measured by the substitution method [50]. Accuracy testing of the BUA coefficient has been performed on a QUS normal heel phantom (QUS 304, Computerized Imaging Reference Systems, Inc., Norfolk VA) which has similar acoustic properties to the human calcaneus. The calibrated BUA value of the QUS normal heel phantom was 75.37 dB/MHz. Three repetitive measurements were performed on the phantom using the STM technique, and the measured BUA values were recorded and compared to the phantom calibration value. The coefficient of variation (CV = standard deviation/mean) was also calculated.
CT-determined bone microarchitecture and density
High-resolution μCT was used to evaluate the structure and density of the bone samples [51–54]. A series of structural parameters of the trabecular samples, such as the tissue volume (TV), bone volume (BV), bone volume fraction (BV/TV), μCT-based bone volumetric mineral density (vBMD) calculated by 3D-based bone volume fraction [55], mean trabecular thickness (Tb.Th), connectivity density (Conn.D), structural model index (SMI), and degree of anisotropy (DA) [51] were determined from the 3D images of the trabecular sample reconstructed with a 34 μm resolution using built-in code (μCT-40, Scanco USA., Southeastern, PA) [51,52,56]. The explanation of the various μCT indices and their respective calculation is found in several published sources [51,52,57,58] and so is not repeated here.
Tissue mechanical modulus
Contact force-displacement testing was used to determine the mechanical properties of the trabecular bone samples. Using a mechanical testing machine (MTS Systems Corp., Eden Prairie, MN), the cubes were uniaxially loaded in compression using a displacement control (Fig. 3). To overcome slight deviations from surface parallelism, a smoothly curved nail head was placed above the bone cube such that the force would be distributed evenly to the bone in the loading direction [59] (Fig. 3). An upper limit of 300 N — determined by prior loading of non-experimental, but otherwise identical, bone cubes — was established to prevent the plastic yielding of any specimens while the loading was achieved in bone’s elastic region. The loading rate was approximately 1000 με per second for the samples. Both displacement and force were digitized analyzed using MTS BasicTestware software. Prior to data collection, several preconditioning cycles at 1% strain were used to overcome edge effects from the harvesting process. This preconditioning consisted of at least five cycles and was stopped once the preload stabilized at around 10 N or reached eight cycles (whichever came first). Subsequently, three experimental compressions of 1% strain were done, and the final result was taken to be the average of these three values.
Figure 3.
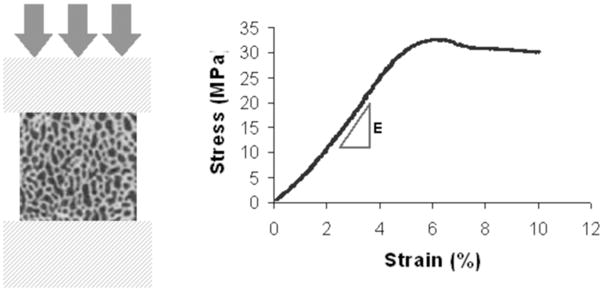
Mechanical testing of bone cubic samples. The modulus of bone was calculated by the linear slope of the strain-stress curve.
Force-displacement was converted to an analogous stress-strain curve by dividing force by the cross-sectional area, and displacement by length (each cube was measured independently to reduce the geometrical error inherent in harvesting).
The material properties studied included elastic moduli in three orthogonal directions and bulk modulus, which was the averaged value of the elastic moduli from the three orthogonal directions. After scanning in the μCT, the bones were tested until failure in the LG direction. The material properties studied include modulus, yield strength (calculated using the 0.2% strain offset method), and ultimate strength.
Correlations and statistical analyses
Interrelationships between QUS parameters and μCT-determined structural values, and between QUS parameters and mechanical properties were evaluated through multiple correlations using Analyze-it (version 1.67; Leeds, UK) and SPSS (version 16; Chicago, IL). Statistical correlation was performed between the ultrasound parameter and the trabecular structural parameters and mechanical parameters. When ultrasound parameters were correlated to Young’s modulus of the trabecular bone in three orthogonal directions, the ultrasound velocity and BUA in the corresponding directions were used. Otherwise, if the bone parameter was not directionally dependent (e.g., density), the averaged ultrasound velocity and BUA from the three orthogonal directions were used. Finally, a combined linear regression of BUA and UV was used to interpret the complex structure of trabecular bone and its interactive influence on the derived ultrasound signals. The data were analyzed using Pearson product-moment correlation coefficients, and the significance level was set at p < 0.05.
Results
The microarchitecture and mechanical properties and the ultrasound measurement results of trabecular bone cubes varied among the samples (Tables 1, 2, and 3) (Fig. 4). Table 1 shows the mechanical properties from the three anatomic loading directions, AP, LG, and ML. The mechanical stiffness of sheep trabecular bone demonstrated directional variation from 512 ± 96 MPa in LG to 442 ± 97 MPa in AP and to 346 ± 100 MPa in ML, yielding a bulk modulus of 433 ± 93 MPa and a yield strength of 17 ± 6.8 MPa. Among all the directions, the elastic modulus in the LG direction was greater than the ones in the ML and AP directions.
Table 1.
Mechanical testing data for bone cubes (MPa)
| E-AP | E-LG | E-ML | Bulk E | Yield Strength | |
|---|---|---|---|---|---|
| mean±SD | 441.52±96.55 | 511.67±96.16 | 345.76±100.12 | 432.98±92.52 | 16.85±6.78 |
| CV(%) | 21.9 | 18.8 | 29.0 | 21.4 | 40.2 |
| Median | 416.86 | 516.84 | 337.54 | 423.14 | 16.53 |
| Minimum | 246.75 | 311.48 | 142.90 | 253.61 | 7.48 |
| Maximum | 691.66 | 716.71 | 548.04 | 641.77 | 35.38 |
Table 2.
Micro-CT data for bone cubes
| BV/TV | SMI | Conn.D (1/mm3) | Tr.Th. (mm) | DA | |
|---|---|---|---|---|---|
| mean±SD | 0.29±0.07 | 0.56±0.40 | 4.86±1.01 | 0.19±0.05 | 1.88±0.20 |
| CV(%) | 24.1 | 70 | 20.8 | 23.8 | 10.8 |
| Median | 0.28 | 0.53 | 4.79 | 0.18 | 1.87 |
| Minimum | 0.17 | 0.01 | 2.81 | 0.15 | 1.42 |
| Maximum | 0.44 | 1.59 | 6.78 | 0.45 | 2.37 |
Table 3.
Ultrasound testing for bone cubes, mean±SD.
| ATT (dB/cm) | BUA (dB/MHz/cm) | UV (m/s) | |
|---|---|---|---|
| AP | 25.19±3.67 | 111.91±35.55 | 2122.16±133.44 |
| LG | 29.42±3.52 | 120.61±35.97 | 2437.24±197.14 |
| ML | 20.88±2.85 | 74.66±13.36 | 1883.13±109.63 |
| Average | 25.16±3.04 | 102.39±23.07 | 2147.51±133.75 |
| Mean CV(%) | 12.1 | 22.5 | 6.2 |
| Bulk Median | 24.46 | 104.51 | 2147.42 |
| Bulk Min | 20.10 | 58.10 | 1805.75 |
| Bulk Max | 33.26 | 151.13 | 2418.84 |
Figure 4.
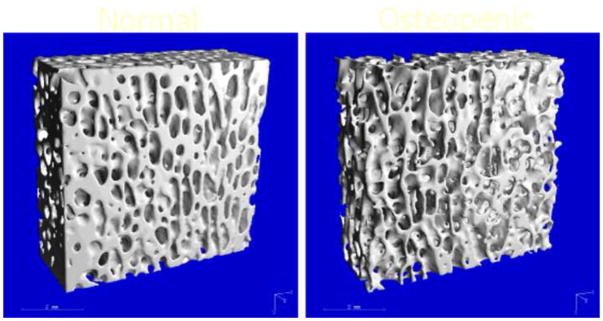
μCT-measured trabecular bone structure, 34 μm resolution. Left is the normal bone; right is the sample with low bone density.
The microstructural properties of trabecular bone samples, in which bone volume fraction (BV/TV) varied from 17% (minimum) to 44% (maximum). Similar variations were found in SMI, Conn.D, Tr.Th, and DA (Table 2).
Ultrasound measurements (ATT, BUA, and UV) showed the directional variations from anatomic positions, AP, LG, and ML (Table 3). BUA and ATT values in the LG direction were greater than the ultrasound values in the ML and AP directions. ATT in the LG direction was 16.8% and 40.9% greater than in the AP and the ML directions, respectively. Similarly, BUA in the LG direction was 7.8% and 61.5% greater than in the AP and the ML directions, respectively. UV in the longitudinal direction (LG) was greater than in the AP (14.8%) and ML (29.4%) directions.
Table 4 shows the overall correlation coefficients (R). A strong correlation was found between BUA and BV/TV (R2=0.53, p<0.001, Fig 5). A higher correlation was found between average ultrasound velocity and the BV/TV (R2 = 0.86, p<0.001, Fig. 6). Strong correlations were found between UV and bone strength and structural parameters such as bulk Young’s modulus (R2=0.67), BV/TV (R2=0.85), and Tb.Th (R2=0.48). Although weak compared to the UV results, correlations between BUA and μCT-determined structural parameters, such as BV/TV (R= −0.73 or R2=0.53), and Tb.Th (R= −0.34 or R2=0.12), as well as tissue bulk modulus (R=−0.31 or R2=0.12), were still high. Also, the variability of the correlation coefficients between BUA and the mechanical modulus was greater than the variability between ultrasound velocity and the mechanical modulus. The correlations were improved by using a new parameter that combined BUA and UV in a linear regression analysis, yielding values of R2=0.92 for BV/TV, R2=0.45 for trabecular thickness, and R2=0.71 for bulk modulus. The linear combination of ultrasound velocity and BUA predicted 70% of the variation in the bulk Young’s modulus (R2=0.70, Fig. 7) and 87% of the variation in the BV/TV (R2=0.87, Fig. 8). Combined BUA and UV indexes improved the correlation coefficients consistently above 0.75 with regard to the elastic Young’s modulus, bulk modulus, yield, and ultimate strength (Table 4). Strong correlations were also found between this combined BUA and the UV from a single direction, i.e., ML, and the structural and strength parameters.
Table 4.
Relative correlation coefficients (R values) for QUS, μCT and mechanical testing. SCAN determined ultrasound parameters are able to predict structural and strength properties of trabecular bone. Combined BUA and UV indexes improve the correlation coefficients consistently above 0.75 with regard to the elastic modulus, bulk modulus, yield or ultimate strength. Strong correlations were also found between combined BUA & UV from single direction, i.e., ML, and structural and strength parameters, suggesting QUS signals extracted from particular direction (e.g., under in vivo condition) are able to predict overall trabecular bone density and stiffness.
| ATT | UV | BUA | Combo BUA & UV in ML | Combo BUA & UV in AP | Combo BUA & UV | |
|---|---|---|---|---|---|---|
| AP Modulus | −0.71 | 0.79 | −0.31 | 0.74 | 0.74 | 0.80 |
| p<0.001 | p<0.001 | p=0.033 | p<0.001 | p<0.001 | p<0.001 | |
|
| ||||||
| LG Modulus | −0.75 | 0.79 | −0.221 | 0.63 | 0.67 | 0.81 |
| p<0.001 | p<0.001 | p=0.131 | p<0.001 | p<0.001 | p<0.001 | |
|
| ||||||
| ML Modulus | −0.673 | 0.89 | −0.483 | 0.79 | 0.74 | 0.78 |
| p<0.001 | p<0.001 | p=0.001 | p<0.001 | p<0.001 | p<0.001 | |
|
| ||||||
| Bulk Modulus | −0.75 | 0.82 | −0.358 | 0.76 | 0.75 | 0.84 |
| p<0.001 | p<0.001 | p=0.012 | p<0.001 | p<0.001 | p<0.001 | |
|
| ||||||
| Yield Strength | −0.72 | 0.90 | −0.85 | 0.87 | 0.89 | 0.93 |
| p<0.001 | p<0.001 | p<0.001 | p<0.001 | p<0.001 | p<0.001 | |
|
| ||||||
| Ulti. Strength | −0.75 | 0.90 | −0.85 | 0.87 | 0.88 | 0.94 |
| p<0.001 | P<0.001 | P<0.001 | P<0.001 | P<0.001 | p<0.001 | |
|
| ||||||
| BV/TV | −0.37 | 0.93 | −0.73 | 0.93 | 0.93 | 0.93 |
| p=0.018 | p<0.001 | p<0.001 | p<0.001 | p<0.001 | p<0.001 | |
| BMD | 0.74 | 0.85 | −0.75 | 0.86 | 0.85 | 0.87 |
|
| ||||||
| SMI | 0.3 | 0.9 | 0.66 | 0.91 | 0.92 | 0.93 |
| p=0.034 | p<0.001 | p<0.001 | p<0.001 | p<0.001 | p<0.001 | |
|
| ||||||
| Conn.D. | −0.12 | −0.33 | 0.07 | 0.32 | 0.39 | 0.42 |
| p=0.5 | p=0.006 | p=0.5 | p=0.025 | p=0.006 | p=0.003 | |
|
| ||||||
| Tr.Th. | −0.17 | 0.69 | −0.34 | 0.83 | 0.64 | 0.67 |
| p=0.368 | p<0.001 | p=0.01 | p<0.001 | p<0.001 | p<0.001 | |
|
| ||||||
| DA | −0.278 | 0.5 | −0.32 | 0.34 | 0.44 | 0.50 |
| p=0.056 | p<0.001 | p=0.26 | p=0.17 | p=0.002 | p<0.001 | |
Figure 5.
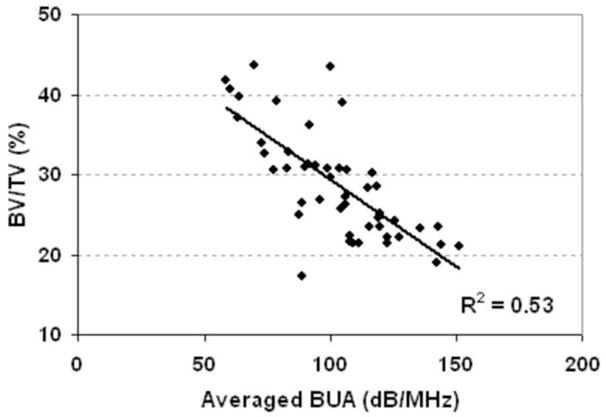
The correlation of average BUA with the BV/TV from μCT analysis. The R2 is 0.53 (p<0.001).
Figure 6.
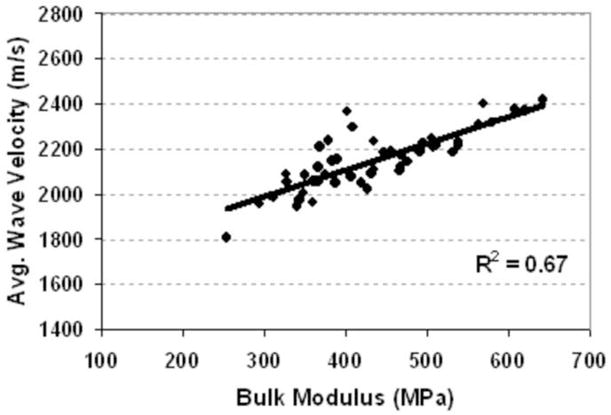
The correlation of averaged UV with the bulk modulus. The R2 is 0.63 (p<0.001).
Figure 7.
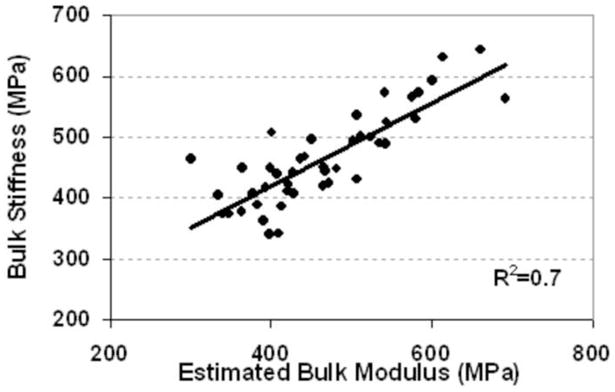
Prediction of bulk modulus by the linear combination of ultrasound velocity and BUA also showed high correlation (R2=0.7, p<0.001). E(predict ) = 0.625UV +0.585BUA + 968
Figure 8.
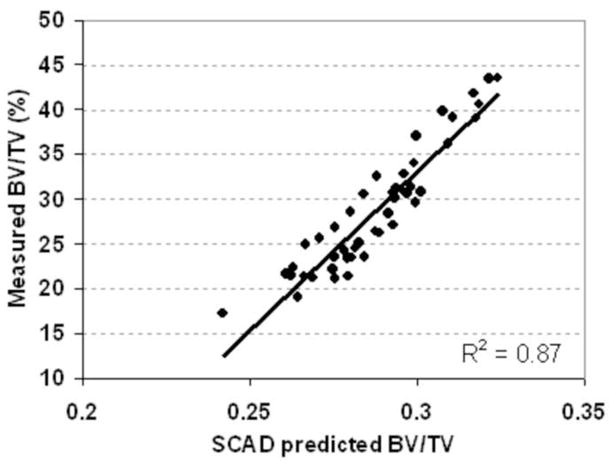
Prediction of BV/TV by the linear combination of ultrasound velocity and BUA showed high correlation (R2=0.87, p<0.001).
BV /TV ( predict) = 3.89×10⁻⁴UV − 9×10⁻⁴ BUA − 0.456
Strong correlations existed between the combined BUA and UV in either the ML or AP direction, as well as the overall structural and mechanical properties (Table 4, Columns 5 and 6). Significant correlations were found between the combined BUA and UV (in ML and AP directions) and the bulk modulus (R2=0.58 and R2=0.56), yielding strength (R2=0.76 and R2=0.79), BV/TV (R2=0.86), and SMI (R2=0.83 and R2=0.85), respectively. This indicates that QUS measured in the non-longitudinal directions can predict overall mechanical and structural properties of trabecular bone.
Discussion
QUS parameters (e.g., BUA and UV) measured by the SCAN have shown strong correlation with the structural and mechanical properties of the trabecular bone samples. The results have demonstrated that the correlations between QUS parameters and μCT-determined volumetric bone density (BV/TV) reaches strong agreement as high as 70 to 90 percent [60–62]. Use of μCT as a structural assessment modality does not compromise the potential of QUS in bone quality assessment, where ultrasound technology — which not only measures density but also bone strength — has been proven to be safe, noninvasive, non-ionizing, portable, and relatively inexpensive. This would provide a potential modality for onboard bone quality assessment in the short- and long-duration space missions, and monitoring progressive bone remodeling as well as evaluating effects of various countermeasure therapies.
QUS has demonstrated directional sensitive to trabecular orientation [63,64], which can provide extra information in the architecture of trabecular anisotropy and on how ultrasound parameters are associated with the DA. Strong correlations were found between combined BUA and the UV from a single direction, i.e., ML, and the structural and strength parameters, suggesting that QUS signals extracted from a particular direction under in vivo conditions would be able to predict principal trabecular orientation and therefore to estimate overall stiffness of trabecular bone. In our recently published data, QUS is capable to predict trabecular bone principal structural direction close enough with μCT determined MIL tensor as small as 5° [64]. In addition, QUS BUA and UV can predict density variations, in which combination of BUA and UV can predict bone volume fraction as high as 86 percent. QUS results are closely correlated to other architecture parameters of trabecular bone as well, e.g., Tb.Th and SMI. These results suggest that QUS parameters are influenced by both bone density and architecture. Among measured QUS parameters, significant correlation is observed between UV and mechanical strength, suggesting UV may be a strong candidate parameter to closely relate to bone stiffness. In order to predict bone’s structure and mechanical properties using QUS, the contributions of multiple ultrasound parameters should be considered. Indeed, if a functional relationship between multiple QUS parameters and measured bone density and stiffness could be generated by performing a large number of sample measurements across species, QUS can theoretically predict both the structural and strength properties of bone.
In this study, averaged BUA was inversely correlated with BV/TV (Fig. 5). In previous human QUS measurement in osteoporotic bone, the relationship between BUA and bone mineral density has shown positive correlation [62,65,66]. Usually, in human trabecular bone, the porosity varies in the range of 75 to 95 percent (equivalent to 5 to 25 percent of bone volume fraction) depending on the status of bone quality [28,52]. However, normal human bone and animal trabeculae, e.g., sheep bone, can have a relatively higher bone volume fraction than aged human bone, which result in a trabecular bone volume fraction in the range of 25 to 50 percent. In low-density sheep trabecular bone (more porous, like the human calcaneus), BUA seems to mainly reflect the effect of absorption due to a relatively smaller interaction of sound waves with trabecular architecture than with dense trabecular bone [67]. On the other hand, in dense trabecular bone, the effect of scattering of ultrasound waves on BUA may be highly dominant as a result of more interaction of the ultrasound within trabecular porosity. This relation was demonstrated by an experimental setup for the interrelationship between BUA and a wide range of bone mineral densities [67], in which both bone mass and structure governed the BUA in a complicated nonlinear relation. This complex relation can also be explained from our previous work using a modified stratified model [49], in which BUA demonstrated a parabolic nonlinear shape against the porosity [68–70]. These data suggest that BUA is a strong indicator of trabecular bone mass and architecture. However, interpreting the BUA data with respect to bone structure parameters should be done with extra caution, as BUA depends strongly on the bone volume fraction and porosity values.
The image-based QUS measurement of bone samples is capable to improve the correlations with bone structure and mechanical properties, thereby revealing bone quality information in the region of interest. In this study, the extracted trabecular bone samples excluded cortical bone. Although the potential influence of the cortical shell and of irregular bone surfaces were not discussed in this study, these factors can be addressed, and their relative influences in measured ultrasound parameters can be analyzed in a future study. The influences of cortical shell and irregular bone surfaces have been evaluated in separate studies [62,71], which demonstrated that this new scanning ultrasound technology was capable of identifying regions of interest and their features of inhomogeneity. The variations induced by an irregular shape and cortical shell can be minimized. Thus, it is possible to make noninvasive measurements of large bone sites, such as the calcaneus, for clinical assessment. Furthermore, the SCAN system can identify the inhomogeneity in bone and predict the sites at risk of weakness by means of its scanning feature.
Although QUS is capable of predicting the density and mechanical properties of bone, QUS does not directly measure such bone properties such as density and modulus [24]. Thus, a well-established database for the interrelationship between QUS and bone structural and strength properties would provide insight into the noninvasive diagnosis of bone quality using such ultrasound methods. Use of both μCT and mechanical testing on the trabecular samples has helped to generate such functional relation and makes the noninvasive QUS measurement for bone quality possible as a diagnostic tool. he ultrasound values correlated best with overall parameters such as bone volume fraction and SMI, which are the best indicators of global quality of the bone, rather than with such specific parameters as Conn.D, density, and Tb.Th. Ultrasound values correlated better with yield and ultimate strength, the best indicators of true fracture risk, than with elastic modulus, a simple measure of stiffness.
Moreover, the measurements of QUS and μCT in this study were conducted only in the sheep bone with particular porosity and density. Although relatively altered bone structure and strength parameters in these samples were identified, it would not fully represent the true status of normal and osteoporotic trabecular conditions in human. Future research is required to determine the correlation between measured ultrasound images and true bone properties, such as osteopenia and osteoporosis with significantly low density and high porosities of trabecular structure, using various and more realistic samples and/or phantoms. These may point to a nice design in future works and manuscripts.
Conclusion
Quantitative ultrasound has demonstrated promising potentials in the nondestructive assessment of bone structural and strength parameters. With image based QUS, it is potential for in vivo bone quality assessment, as the initial sites of bone loss in osteopenia and osteoporosis occur primarily in the trabecular region. In addition to predicting the density and structure properties of bone, the SCAN QUS demonstrates an encouragingly high correlation between bone modulus and ultrasound parameters, suggesting that QUS may provide a strong estimation for the noninvasively evaluation of both strength, an important integrity parameter for predicting the risk of fracture. QUS measurement of the trabecular bone is directionally sensitive, consistent with the structural and mechanical properties of bone. The results suggest that QUS scanning can characterize bone quality in the region of interest identified by QUS generated imaging. Although, ultrasound is not a direct measurement for either trabecular structure or mechanical modulus, with an accumulated database of normal and diseased bone assessment, QUS has the potential to identify osteoporosis and fracture risk and to monitor skeletal regenerative adaptation as a potential onboard modality for long-term space mission.
Highlights.
Quantitative ultrasound provides relatively high resolution image for trabecular bone assessment.
Confocal acoustic diagnosis is capable to assess bone’s structural and mechanical properties.
Portable SCAN may measure bone density and quality during extended space mission.
Ultrasound velocity correlates highly with bone strength and structural parameters.
Integrated QUS parameters, UV and BUA, are capable to provide the best prediction in bone quality.
Acknowledgments
This work is kindly supported by the National Space Biomedical Research Institute (SMST01603, Qin) through NASA Cooperative Agreement NCC 9-58, NIH (AR49286 and AR52379, Qin), and NYSTAR (Qin).
Footnotes
Publisher's Disclaimer: This is a PDF file of an unedited manuscript that has been accepted for publication. As a service to our customers we are providing this early version of the manuscript. The manuscript will undergo copyediting, typesetting, and review of the resulting proof before it is published in its final citable form. Please note that during the production process errors may be discovered which could affect the content, and all legal disclaimers that apply to the journal pertain.
References
- 1.Lang T, LeBlanc A, Evans H, Lu Y, Genant H, Yu A. Cortical and trabecular bone mineral loss from the spine and hip in long-duration spaceflight. J Bone Miner Res. 2004;19:1006–1012. doi: 10.1359/JBMR.040307. [DOI] [PubMed] [Google Scholar]
- 2.Riggs BL, Melton LJ., III The worldwide problem of osteoporosis: insights afforded by epidemiology. Bone. 1995;17:505S–511S. doi: 10.1016/8756-3282(95)00258-4. [DOI] [PubMed] [Google Scholar]
- 3.LeBlanc A, Schneider V, Shackelford L. Bone Mineral and Lean Tissue Loss after Long Duration Spaceflight. Trans Amer Soc Bone Min Res. 1996;11S:567. [Google Scholar]
- 4.LeBlanc A, Shackelford L, Feiveson A, Oganov V. Bone Loss in Space: Shuttle/Mir Experience and Bed-Rest Counter Measure Program. 1st Biennial Space Biomed. Inv. Workshop; 1999. p. 17. [Google Scholar]
- 5.Ruff C, Beck T, Newman D, Oden M, Shaffner G, LeBlanc A, Shackelford L, Rianon N. Skeletal Consequences of Reduced Gravity Environments. 1st Biennial Space Biomed Inv.Workshop; 1999. pp. 86–87. [Google Scholar]
- 6.LeBlanc A, Schneider V, Shackelford L, West S, Oganov V, Bakulin A, Voronin L. Bone mineral and lean tissue loss after long duration space flight. J Musculoskelet Neuronal Interact. 2000;1:157–160. [PubMed] [Google Scholar]
- 7.LeBlanc AD, Spector ER, Evans HJ, Sibonga JD. Skeletal responses to space flight and the bed rest analog: a review. J Musculoskelet Neuronal Interact. 2007;7:33–47. [PubMed] [Google Scholar]
- 8.Goode A. Musculoskeletal change during spaceflight: a new view of an old problem. Br J Sports Med. 1999;33:154. [PubMed] [Google Scholar]
- 9.Goode AW, Rambaut PC. The skeleton in space. Nature. 1985;317:204–205. doi: 10.1038/317204a0. [DOI] [PubMed] [Google Scholar]
- 10.LeBlanc A, Schneider V, Evans H, Engelbretson D, Krebs J. Bone Mineral Loss and Recovery after 17 Weeks of Bed Rest. JBone MinRes. 1990;5(8):843–850. doi: 10.1002/jbmr.5650050807. [DOI] [PubMed] [Google Scholar]
- 11.LeBlanc A, Schneider V. Can the adult skeleton recover lost bone? Exp Gerontol. 1991;26:189–201. doi: 10.1016/0531-5565(91)90011-a. [DOI] [PubMed] [Google Scholar]
- 12.Rambaut P, Goode A. Skeletal Changes during Space Flight. Lancet. 1985;2:1050–1052. doi: 10.1016/s0140-6736(85)90916-x. [DOI] [PubMed] [Google Scholar]
- 13.Shackleford L, LeBlanc A, Feiveson A, Oganov V. Bone loss in space: Shuttle/Mir experience and bed rest countermeasure program. 1st Biennial Space Biomed Inv. Workshop; 1999. pp. 86–87. [Google Scholar]
- 14.Tilton F, Degioanni J, Schneider V. Long Term Follow Up Of SkyLab Bone Demineralization. Aviat Space Environ Med. 1980;51:1209–1213. [PubMed] [Google Scholar]
- 15.Arnaud SB, Sherrard DJ, Maloney N, Whalen RT, Fung P. Effects of 1-Week Head-Down Tilt Bed Rest on Bone-Formation and the Calcium Endocrine System. Aviation Space and Environmental Medicine. 1992;63:14–20. [PubMed] [Google Scholar]
- 16.Qin YX. Challenges to the Musculoskeleton During a Journey to Mars: Assessment and Counter Measures. J Cosmology. 2010;12:3778–3780. [Google Scholar]
- 17.Grigoriev AI, Oganov VS, Bakulin AV, Poliakov VV, Voronin LI, Morgun VV, Shnaider VS, Murashko LV, Novikov VE, LeBlanc A, Shackelford L. Clinical and Psychological Evaluation of Bone Changes Among Astronauts after Long Term Space Flights (Russian) Aviakosmicheskaia I Ekologicheskaia Meditsina. 1998;32(1):21–25. [PubMed] [Google Scholar]
- 18.Genant HK. Current state of bone densitometry for osteoporosis. Radiographics. 1998;18:913–918. doi: 10.1148/radiographics.18.4.9672976. [DOI] [PubMed] [Google Scholar]
- 19.Kanis JA, Borgstrom F, Zethraeus N, Johnell O, Oden A, Jonsson B. Intervention thresholds for osteoporosis in the UK. Bone. 2005;36:22–32. doi: 10.1016/j.bone.2004.08.018. [DOI] [PubMed] [Google Scholar]
- 20.Melton LJ, III, Orwoll ES, Wasnich RD. Does bone density predict fractures comparably in men and women? Osteoporos Int. 2001;12:707–709. doi: 10.1007/s001980170044. [DOI] [PubMed] [Google Scholar]
- 21.Melton LJ, III, Kanis JA, Johnell O. Potential impact of osteoporosis treatment on hip fracture trends. J Bone Miner Res. 2005;20:895–897. doi: 10.1359/JBMR.050308. [DOI] [PubMed] [Google Scholar]
- 22.Laugier P. Quantitative ultrasound of bone: looking ahead. Joint Bone Spine. 2006;73:125–128. doi: 10.1016/j.jbspin.2005.10.012. [DOI] [PubMed] [Google Scholar]
- 23.Ashman RB, Rho JY. Elastic modulus of trabecular bone material. J Biomech. 1988;21:177–181. doi: 10.1016/0021-9290(88)90167-4. [DOI] [PubMed] [Google Scholar]
- 24.Harada M, Tanaka K, Katayama T, Mizuno K, Soumiya H, Matsukawa M. Relationship between mechanical properties and acoustic parameters obtained from fast and slow waves for cancellous bone. J Acoust Soc Am. 2008;123:3633. [Google Scholar]
- 25.Nicholson PH, Alkalay R. Quantitative ultrasound predicts bone mineral density and failure load in human lumbar vertebrae. Clin Biomech (Bristol, Avon ) 2007;22:623–629. doi: 10.1016/j.clinbiomech.2006.12.008. [DOI] [PubMed] [Google Scholar]
- 26.Cheng S, Tylavsky F, Carbone L. Utility of ultrasound to assess risk of fracture. J Am Geriatr Soc. 1997;45:1382–1394. doi: 10.1111/j.1532-5415.1997.tb02940.x. [DOI] [PubMed] [Google Scholar]
- 27.Gregg EW, Kriska AM, Salamone LM, Roberts MM, Anderson SJ, Ferrell RE, Kuller LH, Cauley JA. The epidemiology of quantitative ultrasound: a review of the relationships with bone mass, osteoporosis and fracture risk. Osteoporos Int. 1997;7:89–99. doi: 10.1007/BF01623682. [DOI] [PubMed] [Google Scholar]
- 28.Njeh CF, Saeed I, Grigorian M, Kendler DL, Fan B, Shepherd J, McClung M, Drake WM, Genant HK. Assessment of bone status using speed of sound at multiple anatomical sites. Ultrasound Med Biol. 2001;27:1337–1345. doi: 10.1016/s0301-5629(01)00437-9. [DOI] [PubMed] [Google Scholar]
- 29.Nicholson PH, Strelitzki R. On the prediction of Young’s modulus in calcaneal cancellous bone by ultrasonic bulk and bar velocity measurements. Clin Rheumatol. 1999;18:10–16. doi: 10.1007/s100670050044. [DOI] [PubMed] [Google Scholar]
- 30.Damilakis J, Papadokostakis G, Vrahoriti H, Tsagaraki I, Perisinakis K, Hadjipavlou A, Gourtsoyiannis N. Ultrasound velocity through the cortex of phalanges, radius, and tibia in normal and osteoporotic postmenopausal women using a new multisite quantitative ultrasound device. Invest Radiol. 2003;38:207–211. doi: 10.1097/01.RLI.0000057031.21810.F4. [DOI] [PubMed] [Google Scholar]
- 31.Bauer DC, Gluer CC, Cauley JA, Vogt TM, Ensrud KE, Genant HK, Black DM. Broadband ultrasound attenuation predicts fractures strongly and independently of densitometry in older women. A prospective study. Study of Osteoporotic Fractures Research Group. Arch Intern Med. 1997;157:629–634. [PubMed] [Google Scholar]
- 32.Hans D, Njeh CF, Genant HK, Meunier PJ. Quantitative ultrasound in bone status assessment. Rev Rhum Engl Ed. 1998;65:489–498. [PubMed] [Google Scholar]
- 33.Laugier P, Novikov V, Elmann-Larsen B, Berger G. Quantitative ultrasound imaging of the calcaneus: precision and variations during a 120-Day bed rest. Calcif Tissue Int. 2000;66:16–21. doi: 10.1007/s002230050005. [DOI] [PubMed] [Google Scholar]
- 34.Qin Y-X, Lin W, Rubin C. Interdependent relationship between Trabecular Bone Quality and Ultrasound Attenuation and Velocity Using a Scanning Confocol Acoustic Diagnostic System. J Bone Min Res. 2001;16:S470–70. [Google Scholar]
- 35.Qin YX, Xia Y, Lin W, Cheng J, Muir J, Rubin C. Longitudinal assessment of human bone quality using scanning confocal quantitative ultrasound. J Acoust Soc Am. 2008;123:3638. [Google Scholar]
- 36.Xia Y, Lin W, Qin Y. The Influence Of Cortical End-Plate On Broadband Ultrasound Attenuation Measurements At The Human Calcaneus Using Scanning Confocal Ultrasound. J Acoustic Soc of Am. 2005;118:1801–1807. doi: 10.1121/1.1979428. [DOI] [PubMed] [Google Scholar]
- 37.Frost ML, Blake GM, Fogelman I. Quantitative ultrasound and bone mineral density are equally strongly associated with risk factors for osteoporosis. J Bone Miner Res. 2001;16:406–416. doi: 10.1359/jbmr.2001.16.2.406. [DOI] [PubMed] [Google Scholar]
- 38.Gonnelli S, Montagnani A, Cepollaro C, Monaco R, Gennari L, Rossi B, Pacini S, Gennari C. Quantitative ultrasound and bone mineral density in patients with primary hyperparathyroidism before and after surgical treatment. Osteoporos Int. 2000;11:255–260. doi: 10.1007/s001980050289. [DOI] [PubMed] [Google Scholar]
- 39.Ingle BM, Thomas WE, Eastell R. Differential effects of primary hyperparathyroidism on ultrasound properties of bone. Osteoporos Int. 2002;13:572–578. doi: 10.1007/s001980200075. [DOI] [PubMed] [Google Scholar]
- 40.Minisola S, Rosso R, Scarda A, Pacitti MT, Romagnoli E, Mazzuoli G. Quantitative ultrasound assessment of bone in patients with primary hyperparathyroidism. Calcif Tissue Int. 1995;56:526–528. doi: 10.1007/BF00298582. [DOI] [PubMed] [Google Scholar]
- 41.Minisola S, Pacitti MT, Ombricolo E, Costa G, Scarda A, Palombo E, Rosso R. Bone turnover and its relationship with bone mineral density in pre- and postmenopausal women with or without fractures. Maturitas. 1998;29:265–270. doi: 10.1016/s0378-5122(98)00008-5. [DOI] [PubMed] [Google Scholar]
- 42.Wittich A, Vega E, Casco C, Marini A, Forlano C, Segovia F, Nadal M, Mautalen C. Ultrasound velocity of the tibia in patients on haemodialysis. J Clin Densitometry. 1998;1:157–163. [Google Scholar]
- 43.Blanckaert F, Cortet B, Coquerelle P, Flipo RM, Duquesnoy B, Marchandise X, Delcambre B. Contribution of calcaneal ultrasonic assessment to the evaluation of postmenopausal and glucocorticoid-induced osteoporosis. Rev Rhum Engl Ed. 1997;64:305–313. [PubMed] [Google Scholar]
- 44.Cortet B, Flipo RM, Blanckaert F, Duquesnoy B, Marchandise X, Delcambre B. Evaluation of bone mineral density in patients with rheumatoid arthritis. Influence of disease activity and glucocorticoid therapy. Rev Rhum Engl Ed. 1997;64:451–458. [PubMed] [Google Scholar]
- 45.Rubin C, Turner AS, Muller R, Mittra E, McLeod K, Lin W, Qin YX. Quantity and quality of trabecular bone in the femur are enhanced by a strongly anabolic, noninvasive mechanical intervention. J Bone Miner Res. 2002;17:349–357. doi: 10.1359/jbmr.2002.17.2.349. [DOI] [PubMed] [Google Scholar]
- 46.Ashman RB, Antich PP, Gonzales J, Anderson JA, Rho JY. A comparison of reflection and transmission ultrasonic techniques for measurement of cancellous bone elasticity. J Biomech. 1994;27:1195–1199. doi: 10.1016/0021-9290(94)90061-2. [DOI] [PubMed] [Google Scholar]
- 47.Ashman RB, Cowin SC, Van Buskirk WC, Rice JC. A continuous wave technique for the measurement of the elastic properties of cortical bone. J Biomech. 1984;17:349–361. doi: 10.1016/0021-9290(84)90029-0. [DOI] [PubMed] [Google Scholar]
- 48.Mittra E, Akella S, Qin YX. The effects of embedding material, loading rate and magnitude, and penetration depth in nanoindentation of trabecular bone. J Biomed Mater Res A. 2006;79:86–93. doi: 10.1002/jbm.a.30742. [DOI] [PubMed] [Google Scholar]
- 49.Lin W, Qin YX, Rubin C. Ultrasonic wave propagation in trabecular bone predicted by the stratified model. Ann Biomed Eng. 2001;29:781–790. doi: 10.1114/1.1397787. [DOI] [PubMed] [Google Scholar]
- 50.Langton CM, Njeh CF. Acoustic and ultrasonic tissue characterization--assessment of osteoporosis. Proc Inst Mech Eng [H ] 1999;213:261–269. doi: 10.1243/0954411991534960. [DOI] [PubMed] [Google Scholar]
- 51.Hildebrand T, Ruegsegger P. Quantification of Bone Microarchitecture with the Structure Model Index. Comput Methods Biomech Biomed Engin. 1997;1:15–23. doi: 10.1080/01495739708936692. [DOI] [PubMed] [Google Scholar]
- 52.Hildebrand T, Laib A, Muller R, Dequeker J, Ruegsegger P. Direct three-dimensional morphometric analysis of human cancellous bone: microstructural data from spine, femur, iliac crest, and calcaneus. J Bone Miner Res. 1999;14:1167–1174. doi: 10.1359/jbmr.1999.14.7.1167. [DOI] [PubMed] [Google Scholar]
- 53.Muller R, van Lenthe GH. Trabecular bone failure at the microstructural level. Curr Osteoporos Rep. 2006;4:80–86. doi: 10.1007/s11914-006-0007-4. [DOI] [PubMed] [Google Scholar]
- 54.Odgaard A. Three-dimensional methods for quantification of cancellous bone architecture. Bone. 1997;20:315–328. doi: 10.1016/s8756-3282(97)00007-0. [DOI] [PubMed] [Google Scholar]
- 55.Muller R, van Lenthe GH. Trabecular bone failure at the microstructural level. Curr Osteoporos Rep. 2006;4:80–86. doi: 10.1007/s11914-006-0007-4. [DOI] [PubMed] [Google Scholar]
- 56.Ruegsegger P, Koller B, Muller R. A microtomographic system for the nondestructive evaluation of bone architecture. Calcif Tissue Int. 1996;58:24–29. doi: 10.1007/BF02509542. [DOI] [PubMed] [Google Scholar]
- 57.Ruegsegger P, Koller B, Muller R. A microtomographic system for the nondestructive evaluation of bone architecture. Calcif Tissue Int. 1996;58:24–29. doi: 10.1007/BF02509542. [DOI] [PubMed] [Google Scholar]
- 58.Fajardo RJ, Muller R. Three-dimensional analysis of nonhuman primate trabecular architecture using micro-computed tomography. Am J Phys Anthropol. 2001;115:327–336. doi: 10.1002/ajpa.1089. [DOI] [PubMed] [Google Scholar]
- 59.Mittra E, Rubin C, Qin YX. Interrelationship of trabecular mechanical and microstructural properties in sheep trabecular bone. J Biomech. 2005;38:1229–1237. doi: 10.1016/j.jbiomech.2004.06.007. [DOI] [PubMed] [Google Scholar]
- 60.Haiat G, Padilla F, Peyrin F, Laugier P. Variation of ultrasonic parameters with microstructure and material properties of trabecular bone: a 3D model simulation. J Bone Miner Res. 2007;22:665–674. doi: 10.1359/jbmr.070209. [DOI] [PubMed] [Google Scholar]
- 61.Hakulinen MA, Day JS, Toyras J, Weinans H, Jurvelin JS. Ultrasonic characterization of human trabecular bone microstructure. Phys Med Biol. 2006;51:1633–1648. doi: 10.1088/0031-9155/51/6/019. [DOI] [PubMed] [Google Scholar]
- 62.Xia Y, Lin W, Qin YX. Bone surface topology mapping and its role in trabecular bone quality assessment using scanning confocal ultrasound. Osteoporos Int. 2007;18:905–913. doi: 10.1007/s00198-007-0324-1. [DOI] [PubMed] [Google Scholar]
- 63.Luo G, Kaufman JJ, Chiabrera A, Bianco B, Kinney JH, Haupt D, Ryaby JT, Siffert RS. Computational methods for ultrasonic bone assessment. Ultrasound Med Biol. 1999;25:823–830. doi: 10.1016/s0301-5629(99)00026-5. [DOI] [PubMed] [Google Scholar]
- 64.Lin L, Cheng J, Lin W, Qin Y-X. Prediction of trabecular bone principal structural orientation using quantitative ultrasound scanning. J Biomech. 2012;45:1790–1795. doi: 10.1016/j.jbiomech.2012.04.022. [DOI] [PMC free article] [PubMed] [Google Scholar]
- 65.Bolanowski M, Jedrzejuk D, Milewicz A, Arkowska A. Quantitative ultrasound of the heel and some parameters of bone turnover in patients with acromegaly. Osteoporos Int. 2002;13:303–308. doi: 10.1007/s001980200030. [DOI] [PubMed] [Google Scholar]
- 66.Hung VW, Qin L, Au SK, Choy WY, Leung KS, Leung PC, Cheng JC. Correlations of calcaneal QUS with pQCT measurements at distal tibia and non-weight-bearing distal radius. J Bone Miner Metab. 2004;22:486–490. doi: 10.1007/s00774-004-0511-5. [DOI] [PubMed] [Google Scholar]
- 67.Han S, Rho J, Medige J, Ziv I. Ultrasound velocity and broadband attenuation over a wide range of bone mineral density. Osteoporos Int. 1996;6:291–296. doi: 10.1007/BF01623387. [DOI] [PubMed] [Google Scholar]
- 68.Serpe L, Rho JY. The nonlinear transition period of broadband ultrasound attenuation as bone density varies. J Biomech. 1996;29:963–966. doi: 10.1016/0021-9290(95)00146-8. [DOI] [PubMed] [Google Scholar]
- 69.Serpe LJ, Rho JY. Broadband ultrasound attenuation value dependence on bone width in vitro. Phys Med Biol. 1996;41:197–202. doi: 10.1088/0031-9155/41/1/014. [DOI] [PubMed] [Google Scholar]
- 70.Strelitzki R, Evans JA, Clarke AJ. The influence of porosity and pore size on the ultrasonic properties of bone investigated using a phantom material. Osteoporos Int. 1997;7:370–375. doi: 10.1007/BF01623780. [DOI] [PubMed] [Google Scholar]
- 71.Xia Y, Lin W, Qin YX. The influence of cortical end-plate on broadband ultrasound attenuation measurements at the human calcaneus using scanning confocal ultrasound. The Journal of the Acoustical Society of America. 2005;118:1801–1807. doi: 10.1121/1.1979428. [DOI] [PubMed] [Google Scholar]


