

ABSTRACT
Staphylococcus aureus exhibits an unusually high level of osmotolerance and Na+ tolerance, properties that support survival in various host niches and in preserved foods. The genetic basis of these traits is not well understood. We compared the transcriptional profiles of S. aureus grown in complex medium with and without 2 M NaCl. The stimulon for growth in high-osmolality media and Na+ included genes involved in uptake of K+, other compatible solutes, sialic acid, and sugars; capsule biosynthesis; and amino acid and central metabolism. Quantitative PCR analysis revealed that the loci responded differently from each other to high osmolality imposed by elevated NaCl versus sucrose. High-affinity K+ uptake (kdp) genes and capsule biosynthesis (cap5) genes required the two-component system KdpDE for full induction by osmotic stress, with kdpA induced more by NaCl and cap5B induced more by sucrose. Focusing on K+ importers, we identified three S. aureus genes belonging to the lower-affinity Trk/Ktr family that encode two membrane proteins (KtrB and KtrD) and one accessory protein (KtrC). In the absence of osmotic stress, the ktr gene transcripts were much more abundant than the kdpA transcript. Disruption of S. aureus kdpA caused a growth defect under low-K+ conditions, disruption of ktrC resulted in a significant defect in 2 M NaCl, and a ΔktrC ΔkdpA double mutant exhibited both phenotypes. Protective effects of S. aureus Ktr transporters at elevated NaCl are consistent with previous indications that both Na+ and osmolality challenges are mitigated by the maintenance of a high cytoplasmic K+ concentration.
IMPORTANCE
There is general agreement that the osmotolerance and Na+ tolerance of Staphylococcus aureus are unusually high for a nonhalophile and support its capacity for human colonization, pathogenesis, and growth in food. Nonetheless, the molecular basis for these properties is not well defined. The genome-wide response of S. aureus to a high concentration, 2 M, of NaCl revealed the upregulation of expected genes, such as those for transporters of compatible solutes that are widely implicated in supporting osmotolerance. A high-affinity potassium uptake system, KdpFABC, was upregulated, although it generally plays a physiological role under very low K+ conditions. At higher K+ concentrations, a lower-affinity and more highly expressed type of K+ transporter system, Ktr transporters, was shown to play a significant role in high Na+ tolerance. This study illustrates the importance of the K+ status of the cell for tolerance of Na+ by S. aureus and underscores the importance of monovalent cation cycles in this pathogen.
Introduction
Human commensals and opportunistic pathogens belonging to the genus Staphylococcus tolerate exceptionally low water activities (1). Plating on 7.5% (1.3 M) NaCl has been a routine method for selective enrichment of staphylococci for decades (2), and it is often posited that the osmotolerance of Staphylococcus aureus and S. epidermidis supports their growth and survival in association with human skin and mucous membranes. This is consistent with the association of S. aureus infection with the inherited disease cystic fibrosis, in which bacteria colonize and grow in the viscous sputum that accumulates within the lung (3). S. aureus also grows well at low osmolality and must thus have osmoregulation capacities over a very large range (4). Nonetheless, staphylococci have not been major models for studies in which genetic loci required for osmotolerance have been identified. Rather, molecular mechanisms that support resistance to osmotic stress have been characterized most extensively in prokaryotes with relatively low tolerance, such as Escherichia coli and Bacillus subtilis, and at the other extreme in halophiles, which grow optimally at osmolalities and Na+ concentrations that would inhibit almost all other organisms.
Diverse organisms cope with osmotic stress by accumulating solutes that increase the osmolality of the cytoplasm, thereby helping the cells retain water while minimally interfering with protein function. K+ is often accumulated upon an upshift in external osmolality and is naturally the most abundant cation in most bacteria (5, 6). There is a correlation between medium osmolality and intracellular K+ concentration (6–9). Many small organic compounds can also enhance osmotolerance. These compatible solutes are often zwitterions such as glutamine, proline, and glycine betaine, and cells can increase their intracellular concentration via increased biosynthesis, decreased degradation, or increased uptake (10). Measurements of intracellular K+, amino acids, and other compatible solutes during growth in media with various osmolalities have revealed properties that distinguish S. aureus from other bacteria. Christian and Waltho found that the intracellular K+ concentration in S. aureus grown in a complex medium was much higher than that of a Leuconostoc spp. (another firmicute; 700 mM versus 140 mM). They found that this concentration increased when S. aureus was incubated in medium containing added sucrose, NaCl, and KCl but was maintained at concentrations approximately equal to or higher than internal Na+ in all cases (6). Other studies have reported constitutively high levels of intracellular K+ in S. aureus that presumably make further increases unnecessary to mitigate the stress of high osmolality (4). However, increased K+ uptake might be required to maintain the high constitutive level of cytoplasmic K+ under such stress. S. aureus can tolerate concentrations of internal Na+ as high as 900 mM (11), an unusual tolerance that is consistent with findings that the cytotoxicity of Na+ is mitigated by increased K+ (12). Similarly, key metabolic enzymes from S. aureus, with its especially high cytoplasmic K+ concentration, are less sensitive to inhibition by Na+ than those of E. coli and B. subtilis (1).
With respect to specificities for organic compatible solutes, there is variation among different species, with Gram-negative bacteria generally showing large increases in intracellular glutamate during osmotic stress while Gram-positive bacteria maintain constitutively high levels of glutamate and increase proline concentrations at least modestly during osmotic stress (1, 9). In S. aureus, glycine betaine, proline, choline, and taurine have all been noted as compatible solutes that accumulate intracellularly and enable the organism to grow in high-osmolality media (4, 13). Several transport activities have been reported as potential contributors to compatible-solute uptake, but the responsible genes and proteins have not been identified in most cases (14, 15). Mutants with transposon insertions in the S. aureus genes brnQ3 and arsR have defects in growth in high-osmolality media, but the mechanisms involved are not known (16–18).
To gain a broader understanding of the molecular basis of S. aureus osmotolerance and Na+ tolerance, we conducted a microarray experiment that compared the transcriptome during growth in the presence and absence of 2 M NaCl. Among a diverse group of genes that exhibited at least 10-fold induction, the most upregulated gene during growth in high Na+ was part of an operon that encodes a Kdp complex, a high-affinity ATP-dependent K+ importer. This led to assessment of the conditions under which physiological roles could be demonstrated for the Kdp transporter, which was positively regulated by the two-component system KdpDE, and for a lower-affinity Ktr-type K+ transporter, for which genes were identified.
RESULTS AND DISCUSSION
The S. aureus transcriptional response to growth in 2 M NaCl.
To identify genes whose upregulation is associated with growth at elevated salt concentrations, we conducted a microarray experiment comparing S. aureus USA300 LAC grown in LB0, a complex medium, with and without the addition of 2 M NaCl. This concentration of NaCl was chosen because it is sufficiently high to completely inhibit the growth of most cultivable bacteria but has only a moderate effect on the growth of S. aureus (see Fig. S1 in the supplemental material). The contaminating Na+ content of LB0 was measured by flame photometry and was approximately 14 mM. Cultures were inoculated at a starting optical density at 600 nm (OD600) of 0.01 and grown in Erlenmeyer flasks to a density of 0.7, which corresponds to late exponential phase (see Fig. S1). The culture grown without added NaCl showed a doubling time of 25 min, while the culture grown with NaCl had a longer doubling time of 45 min.
At the parallel time points shown in Fig. S1, culture samples were transferred immediately to an ice-cold acetone-ethanol solution and frozen at −80°C before subsequent RNA extraction. cDNA samples were prepared and hybridized to commercially available Affymetrix GeneChips containing probes representing 3,300 open reading frames (ORFs) and 4,800 intergenic regions from four different S. aureus genomes. We found that 267 genes or intergenic regions were induced (see Table S1 in the supplemental material) while 194 genes or intergenic regions were repressed (see Table S3) during growth in 2 M NaCl compared to growth in the absence of stress. S. aureus COL numbers are shown for most of these loci unless otherwise noted.
When the transcriptional profile of cells grown in 2 M NaCl was compared to that of cells grown in the absence of this stress, the most upregulated locus was the kdpFABC operon, with a range of 35.1- to 102.4-fold increases among the kdp genes. This operon is predicted to encode an ATP-driven, high-affinity K+ transport system called Kdp. Kdp systems have been implicated in osmotolerance in E. coli. Transcription of kdp operons is strongly induced by osmotic stress and/or K+ limitation in many bacterial species (19–21), and kdp operon expression is induced by the two-component system KdpDE in E. coli and Leptospira interrogans (22–24). We observed that the kdpDE operon was also significantly induced in S. aureus cells grown in the presence of 2 M NaCl, by 21.4- and 8.7-fold for kdpD and kdpE, respectively. This suggested that KdpDE acts to activate kdpFABC expression in S. aureus although there had been an earlier report to the contrary (25).
Additional loci that encode proteins with diverse or unknown functions were induced more than 10-fold by growth in 2 M NaCl. The cap5 operon, which had been reported to be regulated by KdpDE (25, 26), was among them. This locus encodes the biosynthetic enzymes for production of the capsule (serotype 5), a virulence factor that helps protect S. aureus from phagocytosis (27). Other highly induced loci that are involved in central metabolism could be contributing to reorientation of these major pathways to support biosynthesis of the capsule, which could constitute a major carbon sink. Such loci include those that encode tricarboxylic acid cycle proteins (e.g., the gltA, suc, and sdh genes), phosphoenolpyruvate carboxykinase, lactate dehydrogenase, glyceraldehyde-3-phosphate dehydrogenase, dihydroxyacetone kinase, and fructose-1,6-bisphosphatase. One or more representative genes from four different phosphotransferase system (PTSs), which are involved in sugar uptake, were also induced at least 2-fold and could contribute substrates for central metabolic pathways.
Loci identified with products involved in central metabolism were also related to amino acid transport, biosynthesis, and degradation, which could contribute to compatible-solute uptake and production and/or energy generation under a stressful condition. One of the most upregulated genes during growth in a high NaCl concentration was rocD, a component of an alternative pathway for proline biosynthesis by arginine conversion (28), which exhibited 14.4-fold induction by 2 M NaCl. The genes rocA and rocF were also upregulated, suggesting that this alternative pathway, which has been implicated in osmotolerance in B. subtilis (29), facilitates proline accumulation in response to osmotic stress in S. aureus. Additional loci that are candidates for support of accumulation of amino acids or chemically related compatible solutes and that were induced by growth in 2 M NaCl are indicated in Table S1 in the supplemental material.
We also noted three other genes that were significantly upregulated, one of which had been found earlier to be induced by NaCl. This was the sceD gene, which encodes a putative lytic transglycolase and was induced 21.4-fold by 2 M NaCl in this study. SceD is required for nasal colonization in a cotton rat model, suggesting that osmotic stress can act as a signal for genes that facilitate survival during association with the host (30). geh, a large gene that encodes a lipase, is also very strongly upregulated during growth in a high NaCl concentration. The physiological advantages of the overproduction of these transcripts in response to NaCl stress are not known, but their activities are suggestive of cell surface remodeling roles. The third gene, nanT, is a sodium-coupled transporter of sialic acid (N-acetylneuraminic acid) that has recently been described (31). The nanT gene is coexpressed with one of the metabolic genes and could provide energy during stress. So far, the use of a sodium solute symporter family protein for the NanT function is restricted to firmicutes and the noted homology between this transporter and sodium/proline transporters (32) raises the testable question of whether this type of NanT might exhibit a secondary compatible-solute uptake activity, which would directly enhance osmotolerance. The genes brnQ3 and arsR, which had previously been implicated in Na+ resistance after their identification by mutant screening (16–18), were not affected under our study conditions.
Genes downregulated 10-fold or more in cells grown in 2 M NaCl compared to cells grown in the absence of this stress included those that encode several virulence factors (see Table S3 in the supplemental material). The most downregulated gene, at 39.8-fold downregulation, was SACOL1164, which encodes a fibrinogen binding protein-like protein. Another gene that encodes a fibrinogen binding-related protein, SACOL1169, was downregulated 12.7-fold and 12.1-fold, according to two different probes. efb, which also encodes a fibrinogen-binding protein, was downregulated 12-fold. SACOL0857, a gene that encodes a staphylocoagulase precursor, was also represented by two different probes, which reported 14.2-fold and 11.9-fold downregulation. hlY, which encodes an alpha-hemolysin precursor, was downregulated 17.1-fold. SACOL0478, which encodes exotoxin 3, was represented by three different probes and was downregulated 17.1-fold, 16.2-fold, and 9.6-fold. Finally, SACOL0024, which encodes a 5′-nucleotidase, was also represented by two different probes and was downregulated 11.2-fold and 9.7-fold. This gene was also represented by a probe that reported 8.5-fold downregulation. Collectively, these hits suggest that S. aureus downregulates a virulence program associated with bacteremia and endocarditis during growth in high-osmolality media. This behavior is consistent with the asymptomatic colonization by S. aureus in the high-osmolality environment of the anterior nares of more than 20% of the human population (33).
Major loci induced by growth in 2 M NaCl respond differentially to 2 M KCl.
Although S. aureus is Na+ tolerant, it is still sensitive to the toxicity of elevated Na+ and thus less tolerant of elevated Na+ concentrations than of comparable concentrations of K+ (34) (see Fig. S2 in the supplemental material). It was therefore of interest to test whether the response to these two ions was also different at the transcriptional level. We focused on the kdpA, cap5B, and nanT genes and used real-time quantitative PCR (qPCR) to assess changes in the relative abundances of the corresponding transcripts when cultures were grown with 2 M NaCl, 2 M KCl, or no addition. As shown in Fig. 1, induction of kdpA, cap5B, and nanT in response to growth in 2 M NaCl was more pronounced when detected by qPCR than when detected by microarray. Only nanT, and not kdpA or cap5B, was still induced to a similar extent when S. aureus was grown in 2 M KCl.
FIG 1 .
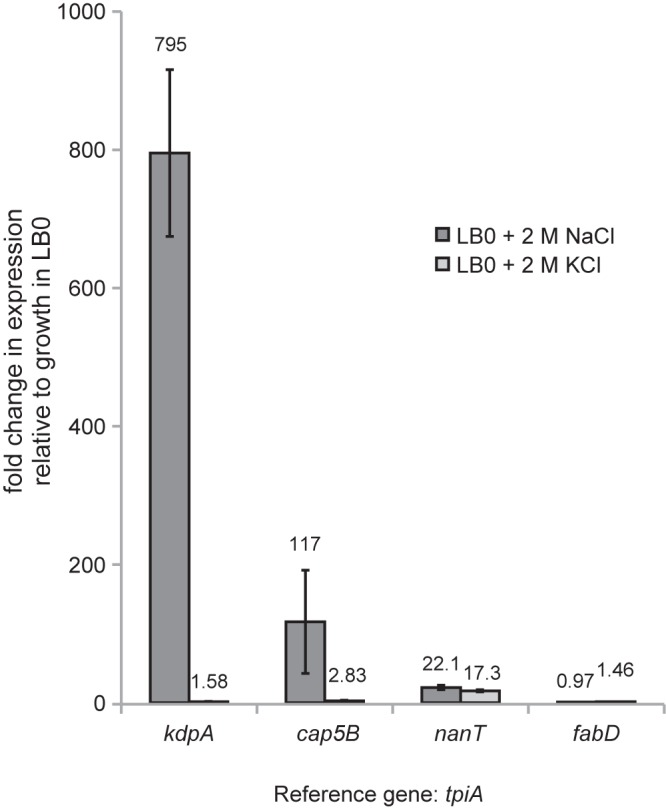
Fold changes in the expression of specific loci induced by growth in 2 M NaCl as assessed by qPCR. S. aureus LAC cultures were grown to late exponential phase in LB0 with or without 2 M NaCl or 2 M KCl. Data represent the averages of biological triplicates. Error bars represent standard deviations. fabD and tpiA were used as reference genes (54).
Evaluation of the response to isosmotic concentrations of NaCl and sucrose.
The difference in the responses of kdpA and cap5B transcript levels to Na+ and K+ raised the possibility that these genes are induced specifically by Na+ and not by other solutes. To test this, we modified our protocol to allow the addition of isosmotic concentrations of NaCl or sucrose to the culture medium. This required the use of a lower concentration of NaCl (1 M instead of 2 M) to allow the use of sucrose at a soluble concentration that would not make the medium noticeably viscous. Isosmotic concentrations of NaCl and sucrose in LB0 medium were established by measuring standards of media containing these osmolytes at known concentrations using a vapor pressure osmometer and plotting the relationship between concentration and osmolality (see Fig. S3 in the supplemental material). The values we obtained for LB0 containing NaCl and sucrose at concentrations of 0.2 to 1.5 M were comparable to the values for similar standards reported previously (4). We found that the levels of kdpA induction at isosmotic concentrations of NaCl and sucrose (1 M and 1.11 M, respectively) were comparable (Fig. 2), though they were more than 10-fold lower than the levels seen with 2 M NaCl. The fold induction of cap5B was significantly higher in sucrose than in the isosmotic concentration of NaCl, suggesting that additional regulatory mechanisms induce cap5 operon expression under this condition. The low level of NaCl used for this experiment, however, was not sufficient to induce the expression of nanT. The induction of kdpA and cap5B by sucrose suggests that induction of the kdpFABC and cap5 loci may occur as part of a generic osmotic stress response.
FIG 2 .

Fold changes in the expression of specific loci in response to growth in isosmotic concentrations (1 and 1.11 M, respectively) of NaCl and sucrose and kdpDE dependence of induction. S. aureus LAC and mutant cultures were grown to late exponential phase in LB0 with or without 1 M NaCl or 1.11 M sucrose. Data represent the averages of biological triplicates. Error bars represent standard deviations. pyk, proC, and tpiA were used as reference genes (54).
Full kdpA induction requires functional KdpDE.
Using isosmotic concentrations of NaCl and sucrose, we tested the dependence of kdpA and cap5B induction on the presence of a functional KdpDE two-component system. A mutant lacking the kdpDE operon (Table 1) was grown under the same high-NaCl or -sucrose conditions as the parent strain. We did not observe a growth defect in the ΔkdpDE mutant under these conditions. In the kdpDE mutant background, the significant induction of kdpA observed in a wild-type control during growth in both high-osmolality media was abolished (Fig. 2). Induction of cap5B was also abolished in NaCl but was only partially diminished during growth in sucrose, further supporting the hypothesis that an additional mechanism of induction acts on the cap5 locus specifically during growth in media containing this osmolyte. The effects of kdpDE deletion on kdpA and cap5B expression in high NaCl and sucrose concentrations, and the lack of kdpA and cap5B induction during growth in high KCl, raise the possibility that activity of the KdpDE system in controlling the kdpFABC and cap5 operons is modulated by multiple environmental cues, e.g., osmotic strength and K+ availability.
TABLE 1 .
Bacterial strains used in this study
| Species and strain | Genotype and/or description | Source or reference(s) |
|---|---|---|
| S. aureus | ||
| LAC | Wild type, USA300 | 59 |
| SH1000 | S. aureus 8325-4 with repaired rsbU | 60, 61 |
| LAC ΔkdpDE | This study | |
| SH1000 ΔkdpA | This study | |
| SH1000 ΔktrC | This study | |
| JE2 | 40 | |
| JE2 kdpA::ɸΝΣ | 40 | |
| JE2 ktrB::ɸΝΣ | 40 | |
| JE2 ktrC::ɸΝΣ | 40 | |
| E. coli | ||
| DH5α | 62 | |
| DH5α/pJMB168 |
E. coli DH5α containing plasmid pJMB168, which is pJB38 plus an insert designed for allelic recombination and deletion of kdpDE; Cmr |
This study |
| DH5α/pCKP47 |
E. coli DH5α containing plasmid pCKP47, which is pMAD plus an insert designed for allelic recombination and deletion of kdpA; Ampr |
This study |
| DH5α/pCKP67 |
E. coli DH5α containing plasmid pCKP67, which is pMAD plus an insert designed for allelic recombination and deletion of ktrC; Ampr |
This study |
The S. aureus genome encodes both high- and low-affinity K+ importers.
We observed the induction of a high-affinity K+ importer, KdpFABC, during the growth of S. aureus in LB0 medium, which was shown by flame photometry to contain approximately 7.4 mM contaminating K+. This raised the possibility that at its highly increased levels of expression, the KdpFABC transporter might make a modest contribution to K+ homeostasis by using the contaminating K+ but would play a more prominent role at an even lower K+ concentration. It was further expected that a distinct low-affinity K+ importer, still to be identified, would be a major contributor to the ability of S. aureus to accumulate K+ at high levels (0.7 to 1.1 M) during growth in rich, complex media, even in the absence of osmotic stress (4, 11). We searched S. aureus genomes for homologues of low-affinity K+ uptake systems in other bacteria and found proteins with sequence similarity to subunits of Ktr systems, which have been studied in B. subtilis. Ktr systems typically consist of two types of subunits: a transmembrane protein, required for K+ transport, and a membrane-associated, nucleotide-binding (KTN/RCK domain) regulatory protein (34–36). While B. subtilis genomes contain genes for two transmembrane and two regulatory components (37), S. aureus genomes contain genes for two transmembrane components, which we will call ktrB (SACOL2011) and ktrD (SACOL1030) on the basis of sequence identity at the amino acid level to the B. subtilis counterparts, and only one gene that encodes a regulatory component, which we have designated ktrC (SACOL1096), on the basis of the closer similarity of the encoded protein to KtrC than to the second homologue, KtrA, found in B. subtilis (see Table S2 in the supplemental material). Ktr systems differ markedly from Kdp systems. kdp operons in diverse bacteria are regulated at the transcriptional level, and Kdp systems are powered by ATPase activity. In contrast, Ktr systems are typically constitutively expressed, show a lower affinity for K+, have ATP-activated channel-like properties, and are powered by electrochemical ion gradients across the membrane rather than by ATPase activity (34, 38, 39).
Low-affinity K+ import is critical for Na+ tolerance in a complex medium.
To evaluate the relative importance of the Kdp and Ktr K+ import systems in Na+ resistance in S. aureus, we generated strains with markerless deletions of kdpA and ktrC in S. aureus SH1000, a strain that is more genetically tractable than USA300 LAC. The individual mutant phenotypes described in this and the following sections were similar to those observed for transposon insertion mutants in USA300 LAC acquired from the Nebraska Transposon Mutant Library (data not shown) (40). Deletion of kdpA and/or ktrC had no measurable effect on the growth of SH1000 in LB0 with no added salts (Fig. 3A). In LB0 with 2 M NaCl added, the kdpA mutant showed a decline in stationary phase in some experiments that was not reproducible enough for its significance to be assessed. Both the ΔktrC and ΔkdpA ΔktrC mutants showed significant growth defects in exponential phase, with the ΔkdpA ΔktrC mutant exhibiting a slightly more severe defect at the transition from the exponential to the stationary phase of the growth curve (Fig. 3B). This small difference suggests a minor, but perhaps meaningful, physiological role of S. aureus Kdp during osmotic stress that is largely masked by the activity of the Ktr system(s) in the wild type. After this report was drafted, Corrigan et al. (41) reported the identification of the single KTN (RCK) Ktr protein, for which they propose the name KtrA, as well as KdpD of S. aureus as receptors for the secondary signaling molecule cyclic di-AMP (c-di-AMP). In our present work, sodium stress, but not sucrose, caused a large elevation in KdpD-dependent expression. Together, the results here and those of Corrigan et al. (41) suggest sodium stress as a potential candidate for mediation of c-di-AMP production in S. aureus.
FIG 3 .

Growth of S. aureus SH1000 kdpA and ktrC mutants in complex and defined media. Panels show growth in LB0 (A), LB0 with 2 M NaCl added (B), T-CDM with 1,000 µM KCl added (C), and T-CDM with 10 µM KCl added. Data represent the averages of biological triplicates. Error bars represent standard deviations and are given for every other time point to improve visibility. wt, wild type.
High-affinity K+ import is critical for growth in a defined medium with limiting K+.
To test the expectation that the S. aureus Kdp system plays its most significant role in K+ import under conditions under which K+ is extremely limiting, we designed a medium, Tris-CDM (T-CDM), that would allow us to control the added concentrations of K+ and Na+ without contamination from complex ingredients. When K+ was added to this medium at 1,000 µM, both the single and double kdpA and ktrC mutants grew similarly to the wild type (Fig. 3C). When K+ was added to this medium at a low concentration (10 µM), mutants with kdpA deleted did not grow, while the ktrC mutant showed a longer lag phase than the wild type (Fig. 3D). Xue et al. recently examined the growth of Kdp-defective S. aureus mutants and kdp gene expression. They did not find a growth defect in these mutants and reported evidence that KdpDE acts to repress, rather than activate, the expression of kdpFABC in S. aureus (25). The development of a defined medium without significant contaminating Na+ or K+ allowed us to precisely control the amounts of these ions and uncover a growth defect in the ΔkdpA mutant when K+ was limiting. Differences in the KdpDE dependence of kdpA induction as detected by qPCR and relative quantification may have arisen from our adoption of the recommendation that more than one reference gene be used for normalization and that use of the 16S rRNA gene be avoided (42, 43).
ktr genes are constitutively expressed at high levels, and ktr gene disruptions do not affect the expression of remaining, intact ktr genes.
In B. subtilis, Ktr activity is induced by osmotic stress but the expression levels of the ktr genes do not change under this condition, suggesting that Ktr systems are constitutively expressed and that Ktr activity is regulated posttranscriptionally, e.g., by c-di-AMP (41). We evaluated the expression levels of the S. aureus kdp and ktr genes by absolute quantification qPCR and found that ktr gene transcripts were present at levels 1 to 2 orders of magnitude higher than kdpA gene transcripts when cultures were grown in LB0 without any additional osmolytes added (Fig. 4A). In B. subtilis, it has been reported that disruptions in ktr genes lead to compensatory induction of the remaining intact ktr genes (37). We tested this model in S. aureus USA300 LAC by using qPCR and examined mutants with disruptions in ktrB, ktrC, ktrD, and kdpA (see Table S1 in the supplemental material). No significant changes were observed in the expression of remaining intact ktr or kdp genes in response to the disruption of these genes (Fig. 4B).
FIG 4 .

Expression of K+ importer genes in LB0 in the absence of osmotic stress. (A) Absolute quantification by qPCR of transcripts from K+ importer genes. S. aureus LAC cultures were grown to late exponential phase in LB0. tpiA and fabD were used as reference genes (54). The graph at the top shows data representing the averages of biological triplicates after fabD normalization. Error bars represent standard deviations. The table at the bottom lists values for individual replicates before tpiA normalization. (B) Relative quantification by qPCR of transcripts from K+ importer genes in the S. aureus JE2 wild-type (wt) and K+ importer mutant backgrounds. tpiA and fabD were used as reference genes (54).
Previous reports have emphasized the unique ability of S. aureus to maintain relatively high intracellular K+ levels in both high- and low-osmolality environments and postulated that this is an adaptation that supports osmotolerance (4, 6, 11). The results of this study indicate roles for diverse transporters in supporting growth in the presence of 2 M NaCl but highlight contributions of K+ importers, since high cytoplasmic K+ levels would mitigate the potential cytotoxicity of the high Na+ concentration, as well as its challenge to osmoregulation. However, more specific strategies are probably also in place to export Na+ from the cytoplasm under conditions under which the large induction of nanT, for example, would result in Na+ cotransport along with the sialic acid substrate. The genomes of S. aureus and S. epidermidis both encode at least eight putative Na+/H+ antiporters that are expected to be important contributors to this activity (12). The loci that encode these proteins are apparently not induced by growth in the high-osmolality medium employed here, raising the possibility that one or more key Na+/H+ antiporters is constitutively expressed in a manner similar to that found here for the Ktr transporters.
MATERIALS AND METHODS
Bacterial strains and culture conditions.
The bacterial strains and mutants used in this work are listed in Table 1. Routine growth was carried out with LB0 medium (lysogeny broth [44] without added NaCl, i.e., 10 g tryptone and 5 g yeast extract per liter). Experimental cultures were inoculated at a normalized starting OD600 of 0.01, unless otherwise noted, from 3-ml precultures grown in screw-cap tubes. For the microarray and qPCR experiments, incubation was at 37°C at 225 rpm in a rotary shaker.
For experiments examining growth with defined concentrations of Na+ and K+, a medium (T-CDM) was developed that was based on that of Pattee and Neveln (45). The Na+ phosphate used as a buffer in the original medium was replaced with 50 mM Tris, and 1 mM phosphoric acid was added as a phosphorus source. The pH was set to 7.5 with HCl.
For growth experiments examining mutant phenotypes, a Bio-Tek Powerwave plate reader was used. Strains were inoculated at a normalized starting OD600 of 0.005 in a total of 200 µl in individual wells of 96-well plates. Plates were incubated with continuous shaking on the low setting at 37°C.
Sampling for GeneChip and qPCR experiments and RNA isolation.
RNA was isolated by a modified method that incorporates reagents from the Qiagen RNeasy kit (catalog no. 74104). Culture volumes of 30 ml were grown in 250-ml Erlenmeyer flasks to an OD600 of 0.5 to 0.7. At sampling time, 20 ml of culture was transferred to a prechilled tube containing 20 ml of a 50% ethanol–50% acetone solution and mixed by inversion. Samples were then placed immediately at −80°C for at least 16 h. Samples were thawed on ice and then centrifuged at 3,600 × g for 10 min at 4°C. Supernatants were poured off, and pellets were left to dry upside down on a Kimwipe for 15 min. Pellets were resuspended in 500 µl RLT buffer (Qiagen) and transferred to tubes containing a lysing matrix (Fisher catalog no. NC9875968). Tubes were processed in a bead beater (Biospec) for three rounds of 10 s each alternating with 1-min incubations on ice and then centrifuged at 16,000 × g for 15 min at 4°C. A 250-µl volume of the upper liquid phase was transferred to a fresh tube. After mixing with 500 µl RLT and 500 µl ethanol, the sample was applied to an RNeasy column and the RNeasy protocol was followed, including on-column DNase digestion (Qiagen RNase-free DNase set, catalog no. 79254). After RNA elution with 40 µl water, an additional DNase digestion was performed with 5 µl RQ1 buffer and 1 µl DNase (reagents from the Promega RQ1 RNase-free DNase kit [catalog no. M6101]) per sample. After a final round of the Qiagen RNeasy cleanup protocol, RNA was eluted into 30 µl of water. RNA quality was checked by agarose gel electrophoresis according to the protocol described by Sambrook et al. (46). RNA concentrations were measured with a Bio-Tek Powerwave XS2 plate reader equipped with a Take3 plate adapter.
For qPCR, cDNA was generated with the Bio-Rad iScript kit (catalog no. 170-8891) after normalizing the input RNA. One microgram of input RNA was used in the reverse transcriptase reaction. Control reactions with no reverse transcriptase added were run for representative samples and checked for DNA contamination by qPCR. Any amplifications observed in these control reactions occurred at a higher cycle number than those obtained with cDNA samples.
RNA labeling and GeneChip analysis.
RNA samples were labeled, hybridized to commercially available S. aureus Affymetrix GeneChips (part number 900514), and processed in accordance with the manufacturer’s instructions for prokaryotic arrays (Affymetrix, Santa Clara, CA). Briefly, 10 µg of each RNA sample was reverse transcribed with Superscript II reverse transcriptase (Invitrogen, Carlsbad, CA). The resulting cDNA was purified with QIAquick PCR purification kits (Qiagen, Germantown, MD), fragmented with DNase I (Ambion, Carlsbad, CA), and 3′ biotinylated with Enzo Bioarray terminal labeling kits (Enzo Life Sciences, Farmingdale, NY). Two micrograms of a labeled cDNA sample was hybridized to an S. aureus microarray for 16 h at 45°C, processed, and scanned in an Affymetrix GeneChip 3000 7G scanner as previously described (47, 48). Signal intensity values for all of the ORFs and intergenic regions represented on the microarray were normalized to the average signal of the microarray to reduce sample labeling and technical variability, and the signals for the biological replicates (n = ≥2) were averaged by using GeneSpring 7.2 software (Agilent Technologies, Redwood City, CA) (48–51). Differentially expressed transcripts were identified as those RNA species that generated a 2-fold increase or decrease in 2 M NaCl-treated cells in comparison to a no-NaCl sample (t test, P = 0.05). All related GeneChip data files were deposited in the NCBI Gene Expression Omnibus repository in the MIAME-compliant format.
qPCR assays.
qPCR experiments were conducted according to the standard protocols developed by the Mount Sinai qPCR Shared Resource Facility. These protocols rely on SYBR green-based fluorescence detection of double-stranded DNA—specificity is conferred by the primers added—and are very similar to those described by Yuen et al. (52), with the adjustment that the final reaction volume was 10 µl. Each reaction was conducted in triplicate in 384-well plates with an Applied Biosystems ABI PRISM 7900 HT sequence detection system. The PCR program consisted of an initial stage of 2 min at 95°C; 40 repeats of 15 s at 95°C, 15 s at 55°C, and 30 s at 72°C; 15 s at 95°C; 15 s at 60°C; and 15 s at 95°C. Results were analyzed using Applied Biosystems SDS 2.2.1 software with a threshold value of 3.0 and automatic baseline calculation.
For relative quantification, cycle threshold (CT) values were used to calculate fold changes in expression using the 2−2ΔΔCT method (53). Two or three reference genes were used for normalization in each experiment, selected from the less-affected genes reported for S. aureus treated with berberine (54) and were checked against each other to verify that the relative differences in their expression were between 0.5 and 2 (representing a <2-fold change in expression) (42, 43). For absolute quantification, standards of transcripts of interest were generated by dilution of conventional PCR products to concentrations ranging from 101 to 108 copies/μl. The sequences of the primers used to generate these products are listed in Table 2. These standards were run alongside samples and used to generate standard curves from which the concentrations of unknowns were calculated.
TABLE 2 .
Plasmids and primers used in this study
| Plasmid or primer | Description or sequence | Source or reference |
|---|---|---|
| Plasmids | ||
| pJB38 | 55 | |
| pJMB168 | pJB38 plus an insert designed for allelic recombination and deletion of kdpDE | This study |
| pMAD | 56 | |
| pCKP47 | pMAD plus an insert designed for allelic recombination and deletion of kdpA | This study |
| pCKP67 | pMAD plus an insert designed for allelic recombination and deletion of ktrC | This study |
| Primers | ||
| kdpA 1 f | CCTTCGCCACCAAATACAAC | |
| kdpA 1 r | TGGAGCAGGTTTGTCAGCAC | |
| cap5B f | GCGATATGCGTAAGCCAACA | |
| cap5B r | CAGATGGATTTGGAGGTACAGG | |
| SACOL0311 f (for nanT) | GCAGCTGCCGCAGTATTTAG | |
| SACOL0311 r (for nanT) | CGGTTTCGGCACTGTCTTT | |
| ktrB f | AGGTGGTCTGGGTATCGTGA | |
| ktrB r | TAACACCACCAGGTTCGTCA | |
| ktrC f | TTGGAGCAGATACGGTTGTG | |
| ktrC r | AGAATGCTCGTCTGCCAACT | |
| ktrD f | AAGAAGTGCGGGTCTTCAAA | |
| ktrD r | GTACGAATACCGCCACCAAC | |
| tpiA f | GGTGAAACAGACGAAGAG | 54 |
| tpiA r | TTACCAGTTCCGATTGCC | 54 |
| fabD f | CCTTTAGCAGTATCTGGACC | 54 |
| fabD r | GAAACTTAGCATCACGCC | 54 |
| pyk f | GCATCTGTACTCTTACGTCC | 54 |
| pyk r | GGTGACTCCAAGTGAAGA | 54 |
| proC f | GGCAGGTATTCCGATTGA | |
| proC r | CCAGTAACAGAGTGTCCAAC | |
| 2035 up 5 EcoRI | GGGGAATTCCCCCATAAATCCATTAAATGCCAGAAAATGTTTGAC | |
| 2035 up3 NheI | ACGCGTGGTACCGCTAGCGCTAGCGCGATTCAGTGTTTGACATAACCTTCACCTCG | |
| 2035 down 5 MluI | GCTAGCGGTACCACGCGTACGCGTGGCTATGTTAATAAGACTGAAATGCCTAGTTTAAG | |
| 2035 down 3 SalI | CCCGTCGACCGGTAAACCAAGTGGTTCTCGTAACAGAAATAGT | |
| kdpA AQ std. 1 | TGTCGCAATGTTTTTCATTTTT | |
| kdpA AQ std. 2 | GCAGCAGCTGATGTCATTTC | |
| ktrB AQ std. 1 | TTACTGGCTTGTCCCCAGTT | |
| ktrB AQ std. 2 | TCACGACAAAATGTCCAATACC | |
| ktrC AQ std. 1 | TGATGAACTCTTTGCCTCGTT | |
| ktrC AQ std. 2 | TATCGCTACTCATGCGGTTG | |
| ktrD AQ std. 1 | CCATGCGTTCAAAGGTTTAAG | |
| ktrD AQ std. 2 | GGTTCTCGACGTCCTGCTAT | |
| tpiA AQ std. 1 | CGAAGATAATGGTGCGTTCA | |
| tpiA AQ std. 2 | TGATGCGCCACCTACTAATG | |
| fabD AQ std. 1 | ATTAATGGCGCAAGCATTTC | |
| fabD AQ std. 2 | CTTTTCCAGGACCAATTTCAA | |
| kdpA 1–1 b | ATATAGAATTCTCACTCATCAAGTCGGCAAC | |
| kdpA 1–2 | ACGATTAGTGATACGCCAAAATACTCTTGACGATTGCACCAA | |
| kdpA 2-1 | TTGGTGCAATCGTCAAGAGTATTTTGGCGTATCACTAATCGT | |
| kdpA 2-2 | ATATAGGATCCGCGATTCGATTGCCATAAGT | |
| ktrC 1-1 | ATATAGAATTCCCCAGTTTGGGAAGTTACGA | |
| ktrC 1–2 | TTTGCCTCGTTTAATTGCAAATGCATTCAACTCACGAACG | |
| ktrC 2-1 | CGTTCGTGAGTTGAATGCATTTGCAATTAAACGAGGCAAA | |
| ktrC 2-2 | ATATAGTCGACGGCATGGTTCTCAAGGTGAT |
Construction of markerless deletions by allelic replacement.
To generate the kdpDE-deficient S. aureus USA300 LAC mutant, approximately 1,000-bp sequences upstream and downstream of the kdpDE gene pair (SAUSA300_2035-2036) were amplified by PCR with S. aureus USA300 LAC chromosomal DNA as the template and primers 2035up5EcoRI and 2035up3NheI and primers 2035down5MluI and 2035down3SalI. Amplicons were gel purified and joined by PCR with primers 2035up5EcoRI and 2035down3SalI. The PCR product was gel purified, digested with EcoRI and SalI, and ligated into similarly digested pJB38 (55). The ligation was transformed into E. coli DH5α and selected on ampicillin, and colonies were screened for the correct insert (final plasmid, pJMB168). Plasmid pJMB168 was isolated and transformed into RN4220 and selected on tryptic soy agar (TSA) containing chloramphenicol at 30°C. Plasmid pJMB202 was transduced into AH1263, and single colonies were used to inoculate 5 ml tryptic soy broth (TSB) containing chloramphenicol. Cultures were grown at 42°C overnight to select for single recombinants. Single colonies were used to inoculate 5 ml of TSB and grown overnight, and cultures were diluted 1:25,000 before plating on TSA-anhydrotetracycline to screen for loss of pJMB168. Chloramphenicol-sensitive colonies were screened for the double recombination event by PCR.
Deletions of target genes in S. aureus SH1000 were generated with pMAD (56) as previously described (57). Briefly, ~1-kb PCR products on either side of the sequence to be deleted were generated and fused by gene splicing by overlap extension (SOEing) (58). The primers used for these PCRs are listed in Table 2. The 2-kb gene SOEing product was ligated into pMAD and transformed into E. coli. After plasmid isolation and sequence verification, the construct was moved into S. aureus RN4220 by electroporation. After isolation from RN4220, the construct was electroporated into the target S. aureus SH1000 wild-type or mutant strain. The plasmid was recombined into the genome by incubating a liquid culture for 2 h at the permissive temperature (30°C), followed by 4 h at the restrictive temperature (42°C), and plating dilutions on LB0 agar containing erythromycin. Merodiploid clones (containing the plasmid recombined into the chromosome) were verified by PCR. To resolve the plasmid out of the chromosome and generate candidate deletion mutants, liquid cultures of merodiploids were incubated at 30°C without selection and transferred by 1:100 dilutions for 3 days before plating on LB0 agar. Candidate mutants were screened for loss of erythromycin resistance (confirming loss of plasmid), and PCR was used to confirm the exclusive presence of the deleted allele.
Microarray data accession number.
The microarray protocols and metafiles determined in this study have been deposited in the NCBI Gene Expression Omnibus under accession number GSE46383.
SUPPLEMENTAL MATERIAL
Growth of S. aureus USA300 LAC under conditions used to grow cultures for the microarray experiment. Bacteria were grown in 30 ml LB0 with or without 2 M NaCl in 250-ml Erlenmeyer flasks. The arrow indicates the approximate point at which samples were taken. Error bars represent the standard deviations of triplicate cultures. Download
Growth of S. aureus SH1000 in LB0 with or without 2 M NaCl or 2 M KCl. Bacteria were grown in 200 µl of medium in a 96-well plate. Error bars represent the standard deviations of triplicate cultures. Download
Measured osmolalities and trendline fits for solutions of LB0 supplemented with the indicated concentrations of osmolytes. Measurements were taken with a vapor pressure osmometer (Wescor) according to the manufacturer’s instructions. The arrow indicates the osmolality used for experiments examining KdpDE-dependent changes in gene expression (Fig. 2). Download
S. aureus genes upregulated in response to growth in 2 M NaCl.
Protein BLAST results: B. subtilis 168 ktr gene products aligned with gene products predicted from the S. aureus COL genome sequence.
S. aureus genes downregulated in response to growth in 2 M NaCl.
ACKNOWLEDGMENTS
We thank Beth Zavilowitz, Cindy Else, and Lisa Satlin for assistance with vapor pressure osmometry and flame photometry measurements and Niles Donegan for assistance in genetic manipulation of S. aureus. We thank Janet Wood for advice regarding osmolality measurements. qPCRs were run at the Mount Sinai qPCR Shared Resource Facility.
This work was supported by research grant GM28454 from the National Institute of General Medical Sciences (to T.A.K.), New York University School of Medicine development funds (to V.J.T.), grant AI073780 from the National Institute of Allergy and Infectious Diseases (to P.M.D.), and funding from the Rutgers University School of Environmental and Biological Sciences and the Charles and Joanna Busch Memorial Fund (to J.M.B.). A.P.W. was supported in part by the Systems Biology Center of New York (P50 GM071558), and M.A.B. was supported in part by an American Heart Association predoctoral fellowship (10PRE3420022).
Footnotes
Citation Price-Whelan A, Poon CK, Benson MA, Eidem TT, Roux CM, Boyd JM, Dunman PM, Torres VJ, Krulwich TA. 2013. Transcriptional profiling of Staphylococcus aureus during growth in 2 M NaCl leads to clarification of physiological roles for Kdp and Ktr K+ uptake systems. mBio 4(4):e00407-13. doi:10.1128/mBio.00407-13.
REFERENCES
- 1. Measures JC. 1975. Role of amino acids in osmoregulation of non-halophilic bacteria. Nature 257:398–400 [DOI] [PubMed] [Google Scholar]
- 2. Chapman GH. 1945. The significance of sodium chloride in studies of staphylococci. J. Bacteriol. 50:201–203 [DOI] [PubMed] [Google Scholar]
- 3. Kahl BC, Duebbers A, Lubritz G, Haeberle J, Koch HG, Ritzerfeld B, Reilly M, Harms E, Proctor RA, Herrmann M, Peters G. 2003. Population dynamics of persistent Staphylococcus aureus isolated from the airways of cystic fibrosis patients during a 6-year prospective study. J. Clin. Microbiol. 41:4424–4427 [DOI] [PMC free article] [PubMed] [Google Scholar]
- 4. Graham JE, Wilkinson BJ. 1992. Staphylococcus aureus osmoregulation: roles for choline, glycine betaine, proline, and taurine. J. Bacteriol. 174:2711–2716 [DOI] [PMC free article] [PubMed] [Google Scholar]
- 5. Csonka LN. 1989. Physiological and genetic responses of bacteria to osmotic stress. Microbiol. Rev. 53:121–147 [DOI] [PMC free article] [PubMed] [Google Scholar]
- 6. Christian JH, Waltho JA. 1961. The sodium and potassium content of non-halophilic bacteria in relation to salt tolerance. J. Gen. Microbiol. 25:97–102 [DOI] [PubMed] [Google Scholar]
- 7. Epstein W, Schultz SG. 1965. Cation transport in Escherichia coli: V. Regulation of cation content. J. Gen. Physiol. 49:221–234 [DOI] [PMC free article] [PubMed] [Google Scholar]
- 8. Ørskov SL. 1948. Experiments on active and passive permeability of Bacillus coli communis. Acta Pathol. Microbiol. Scand. 25:277–283 [Google Scholar]
- 9. Tempest DW, Meers JL, Brown CM. 1970. Influence of environment on the content and composition of microbial free amino acid pools. J. Gen. Microbiol. 64:171–185 [DOI] [PubMed] [Google Scholar]
- 10. Bremer E. 2002. Adaptation to changing osmolarity, p 385–391 In Sonenshein AL, Hoch JA, Losick R. (ed), Bacillus subtilis and its closest relatives: from genes to cells. ASM Press, Washington, DC [Google Scholar]
- 11. Christian JH, Waltho JA. 1964. The composition of Staphylococcus aureus in relation to the water activity of the growth medium. J. Gen. Microbiol. 35:205–213 [DOI] [PubMed] [Google Scholar]
- 12. Padan E, Bibi E, Ito M, Krulwich TA. 2005. Alkaline pH homeostasis in bacteria: new insights. Biochim. Biophys. Acta 1717:67–88 [DOI] [PMC free article] [PubMed] [Google Scholar]
- 13. Miller KJ, Zelt SC, Bae JH. 1991. Glycine betaine and proline are the principal compatible solutes of Staphylococcus aureus. Curr. Microbiol. 23:131–137 [Google Scholar]
- 14. Pourkomailian B, Booth IR. 1994. Glycine betaine transport by Staphylococcus aureus: evidence for feedback regulation of the activity of the two transport systems. Microbiology 140:3131–3138 [DOI] [PubMed] [Google Scholar]
- 15. Townsend DE, Wilkinson BJ. 1992. Proline transport in Staphylococcus aureus: a high-affinity system and a low-affinity system involved in osmoregulation. J. Bacteriol. 174:2702–2710 [DOI] [PMC free article] [PubMed] [Google Scholar]
- 16. Scybert S, Pechous R, Sitthisak S, Nadakavukaren MJ, Wilkinson BJ, Jayaswal RK. 2003. NaCl-sensitive mutant of Staphylococcus aureus has a Tn917-lacZ insertion in its ars operon. FEMS Microbiol. Lett. 222:171–176 [DOI] [PubMed] [Google Scholar]
- 17. Vijaranakul U, Xiong A, Lockwood K, Jayaswal RK. 1998. Cloning and nucleotide sequencing of a Staphylococcus aureus gene encoding a branched-chain-amino-acid transporter. Appl. Environ. Microbiol. 64:763–767 [DOI] [PMC free article] [PubMed] [Google Scholar]
- 18. Vijaranakul U, Nadakavukaren MJ, Bayles DO, Wilkinson BJ, Jayaswal RK. 1997. Characterization of an NaCl-sensitive Staphylococcus aureus mutant and rescue of the NaCl-sensitive phenotype by glycine betaine but not by other compatible solutes. Appl. Environ. Microbiol. 63:1889–1897 [DOI] [PMC free article] [PubMed] [Google Scholar]
- 19. Domínguez-Ferreras A, Muñoz S, Olivares J, Soto MJ, Sanjuán J. 2009. Role of potassium uptake systems in Sinorhizobium meliloti osmoadaptation and symbiotic performance. J. Bacteriol. 191:2133–2143 [DOI] [PMC free article] [PubMed] [Google Scholar]
- 20. Gowrishankar J. 1985. Identification of osmoresponsive genes in Escherichia coli: evidence for participation of potassium and proline transport systems in osmoregulation. J. Bacteriol. 164:434–445 [DOI] [PMC free article] [PubMed] [Google Scholar]
- 21. Laimins LA, Rhoads DB, Epstein W. 1981. Osmotic control of kdp operon expression in Escherichia coli. Proc. Natl. Acad. Sci. U. S. A. 78:464–468 [DOI] [PMC free article] [PubMed] [Google Scholar]
- 22. Matsunaga J, Coutinho ML. 2012. Positive regulation of Leptospira interrogans kdp expression by KdpE as demonstrated with a novel beta-galactosidase reporter in Leptospira biflexa. Appl. Environ. Microbiol. 78:5699–5707 [DOI] [PMC free article] [PubMed] [Google Scholar]
- 23. Polarek JW, Williams G, Epstein W. 1992. The products of the kdpDE operon are required for expression of the Kdp ATPase of Escherichia coli. J. Bacteriol. 174:2145–2151 [DOI] [PMC free article] [PubMed] [Google Scholar]
- 24. Walderhaug MO, Polarek JW, Voelkner P, Daniel JM, Hesse JE, Altendorf K, Epstein W. 1992. KdpD and KdpE, proteins that control expression of the kdpABC operon, are members of the two-component sensor-effector class of regulators. J. Bacteriol. 174:2152–2159 [DOI] [PMC free article] [PubMed] [Google Scholar]
- 25. Xue T, You Y, Hong D, Sun H, Sun B. 2011. The Staphylococcus aureus KdpDE two-component system couples extracellular K+ sensing and Agr signaling to infection programming. Infect. Immun. 79:2154–2167 [DOI] [PMC free article] [PubMed] [Google Scholar]
- 26. Zhao L, Xue T, Shang F, Sun H, Sun B. 2010. Staphylococcus aureus AI-2 quorum sensing associates with the KdpDE two-component system to regulate capsular polysaccharide synthesis and virulence. Infect. Immun. 78:3506–3515 [DOI] [PMC free article] [PubMed] [Google Scholar]
- 27. O’Riordan K, Lee JC. 2004. Staphylococcus aureus capsular polysaccharides. Clin. Microbiol. Rev. 17:218–234 [DOI] [PMC free article] [PubMed] [Google Scholar]
- 28. Townsend DE, Kaenjak A, Jayaswal RK, Wilkinson BJ. 1996. Proline is biosynthesized from arginine in Staphylococcus aureus. Microbiology 142:1491–1497 [DOI] [PubMed] [Google Scholar]
- 29. Zaprasis A, Brill J, Thüring M, Wünsche G, Heun M, Barzantny H, Hoffmann T, Bremer E. 2013. Osmoprotection of Bacillus subtilis through import and proteolysis of proline-containing peptides. Appl. Environ. Microbiol. 79:576–587 [DOI] [PMC free article] [PubMed] [Google Scholar]
- 30. Stapleton MR, Horsburgh MJ, Hayhurst EJ, Wright L, Jonsson IM, Tarkowski A, Kokai-Kun JF, Mond JJ, Foster SJ. 2007. Characterization of IsaA and SceD, two putative lytic transglycosylases of Staphylococcus aureus. J. Bacteriol. 189:7316–7325 [DOI] [PMC free article] [PubMed] [Google Scholar]
- 31. Olson ME, King JM, Yahr TL, Horswill AR. 2013. Sialic acid catabolism in Staphylococcus aureus. J. Bacteriol. 195:1779–1788 [DOI] [PMC free article] [PubMed] [Google Scholar]
- 32. Almagro-Moreno S, Boyd EF. 2009. Insights into the evolution of sialic acid catabolism among bacteria. BMC Evol. Biol. 9:118. 10.1186/1471-2148-9-118 [DOI] [PMC free article] [PubMed] [Google Scholar]
- 33. Kluytmans J, van Belkum A, Verbrugh H. 1997. Nasal carriage of Staphylococcus aureus: epidemiology, underlying mechanisms, and associated risks. Clin. Microbiol. Rev. 10:505–520 [DOI] [PMC free article] [PubMed] [Google Scholar]
- 34. Corratgé-Faillie C, Jabnoune M, Zimmermann S, Véry AA, Fizames C, Sentenac H. 2010. Potassium and sodium transport in non-animal cells: the Trk/Ktr/HKT transporter family. Cell. Mol. Life Sci. 67:2511–2532 [DOI] [PMC free article] [PubMed] [Google Scholar]
- 35. Roosild TP, Castronovo S, Miller S, Li C, Rasmussen T, Bartlett W, Gunasekera B, Choe S, Booth IR. 2009. KTN (RCK) domains regulate K+ channels and transporters by controlling the dimer-hinge conformation. Structure 17:893–903 [DOI] [PMC free article] [PubMed] [Google Scholar]
- 36. Kröning N, Willenborg M, Tholema N, Hänelt I, Schmid R, Bakker EP. 2007. ATP binding to the KTN/RCK subunit KtrA from the K+-uptake system KtrAB of Vibrio alginolyticus: its role in the formation of the KtrAB complex and its requirement in vivo. J. Biol. Chem. 282:14018–14027 [DOI] [PubMed] [Google Scholar]
- 37. Holtmann G, Bakker EP, Uozumi N, Bremer E. 2003. KtrAB and KtrCD: two K+ uptake systems in Bacillus subtilis and their role in adaptation to hypertonicity. J. Bacteriol. 185:1289–1298 [DOI] [PMC free article] [PubMed] [Google Scholar]
- 38. Ballal A, Basu B, Apte SK. 2007. The Kdp-ATPase system and its regulation. J. Biosci. 32:559–568 [DOI] [PubMed] [Google Scholar]
- 39. Vieira-Pires RS, Szollosi A, Morais-Cabral JH. 2013. The structure of the KtrAB potassium transporter. Nature 496:323–328 [DOI] [PubMed] [Google Scholar]
- 40. Fey PD, Endres JL, Yajjala VK, Widhelm TJ, Boissy RJ, Bose JL, Bayles KW. 2013. A genetic resource for rapid and comprehensive phenotype screening of nonessential Staphylococcus aureus genes. mBio 4(1):e00537-12. 10.1128/mBio.00537-12 [DOI] [PMC free article] [PubMed] [Google Scholar]
- 41. Corrigan RM, Campeotto I, Jeganathan T, Roelofs KG, Lee VT, Gründling A. 2013. Systematic identification of conserved bacterial c-di-AMP receptor proteins. Proc. Natl. Acad. Sci. U. S. A. 110:9084–9089 [DOI] [PMC free article] [PubMed] [Google Scholar]
- 42. Valihrach L, Demnerova K. 2012. Impact of normalization method on experimental outcome using RT-qPCR in Staphylococcus aureus. J. Microbiol. Methods 90:214–216 [DOI] [PubMed] [Google Scholar]
- 43. Bustin SA, Benes V, Garson JA, Hellemans J, Huggett J, Kubista M, Mueller R, Nolan T, Pfaffl MW, Shipley GL, Vandesompele J, Wittwer CT. 2009. The MIQE guidelines: minimum information for publication of quantitative real-time PCR experiments. Clin. Chem. 55:611–622 [DOI] [PubMed] [Google Scholar]
- 44. Bertani G. 2004. Lysogeny at mid-twentieth century: P1, P2, and other experimental systems. J. Bacteriol. 186:595–600 [DOI] [PMC free article] [PubMed] [Google Scholar]
- 45. Pattee PA, Neveln DS. 1975. Transformation analysis of three linkage groups in Staphylococcus aureus. J. Bacteriol. 124:201–211 [DOI] [PMC free article] [PubMed] [Google Scholar]
- 46. Sambrook J, Russell DW. 2001. Molecular cloning: a laboratory manual, 3rd ed, p. 7.31–7.34. Cold Spring Harbor Laboratory Press, Cold Spring Harbor, NY [Google Scholar]
- 47. Dunman PM, Murphy E, Haney S, Palacios D, Tucker-Kellogg G, Wu S, Brown EL, Zagursky RJ, Shlaes D, Projan SJ. 2001. Transcription profiling-based identification of Staphylococcus aureus genes regulated by the agr and/or sarA loci. J. Bacteriol. 183:7341–7353 [DOI] [PMC free article] [PubMed] [Google Scholar]
- 48. Beenken KE, Dunman PM, McAleese F, Macapagal D, Murphy E, Projan SJ, Blevins JS, Smeltzer MS. 2004. Global gene expression in Staphylococcus aureus biofilms. J. Bacteriol. 186:4665–4684 [DOI] [PMC free article] [PubMed] [Google Scholar]
- 49. Bischoff M, Dunman P, Kormanec J, Macapagal D, Murphy E, Mounts W, Berger-Bächi B, Projan S. 2004. Microarray-based analysis of the Staphylococcus aureus sigmaB regulon. J. Bacteriol. 186:4085–4099 [DOI] [PMC free article] [PubMed] [Google Scholar]
- 50. Anderson KL, Roberts C, Disz T, Vonstein V, Hwang K, Overbeek R, Olson PD, Projan SJ, Dunman PM. 2006. Characterization of the Staphylococcus aureus heat shock, cold shock, stringent, and SOS responses and their effects on log-phase mRNA turnover. J. Bacteriol. 188:6739–6756 [DOI] [PMC free article] [PubMed] [Google Scholar]
- 51. Roberts C, Anderson KL, Murphy E, Projan SJ, Mounts W, Hurlburt B, Smeltzer M, Overbeek R, Disz T, Dunman PM. 2006. Characterizing the effect of the Staphylococcus aureus virulence factor regulator, SarA, on log-phase mRNA half-lives. J. Bacteriol. 188:2593–2603 [DOI] [PMC free article] [PubMed] [Google Scholar]
- 52. Yuen T, Zhang W, Ebersole BJ, Sealfon SC. 2002. Monitoring G-protein-coupled receptor signaling with DNA microarrays and real-time polymerase chain reaction. Methods Enzymol. 345:556–569 [DOI] [PubMed] [Google Scholar]
- 53. Livak KJ, Schmittgen TD. 2001. Analysis of relative gene expression data using real-time quantitative PCR and the 2(-Delta Delta C(T)) method. Methods 25:402–408 [DOI] [PubMed] [Google Scholar]
- 54. Theis T, Skurray RA, Brown MH. 2007. Identification of suitable internal controls to study expression of a Staphylococcus aureus multidrug resistance system by quantitative real-time PCR. J. Microbiol. Methods 70:355–362 [DOI] [PubMed] [Google Scholar]
- 55. Wörmann ME, Reichmann NT, Malone CL, Horswill AR, Gründling A. 2011. Proteolytic cleavage inactivates the Staphylococcus aureus lipoteichoic acid synthase. J. Bacteriol. 193:5279–5291 [DOI] [PMC free article] [PubMed] [Google Scholar]
- 56. Arnaud M, Chastanet A, Débarbouillé M. 2004. New vector for efficient allelic replacement in naturally nontransformable, low-GC-content, gram-positive bacteria. Appl. Environ. Microbiol. 70:6887–6891 [DOI] [PMC free article] [PubMed] [Google Scholar]
- 57. Memmi G, Filipe SR, Pinho MG, Fu Z, Cheung A. 2008. Staphylococcus aureus PBP4 is essential for beta-lactam resistance in community-acquired methicillin-resistant strains. Antimicrob. Agents Chemother. 52:3955–3966 [DOI] [PMC free article] [PubMed] [Google Scholar]
- 58. Horton RM. 1995. PCR-mediated recombination and mutagenesis. SOEing together tailor-made genes. Mol. Biotechnol. 3:93–99 [DOI] [PubMed] [Google Scholar]
- 59. Kennedy AD, Otto M, Braughton KR, Whitney AR, Chen L, Mathema B, Mediavilla JR, Byrne KA, Parkins LD, Tenover FC, Kreiswirth BN, Musser JM, DeLeo FR. 2008. Epidemic community-associated methicillin-resistant Staphylococcus aureus: recent clonal expansion and diversification. Proc. Natl. Acad. Sci. U. S. A. 105:1327–1332 [DOI] [PMC free article] [PubMed] [Google Scholar]
- 60. Horsburgh MJ, Aish JL, White IJ, Shaw L, Lithgow JK, Foster SJ. 2002. sigmaB modulates virulence determinant expression and stress resistance: characterization of a functional rsbU strain derived from Staphylococcus aureus 8325-4. J. Bacteriol. 184:5457–5467 [DOI] [PMC free article] [PubMed] [Google Scholar]
- 61. O’Neill AJ. 2010. Staphylococcus aureus SH1000 and 8325-4: comparative genome sequences of key laboratory strains in staphylococcal research. Lett. Appl. Microbiol. 51:358–361 [DOI] [PubMed] [Google Scholar]
- 62. Woodcock DM, Crowther PJ, Doherty J, Jefferson S, DeCruz E, Noyer-Weidner M, Smith SS, Michael MZ, Graham MW. 1989. Quantitative evaluation of Escherichia coli host strains for tolerance to cytosine methylation in plasmid and phage recombinants. Nucleic Acids Res. 17:3469–3478 [DOI] [PMC free article] [PubMed] [Google Scholar]
Associated Data
This section collects any data citations, data availability statements, or supplementary materials included in this article.
Supplementary Materials
Growth of S. aureus USA300 LAC under conditions used to grow cultures for the microarray experiment. Bacteria were grown in 30 ml LB0 with or without 2 M NaCl in 250-ml Erlenmeyer flasks. The arrow indicates the approximate point at which samples were taken. Error bars represent the standard deviations of triplicate cultures. Download
Growth of S. aureus SH1000 in LB0 with or without 2 M NaCl or 2 M KCl. Bacteria were grown in 200 µl of medium in a 96-well plate. Error bars represent the standard deviations of triplicate cultures. Download
Measured osmolalities and trendline fits for solutions of LB0 supplemented with the indicated concentrations of osmolytes. Measurements were taken with a vapor pressure osmometer (Wescor) according to the manufacturer’s instructions. The arrow indicates the osmolality used for experiments examining KdpDE-dependent changes in gene expression (Fig. 2). Download
S. aureus genes upregulated in response to growth in 2 M NaCl.
Protein BLAST results: B. subtilis 168 ktr gene products aligned with gene products predicted from the S. aureus COL genome sequence.
S. aureus genes downregulated in response to growth in 2 M NaCl.