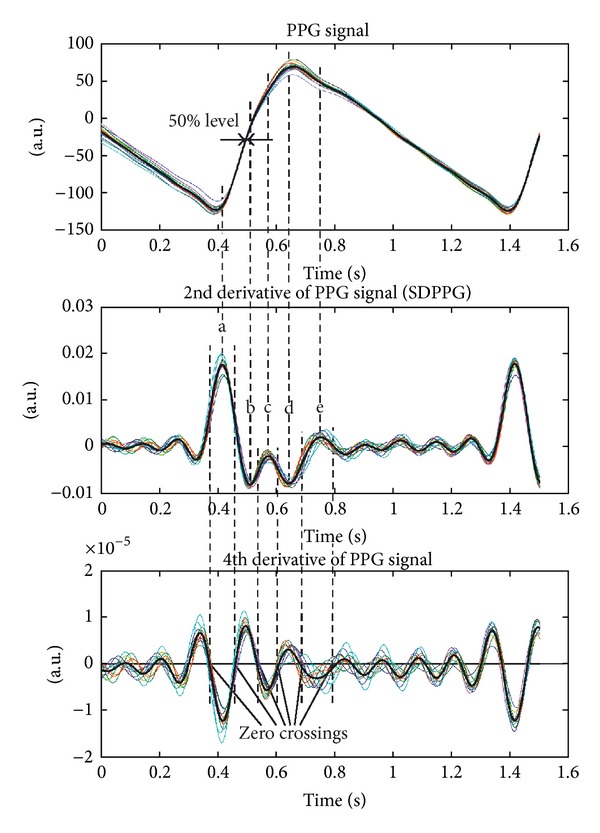
Figure 4.

The averaged PPG and its second derivative and fourth derivative waveforms (black bold line) with filtered and normalized recurrences (thin lines). The recurrences are aligned according to 50% of the PPG signal raising front and the distinct waves “a”, “b”, “c”, “d”, and “e” are detected by using the zero crossings of the fourth derivative.
