Abstract
To facilitate the study of the CaMKIIα function in vivo, a CaMKIIα-GFP transgenic mouse line was generated. Here, our goal is to provide the first neuroanatomical characterization of GFP expression in the CNS of this line of mouse. Overall, CaMKIIα -GFP expression is strong and highly heterogeneous, with the dentate gyrus of the hippocampus as the most abundantly expressed region. In the hippocampus, around 70% of granule and pyramidal neurons expressed strong GFP. In the neocortex, presumed pyramidal neurons were GFP positive: around 32% of layer II/III and 35% of layer VI neurons expressed GFP, and a lower expression rate was found in other layers. In the thalamus and hypothalamus, strong GFP signals were detected in the neuropil. GFP-positive cells were also found in many other regions such as the spinal trigeminal nucleus, cerebellum and basal ganglia. We further compared the GFP expression with specific antibody staining for CaMKIIα and GABA. We found that GFP+ neurons were mostly positive for CaMKIIα-IR throughout the brain, with some exceptions throughout the brain, especially in the deeper layers of neocortex. GFP and GABA-IR marked distinct neuronal populations in most brain regions with the exception of granule cells in the olfactory bulb, purkinje cells in the cerebellar, and some layer I cells in neocortex. In conclusion, GFP expression in the CaMKIIα-GFP mice is similar to the endogenous expression of CaMKIIα protein, thus these mice can be used in in vivo and in vitro physiological studies in which visualization of CaMKIIα- neuronal populations is required.
Keywords: Calmodulin, Ca2+/CaM-activated protein kinase II alpha, green fluorescent protein, dentate gyrus, CA1, cerebellum, neocortex, hypothalamus, thalamus, CNS
INTRODUCTION
In the nervous system, calcium (Ca2+), a universal second messenger in many cellular functions of eukaryotic cells, plays an essential role in key cellular processes ranging from vesicle fusion to enzyme activation. In excitable cells, cytosolic Ca2+ is kept at very low concentrations. A rise in intracellular Ca2+ concentration is able to activate Ca2+ binding protein, calmodulin (CaM) and its downstream targets (Chin and Means, 2000). The binding of Ca2+/CaM consequently activates a wide range of enzymes including most of Ca2+/CaM-activated protein kinases (CaMKs), a family of enzymes that can alter the function of proteins by phosphorylation (Schulman and Greengard, 1978a;Schulman and Greengard, 1978b). Among them, CaMKII is central to the coordination and execution of Ca2+ signal transduction (Coultrap and Bayer, 2012). In particular, it is an important mediator for learning and memory in vivo (Rotenberg et al., 1996;Hudmon and Schulman, 2002). Being a Ser/Thr protein kinase like most other CaMKs, CaMKII is also unique in that it undergoes autophosphorylation (Saitoh and Schwartz, 1985;Lai et al., 1986;Miller and Kennedy, 1986). The autophosphorylation process converts CaMKII to a Ca2+-independent enzyme by increasing its affinity for calmodulin by a thousand times (Meyer et al., 1992;Coultrap et al., 2010). This autonomy of CaMKII is shown to be required for memory formation in the hippocampus (Buard et al., 2010). The downstream targets of CaMKII are proteins involved in many essential cellular functions in synaptic transmission and plasticity. By phosphorylating tyrosine hydroxylase and tryptophan hydroxylase, CaMKII regulates the synthesis of neurotransmitters like catecholamine and serotonin (Itagaki et al., 1999;Jiang et al., 2000). In the synaptic terminals, the Ca2+/ATP-dependent interaction of CaMKIIα and syntaxin plays an important role in the regulation of exocytosis of neurotransmitter vesicles (Ohyama et al., 2002). CaMKII alters ion channel activity and enhances LTP capability in the hippocampus CA1 by phosphorylating the GLuR1 subunit of AMPA-R (Soderling and Derkach, 2000;Nicoll and Malenka, 1999) and the NR2B subunit of the NMDA (N-methyl-D-aspartate) receptor (Omkumar et al., 1996;Bayer et al., 2006). Inhibitory synaptic plasticity is also modulated by CaMKII in a synapse-specific fashion through enhancing the GABAa receptor insertion and phosphorylation (Houston, He, and Smart, 2009;Marsden et al., 2010). The phosphorylation of microtubule proteins including tubulin, microtubule-associated-proteins (MAPs), and Tau by CaMKIIα can alter the dynamic of neuronal cytoskeleton and further affect intracellular trafficking and processes outgrowth in differentiating neurons (Yamauchi and Fujisawa, 1983;Yamauchi and Fujisawa, 1984;Singh et al., 1996;Drubin and Nelson, 1996). Furthermore, over-expression of CaMKII in neuronal culture stimulates neurite outgrowth and growth cone mobility (Goshima et al., 1993;Nomura et al., 1997).
In previous studies, in situ hybridization and immunohistochemistry have been used to examine the regional or cellular distribution of CaMKII in the brain. CaMKII-IR has been found abundantly throughout the brain. In the rat brain, CaMKII takes up to 1% in the forebrain and 2% in the hippocampus of all proteins expressed (Erondu and Kennedy, 1985). CaMKII has four isoform: α, β, γ and δ. In early developmental stages of brains, only γ and δ isoforms are expressed (Bayer et al., 1999). In adult brains, γ and δ isoform expression is over-casted by high expression levels of α and β isoforms. α isoform is located mainly in the forebrain, while there are more β and δ isoforms in the cerebellum (Miller and Kennedy, 1985). On the subcellular level, CaMKII is present in both cytosol and specific subcellular compartments. α and β isoforms display a different distribution by light and electron microscopic analysis both regionally and subcellularly (Tobimatsu and Fujisawa, 1989;Ochiishi, Terashima, and Yamauchi, 1994). Activity-dependent translocation and clustering of CaMKII mediated by NMDA have also been described (Merrill et al., 2005).
To study the physiological role of CaMKII in vivo, CaMKII knock-out mice were generated and found to have severely impaired LTP in the hippocampus and impaired spatial learning (Silva et al., 1992). Increased level or mutated forms of other CaMKII subtypes have been found to alter memory formation as well (Elgersma, Sweatt, and Giese, 2004). Evidently, either an increase or reduction of CaMKII activities or protein levels leads to impaired learning and abnormal behavior. These CaMKII mutants provide wealthy information on the physiological role of CaMKII in hippocampal plasticity, cortical plasticity, and learning and memory. CaMKIIα-IR is known to be observed in a cell type specific manner, i.e. glutamatergic neurons in the neocortex, hippocampus and piriform cortex (Jones et al., 1994;McDonald et al., 2002;Benson et al., 1991;Zou et al., 2002). Further study on the distribution of CaMKIIα expression can provide deeper understanding on the underlying mechanisms of these findings. However, no current tool provides means to facilitate the observation of CaMKIIα expression in vivo or in vitro. Green Fluorescence Protein (GFP), originally from jellyfish Aequorea Victoria, has been widely used in molecular biology as well as neuroscience to visualize proteins in vivo and further understand many key biological processes (Shimomura, 2006;Chalfie, 2009;Tsien, 2010). Transgenic mice, in which GFP expression is under the control of various promoters, have been widely used in developmental biology, anatomy, and physiological studies. For example, transgenic mice in which GFP expression is controlled by GAD65/67 promoter have been widely used in physiological and anatomical studies (Tamamaki et al., 2003;Hanamura et al., 2010;Sosulina et al., 2010;Zhang et al., 2006;Bagley and Belluscio, 2010). However, transgenic mice in which GFP expression is regulated under the camk2α promoter (named CaMKIIα -GFP hereafter)have not been described nor characterized. Our first goal here is to provide an anatomical survey of CaMKIIα -GFP expression in key regions of the CNS and examine the specificity of GFP expression using CaMKII-IR. Our second goal is to examine whether GFP can be used as a cell-type specific marker by examining the colocalization of GFP+ with GABA-IR+ cells in several CNS regions. Our results show that CaMKIIα-GFP mice can be used for the visualization of CamKIIα-expressing neurons in in vivo and in vitro physiological studies. This study also helps to provide information on the distribution of CaMKIIα expression in many CNS regions, which may assist with the understanding of CaMKIIα function in the CNS.
RESULT
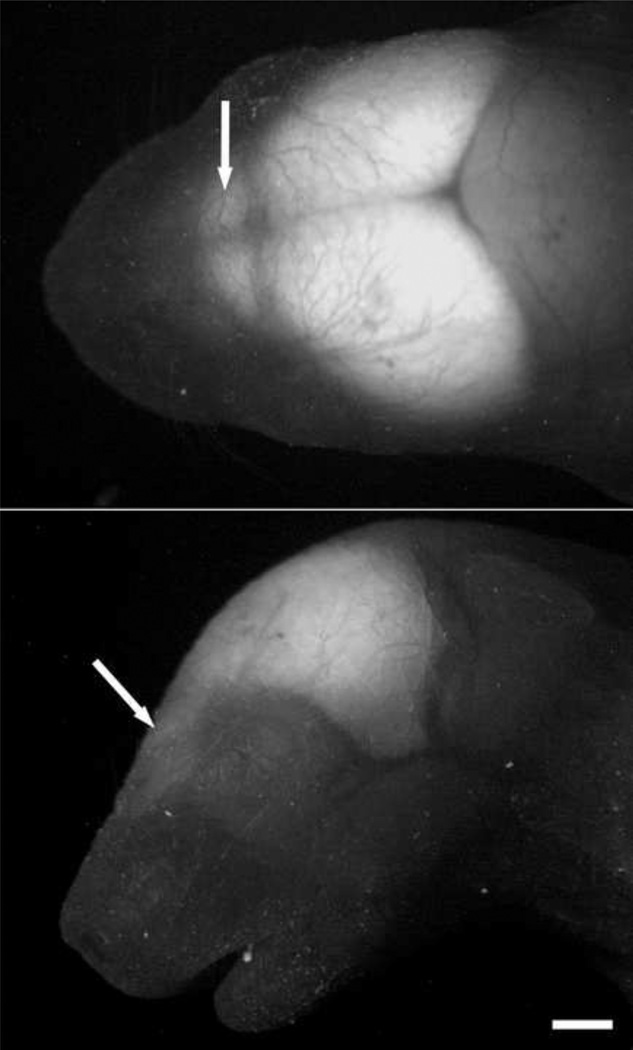
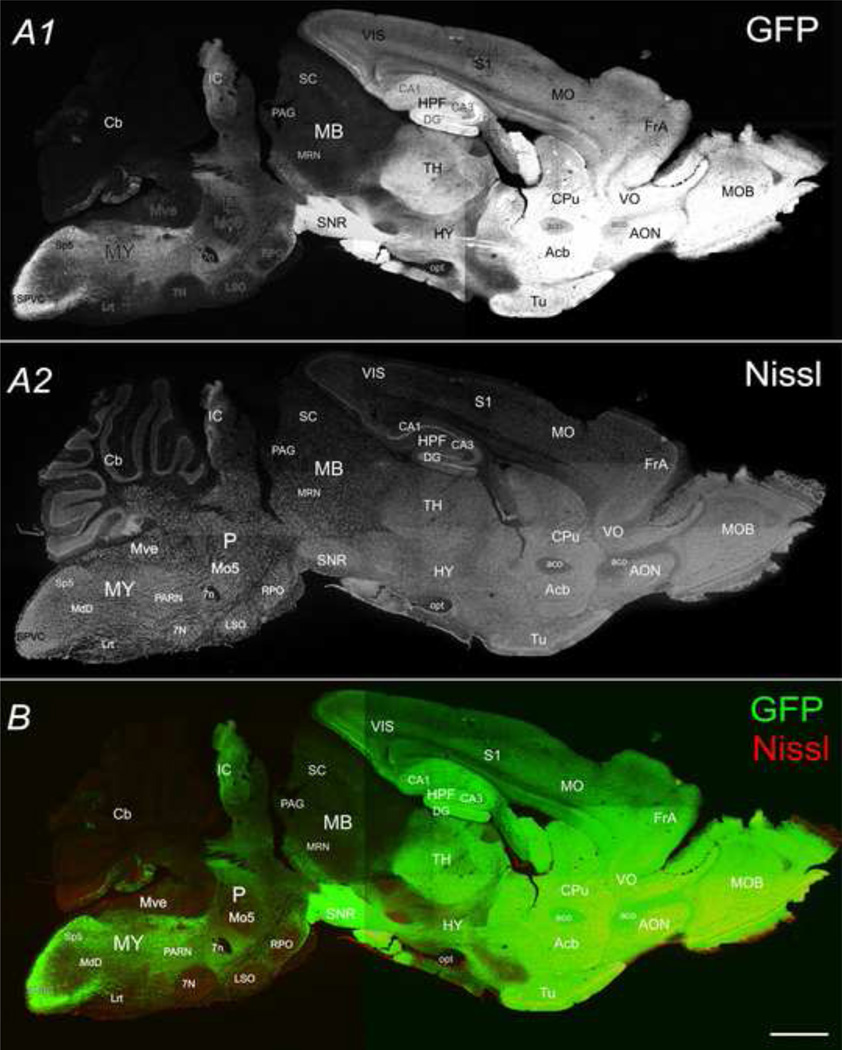
Conspicuous fluorescence of GFP could be observed through the skull of new born mice with a blue LED under a dissecting fluorescence microscope with Uvex safety eyeglasses with orange XTR lenses (Smithfield, RI). Phenotyping of the transgenetic mice could be achieved by checking the head of mice for the clear GFP signal within first postnatal day (P0) (shown in Fig. 1). GFP fluorescence was seen throughout the brain, from olfactory bulb, cerebral cortex to medulla, as shown in a picture of a mouse head taken under a dissecting fluorescence microscope (Fig. 1). Our initial inspection of GFP expression in the adult brain was conducted in 30 µm thick sagittal (e.g. Fig. 2, lateral 1.10 mm) and coronal sections (e.g. Fig. 3) of a perfused adult mouse brain. Overall, the intensity of GFP was highest in the forebrain and highly heterogeneous across brain regions. GFP was found in Nissl-stained cell bodies, as well as in neuropil. The highest intensity was emitted from the dentate gyrus (DG) of the hippocampus (Fig. 2 & 3). Following the rostral to caudal axis, relatively modest (compared with DG) GFP intensities were also observed in the main olfactory bulb (MOB), anterior olfactory nucleus (AON), ventral orbital cortex (VO), caudoputamen (CPu), thalamus (TH), hippocampus CA1 & 3 region, substantia nigra (SNR), and Inferior Collicullus (IC) (Fig. 2). GFP fluorescence was also found to be expressed differentially in different layers of neocortex and piriform cortex (Pir), forming a bright band at roughly layer II/III in neocortex and layer II in piriform cortex (Fig. 3). Within the midbrain, GFP signals were low to modest. Within the posterior lobes of the cerebellum (Cb), a bright GFP-positive Purkinje cell layer was readily visible. Varying degrees of GFP intensity was found within the medulla (Fig. 2).
Fig. 1.
The visualization for CaMKIIα -GFP in an intact new born mouse head. CaMKIIα -GFP in the head of a postnatal day 1 mouse visualized under a dissecting microscope. White arrows mark the olfactory bulbs. A) Dorsal aspect; B) Lateral aspect. Scale bar =1mm.
Fig. 2.
The sagittal view of CaMKIIα -GFP in an adult mouse brain. Confocal image montage shows GFP (A1), Nissl (A2) in a 30µm sagittal section (lateral 1.10mm) from a postnatal day 83 mouse brain. B is a merged image of A1 and A2. Scale bar = 500 µm.
Fig. 3.
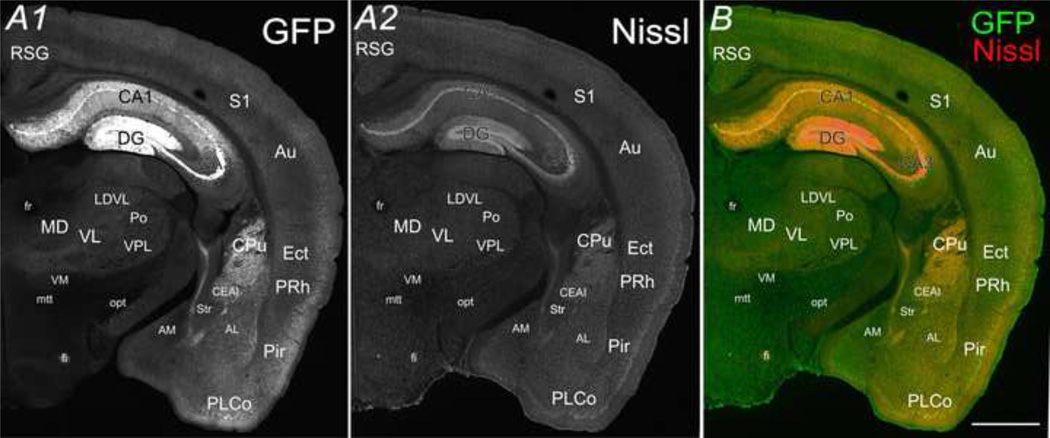
The coronal view of CaMKIIα -GFP in an adult mouse brain. GFP (A1) and Nissl (A2) in a 30µm coronal section (Bregma −2.22mm) from a postnatal day 83 mouse brain. B is a merged image of A1 and A2. Scale bar = 500 µm.
Within coronal sections of the adult brain (e.g. Fig. 3, Bregma −2.22mm), the highest GFP signal was detected in the hippocampus, especially within the dentate gyrus (DG) followed by pyramidal layers of CA1 & 3 (Fig. 3). Conspicuous GFP fluorescence was observed in the cerebral cortex as well, in addition to the retrosplendial granular cortex (RSG), primary somatosensory cortex (S1), auditory cortex (Au), ectorhinal cortex (Ect), perirhinal cortex (PRh), Piriform cortex (Pir), and posterolateral cortical amygdaloid nucleus (PLCo). In RSG, S1 and Au, a bright band at layer II/III and a dark band at layer IV/V were observed (Fig. 3A). In the thalamus, a relatively stronger GFP signal was detected in the laterodorsal ventrolateral section (LDVL), ventrolateral section (VL), and ventral posterolateral nucleus (VPL), while a weaker GFP signal was detected in the ventromedial nucleus (VM), mediodorsal nucleus (MD), and posterior complex (Po). In the basal ganglia, moderate GFP signal was observed in the caudate putamen (CPu), the central and medial amygdala nucleus (CEAI) in contrast to the dark area in the stria terminalis (str) (Fig. 3A). Apparent lack of CaMKIIα-GFP was observed in most of the axonal tracts, for instance, fasciculus retroflexus (fr), mammilothalmic tract (mtt), optic tract (opt), with the exception of the fornix (fi).
To further investigate the distribution of GFP fluorescence within local circuits of specific nucleus, we used Nissl staining to mark the neuronal population and took microphotographs with higher magnification using either an epifluorescent or a confocal microscope.
Hippocampus
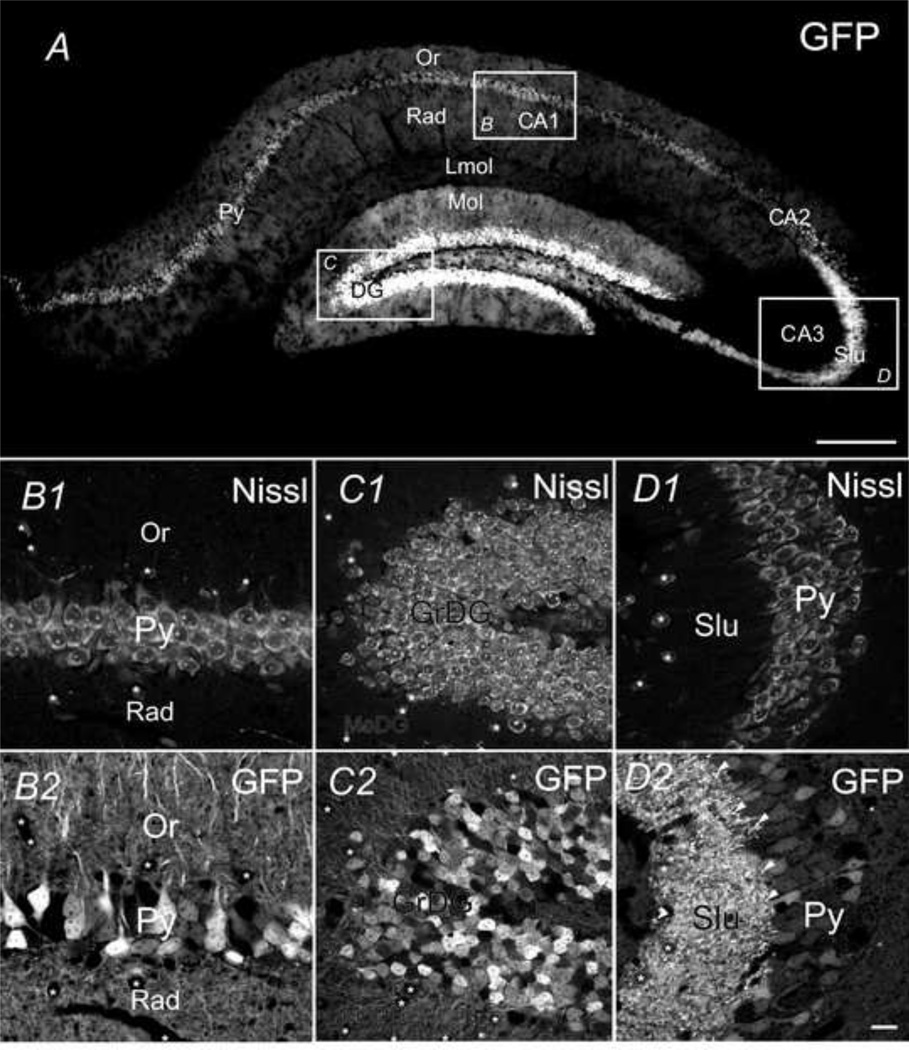
As shown in Fig. 4A, the strongest GFP fluorescence signal observed in hippocampus was due to strong expression of GFP in the granular layer of DG, as well as the pyramidal cell layer within field CA1 and CA3. Polymorph layer of DG (PoDG), stratum oriens (Or), stratum lucidum (Slu), and radiatum (Rad) were also marked with robust GFP. DG showed the highest intensity of GFP signal among all subregions of the hippocampus, due to the highest GFP-positive cell density (8920 cells /mm2); intense GFP fluorescence was also found in the nerve fibers in stratum molecular (MoDG) and polymorphic layers (PoDG) (Fig 4C1 & C2). In different subregions, somatic GFP signal was distributed in a different laminar fashion: in DG, only granular layer expressed conspicuous GFP, leaving interneurons appearing as dark hollow areas (marked with asterisks in Fig. 4C) in the background of GFP+ dendrites in MoDG and PoDG. Similarly, in CA1 and CA3, GFP-positive neurons were exclusively found to be large pyramidal neurons in the stratum pyramidale (Py), while dark hollow areas were formed by presumed interneurons (marked with asterisks in Fig. 4B and D) in stratum oriens and stratum radiatum. Proximal CA3 pyramidal dendrites near mossy fibers had the strongest GFP fluorescence, appearing as bright puncta located near the proximal dendrites (marked with white arrows in Fig. 4D2). In the case of GFP-positive granule cells and pyramidal neurons in DG, CA1 and CA3, both somata and large diameter processes (presumed apical dendrites) were clearly GFP positive (e.g. Fig. 4B2, C2 & D2). In field CA1, we found that 69% (69 ± 10%, n=3 sections) of Nissl positive cells were GFP-positive. GFP fluorescence was expressed in somata (Py) and dendrites (Or), as well as fine processes (presumed axons) or terminal-like puncta in the neuropil region (Rad, Fig. 4B2). Fig. 4C shows that in DG, GFP fluorescence was also expressed in both somata (72 ± 8%, n=5 sections) and dendrites of presumed granule neurons. In the pyramidal layer of CA3 (Py), 74% (74 ± 4%, n=3 sections) of the Nissl stained neurons expressed modest levels of GFP, however, GFP signal was significantly stronger in the mossy fibers of the stratum lucidum (Slu, Fig 4D). Modest to low levels of GFP expression were detected in presumed axons or terminal-like puncta in the neuropil region (Fig. 4D2).
Fig. 4.
The coronal view of CaMKIIα -GFP in the hippocampus. GFP in hippocampus in a 30µm coronal section (Bregma −2.22mm) (A). Higher magnification confocal microscopic images of GFP (B2 C2 and D2) and Nissl (B1 C1 and D1) in CA1 field (B), dentate gyrus (C) and CA3 field (D). Scale bar = 100µm in A and 20µm in the other panels.
Neocortex cortex
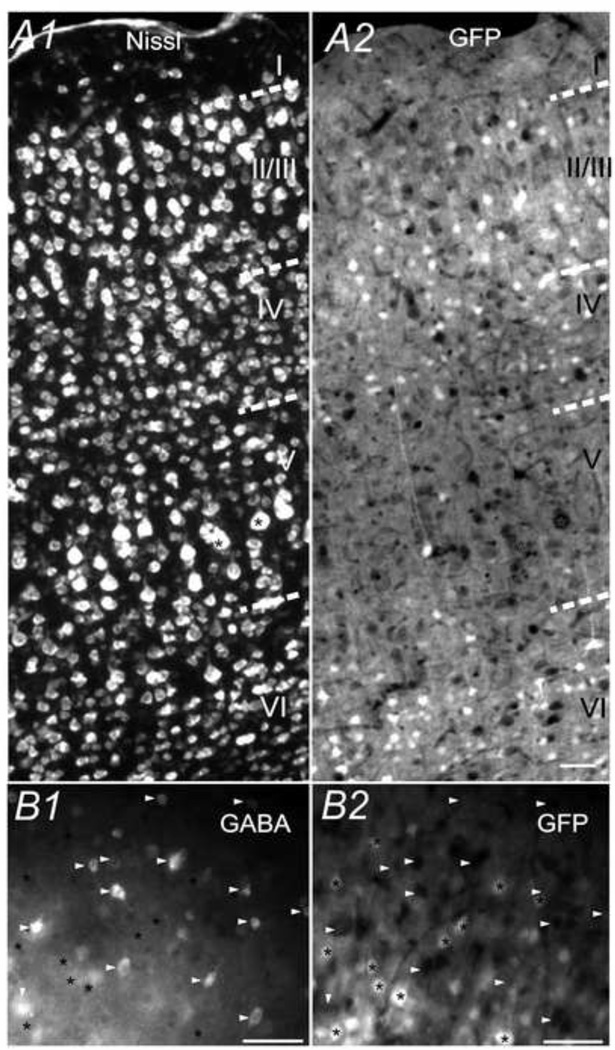
According to layers defined by cell density and morphology in Nissl-stained brain sections (e.g. Fig. 5A1), we could observe non-uniform distributions of GFP fluorescence between layers throughout neocortical regions (e.g. Fig. 3 & 5). In the primary somatosensory cortex layer I, scattered fine processes (both vertical and horizontal) emitted moderate GFP signals, but very few GFP positive somata were seen. In layer II/III, 32 ± 2% (n=5 sections) of Nissl-positive cells were GFP-positive. GFP expressing cells mostly appeared to be small-sized pyramidal neurons, based on the shape of the somata and apical dendrites. Immunofluoresent GABA staining showed that these GFP+ cells were not GABAergic cells in this layer (Fig. 5B). Presumed long apical dendrites of pyramidal neurons were also marked with GFP. In layer IV, which consisted of a variety of spiny stellate and star pyramidal neurons, only 7.14 ± 0.2% (n=5 brain slices) of the Nissl population emitted a GFP signal. Interestingly, in layer V where large pyramidal neurons are located, lower than 10% (9.5 ± 0.5%, n=5 sections) of the neurons expressed GFP. In some presumed large pyramidal cells, GFP were entirely absent, leaving cell bodies of these cells appearing as dark holes (marked with * in Fig. 5A). In layer VI, 35 ± 2% (n=5 sections) of Nissl-positive cells were GFP-positive. From their morphology, they appeared as both corticothalamic and corticocortical pyramidal neurons (Thomson 2010). These cells included both pyramidal neurons and inverted pyramidal cells. Both cell bodies and presumed apical dendrites were GFP-positive, and the brightness of GFP expression is similar to that of layer II/III.
Fig. 5.
CaMKIIα -GFP in the somatosensory cortex. CaMKIIα -GFP (A2) and Nissl (A1i in primary somatosensory cortex (S1) in a 30µm coronal section (Bregma −2.22mm). B) Image of GABA-IR (B1) and GFP (B2) in S1 layer II/III region showing that there is virtually no overlap between GFP cells (asterisk *) and GABA-IR positive cells (arrowheads). Scale bar = 20µm.
Thalamus
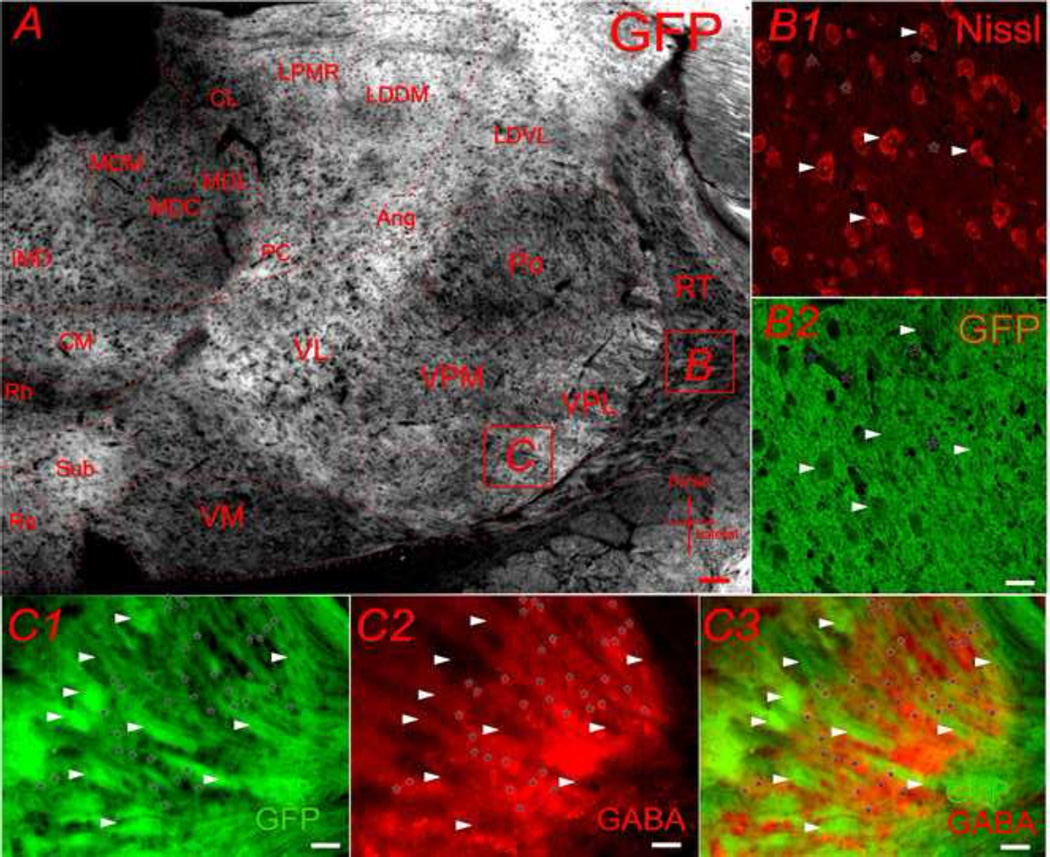
GFP fluorescence was predominantly found in the dense plexus of the neuropil containing presumed axonal and dendritic processes. As seen in a low magnification photomicrograph (Fig. 6A), GFP marked neuropil in many thalamic relay nucleuses, leaving cell bodies as dark hollows (Fig. 6A). With a closer observation under a confocal microscope, as shown in Fig. 6B, more intense GFP fluorescence was detected in neuropil (*) than neuronal cell bodies (arrowheads). Sub-regions which expressed stronger GFP fluorescence in the thalamus were the ventrolateral nucleus (VL), ventral posterolateral nucleus (VPL), nucleus of reunions (Ro), central medial nucleus (CM), infermediodorsal nucleus (IMD), laterodorsal nucleus (LDVL), lateral posterior thalamic nucleus, mediorostral part (LPMR), laterodorsal thalamic nucleus, dorsomedial part (LDDM) and angular nucleus (Ang); sub-regions that expressed the least GFP fluorescence in thalamus were the mediodorsal nucleus (MDC, MDL, MDM), dorsal part of rhomboid nucleus (Rh), ventral part of ventromedial nucleus (VM), posterior complex (Po), reticular nucleus (RT), and central lateral nucleus (CL). In addition, thalamocortical axons in the internal capsule area were labeled with modest level of GFP (marked with arrowheads in Fig. 6C). In the thalamic reticular nucleus (RT), GFP were mostly absent from GABAergic RT cells (marked with * in Fig. 6C).
Fig. 6.
CaMKIIα -GFP in the thalamus. A) GFP in thalamus in a 30µm coronal section (Bregma −2.22mm). B) Confocal microscopic image showing the double labeling for Nissl (B1) and GFP (B2). C) Microscopic image of GFP (C1) and GABA-IR (C2) in VPL region showing that there are virtually no overlap between GFP positive fiber (arrowheads) and GABA-IR positive cells (asterisk *). Scale bar = 50µm in A and 20µm in B and C.
Hypothalamus
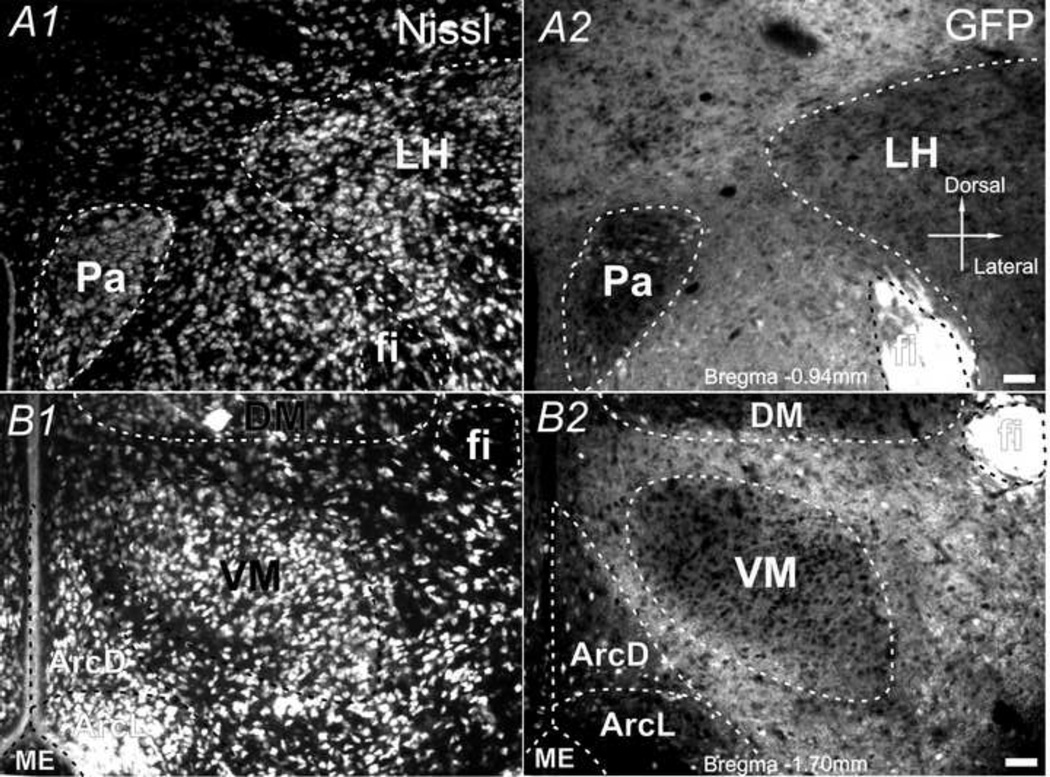
Within the hypothalamus, the distribution of GFP fluorescence was stronger in neuropil than somata in most regions (Fig. 7). Weaker than average GFP signals were shown in a few regions, such as the ventromedial nucleus (VM), lateral nucleus (LH), dorsal-medial nucleus (DM), and lateral part of arcuate nucleus (ArcL). In the fornix (fi), which consists of axons from the hippocampus to mammillary bodies and septal nuclei, the highest intensity of GFP fluorescence was observed (Fig. 7A2). Hypothalamus also had several sub-regions with bright but scattered GFP-positive neuronal cell bodies, such as the dorsal part of arcuate nucleus (ArcD) and paraventricular nucleus (Pa), and to a lesser extent in ArcL, DM, and LH.
Fig. 7.
CaMKIIα -GFP in the hypothalamus. Nissl (A1 & B1) and GFP (A2 & B2) in hypothalamus in two 30µm coronal sections (A: Bregma −0.94mm; B: Bregma −1.70mm) from a postnatal day 83 mouse brain. Scale bar = 50µm.
Inferior Collicullus (IC)
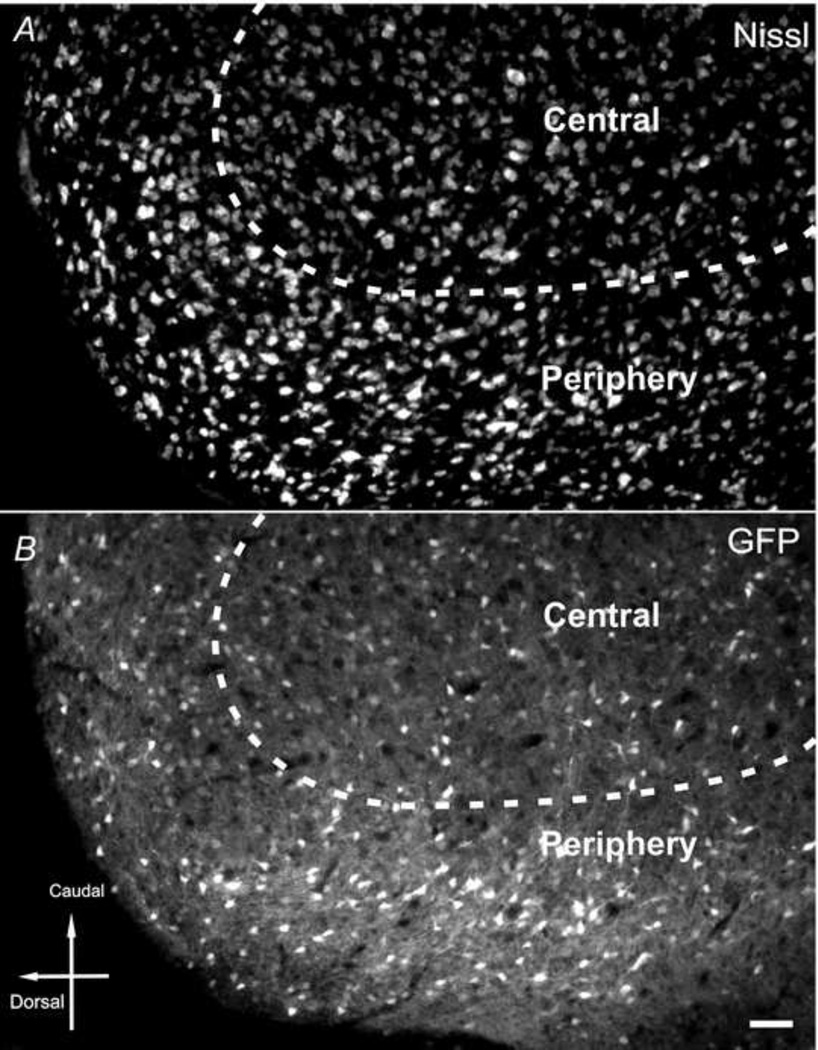
Throughout IC, modest GFP fluorescence in both neuropil and somata was observed, with higher densities in the somata. The brightness of neuropil as well as somata in the rostral or caudal portion of the periphery region was stronger than the central region (Fig. 8).
Fig. 8.
CaMKIIα -GFP in the inferior colliculus. Nissl (A) and GFP (B) in inferior colliculus in a 30µm sagittal section (lateral 1.10mm) from a postnatal day 83 mouse brain. Scale bar = 50µm.
Cerebellum
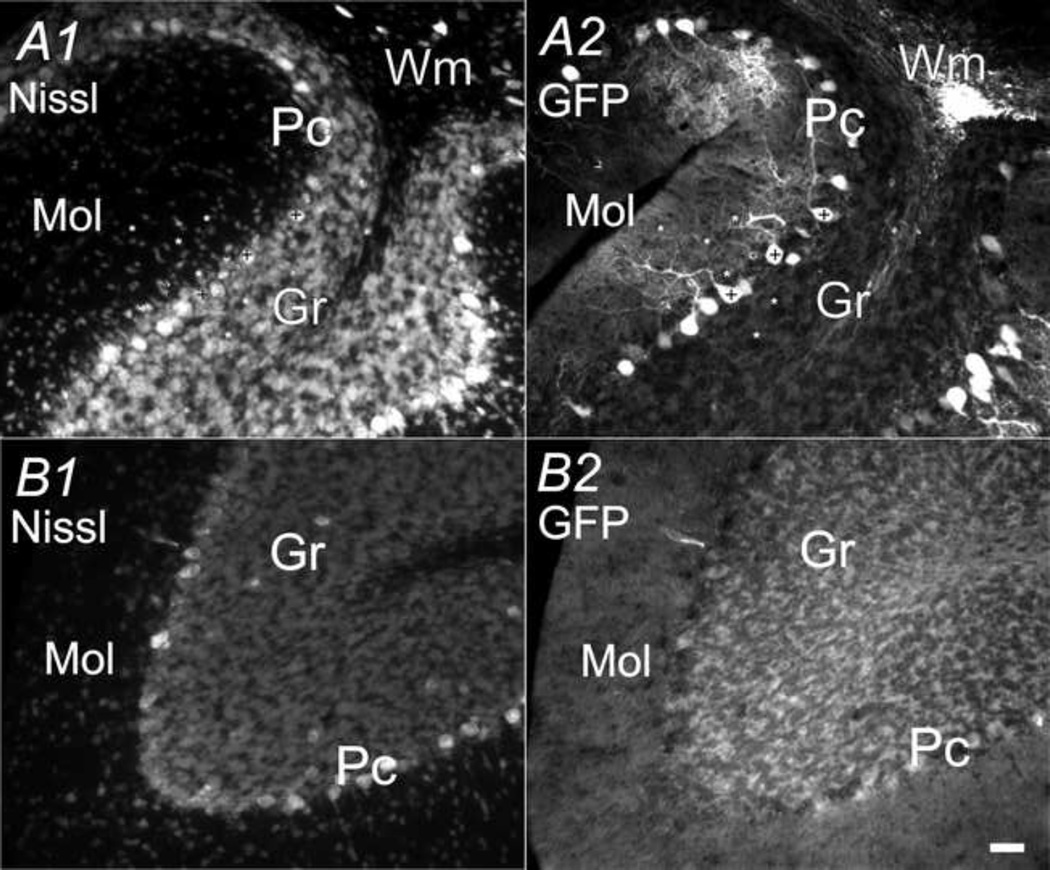
As shown in Fig. 2B, the cerebellum showed an uneven distribution of GFP between anterior, posterior lobes and throughout different layers within each lobe. In the posterior lobes, especially the 9th and 10th lobes, purkinje neurons in the Purkinje cell layer (Pc) were brightly marked with GFP fluorescence in both somata and processes (dendrites) (marked with + in Fig. 9A). There was also modest GFP fluorescence emitted from neuropil in the molecular layer (Mol), leaving presumed interneurons and granule neurons appearing as dark hollows in the neuropil (marked with * in Fig. 9A1). In the granule cell layer, GFP was expressed at low levels in cell bodies of presumed granule cells (Fig. 9A2). However, very weak GFP fluorescence was emitted from anterior lobes and no significant number of GFP-positive neurons was detected (Fig. 2& 9B).
Fig. 9.
CaMKIIα -GFP in the cerebellum. Nissl (A1 and B1) and GFP (A2 and B2) in cerebellum in two 30µm sagittal sections (lateral 1.10mm). A) 9th cerebellum lobe. B) 6th cerebellum lobe. Scale bar = 50 µm. + mark purkinje cells; asterisks mark granule cells, basket, and stellate cells.
Medulla
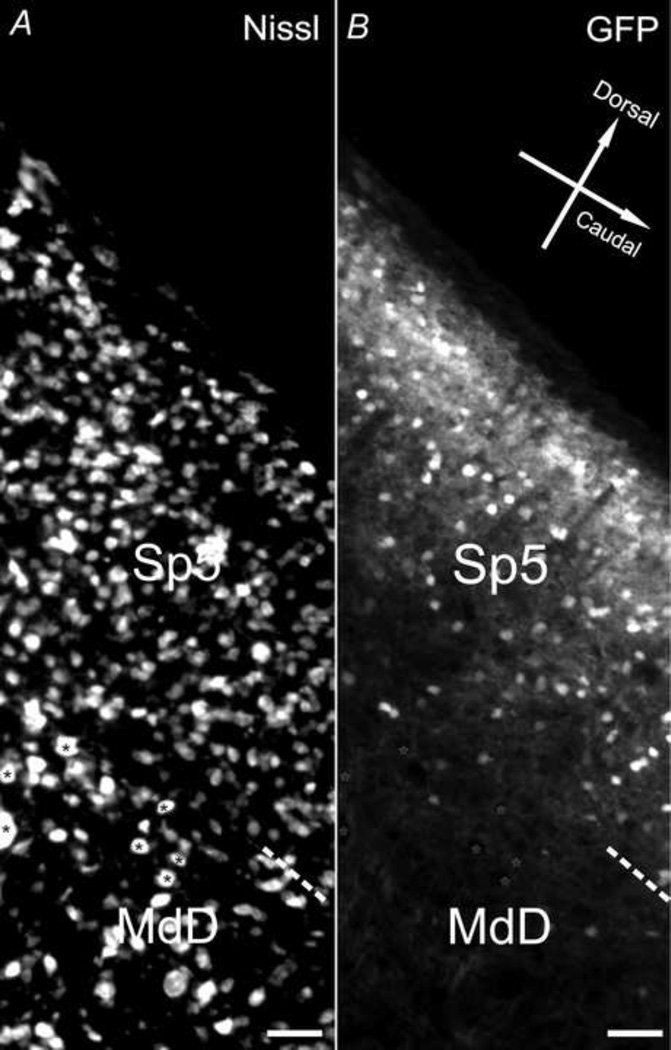
In the medulla, GFP fluorescence was most conspicuous in the spinal nucleus of trigeminal (SP5). There was only sparse signal in the medial vestibular nucleus (MVe), medullary reticular nucleus, dorsal part (MdD), rostal periolivary region (RPO), and lateral reticular nucleus (Lrt) compared to surrounding regions (Fig. 2). The facial nucleus and its root (7N and 7n) showed an absence of GFP. Under higher magnification, very low density of GFP positive somata, along with virtually negative GFP in neutrophil, was shown in the medullary reticular nucleus, dorsal part (MdD). In contrast, 45 ± 4% (n=3) GFP+ cells were found in the spinal trigeminal nucleus (Sp5, Fig. 10). Within this nucleus, GFP fluorescence in the neuropil was stronger than MdD region, where large neuronal cell bodies appeared as black hollows surrounded with weak GFP+ puncta (Fig. 10).
Fig. 10.
CaMKIIα -GFP in the medulla. Nissl (A) and GFP (B) in a 30µm medulla sagittal section (lateral 1.10mm) from a postnatal day 83 mouse brain. Asterisks mark cells that are GFP negative. Scale bar = 50µm.
Other regions
In the basal ganglia, as described in previous studies (Benson et al., 1992), caudate-putamen (CPu) and nucleus accumbens (Acb) were strongly labeled with GFP, but not globus pallidus and entopeduncular nucleus. In CPu, both cell bodies and processes were brightly labeled (e.g. Fig. 11D1). Striatum terminals were only lightly labeled (mostly in neuropil), in contrast to the stronger labeling in the neighboring lateral amygdaloid complex. Among amygdalar nucleuses, the central lateral nucleus (CEAI) was labeled both in cell bodies and the neuropil, while the lateral nucleus (AL) was labeled more in the cell bodies. Medial lateral amygdalar nucleus (AM) was only lightly labeled with GFP in the neuropil (e.g. Fig. 2 & 3).
Fig. 11.
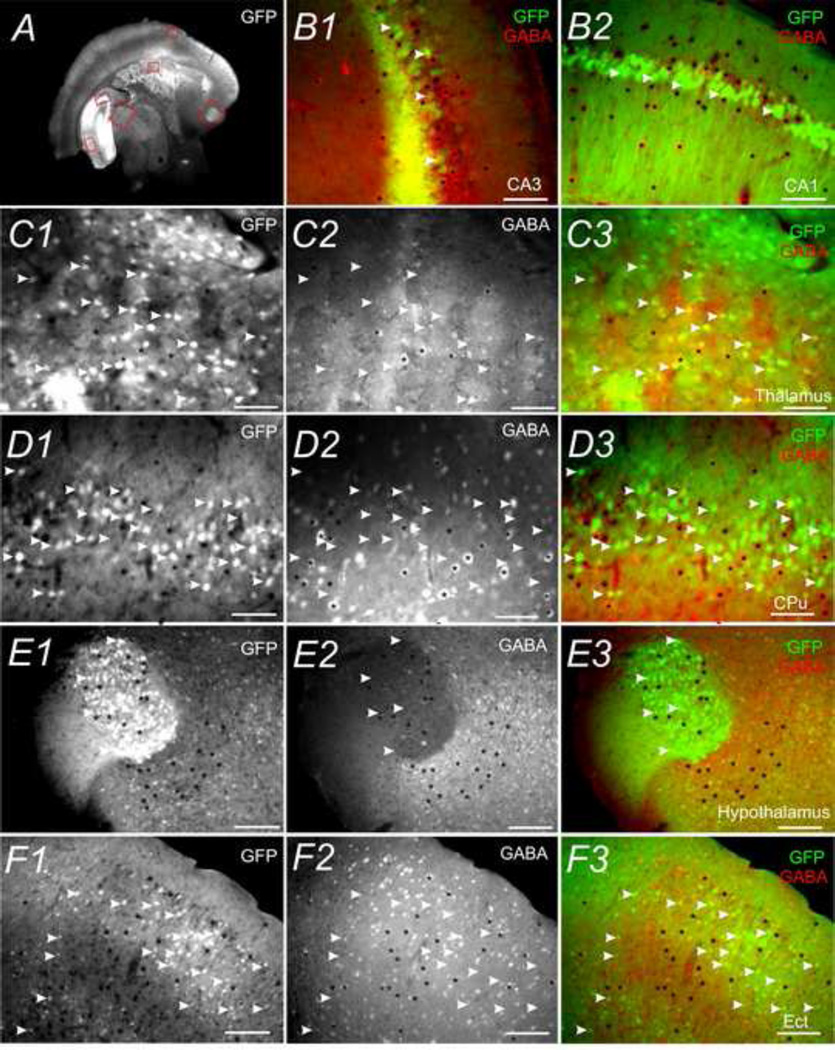
Colocalization of CaMKIIα -GFP and GABA-IR in different brain regions. A C1 D1, E1 and F1 show GFP. C2 D2 E2 and F2 show GABA-IR. B1 B2 C3 D3 E3 and F3 are merged images of GFP (Green) and GABA-IR (red). A) GFP expression in a 30µm coronal section (Bregma −2.22mm) of postnatal day 83 mouse brain. B to F are higher magnification images of highlighted regions in A: B1) hippocampal CA3 field; B2) hippocampal CA1 field; C) thalamus; D) CPu; E) hypothalamus; F) Ect. White arrowheads mark cells positive for GFP but not GABA-IR. Black asterisks indicate cells positive for GABA-IR but not GFP. Scale bar = 500µm in A and 50µm in B to F.
Colocalization of CaMKII α-GFP with GABA-IR
We examined the colocalization between GFP with GABA-IR in several brain regions. As shown in previous figures (Fig. 5 & 6), there was virtually no overlap between GFP+ with GABA-IR somata in the neocortex and thalamus. In the hippocampus CA1 & 3, this was also the case (Fig. 11B). In other three-layered cortices (such as Pir, Ect and PRh), no overlap between GFP+ and GABA-IR positive somata (e.g. Fig. 11F) was observed. The similar situation was also seen in several sub-cortical areas such as thalamus (Fig. 11C), CPu nucleus (Fig. 11D) and hypothalamus (Fig. 11E). However, there were very high percentages of overlap between GFP+ and GABA-IR somata in the olfactory bulb especially in granule cells (not shown) as previously described (Zou et al., 2002).
Colocalization of CaMKII α -GFP with CaMKII-IR
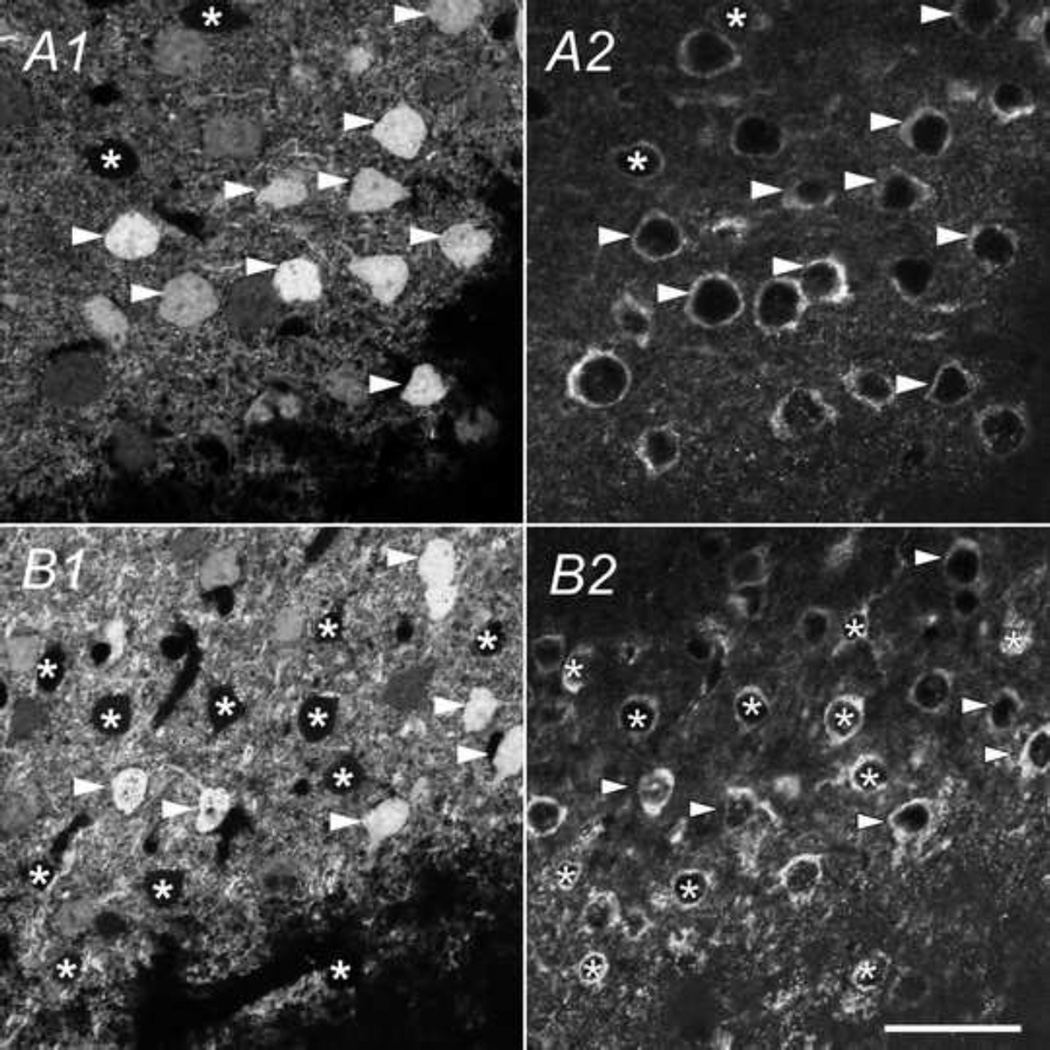
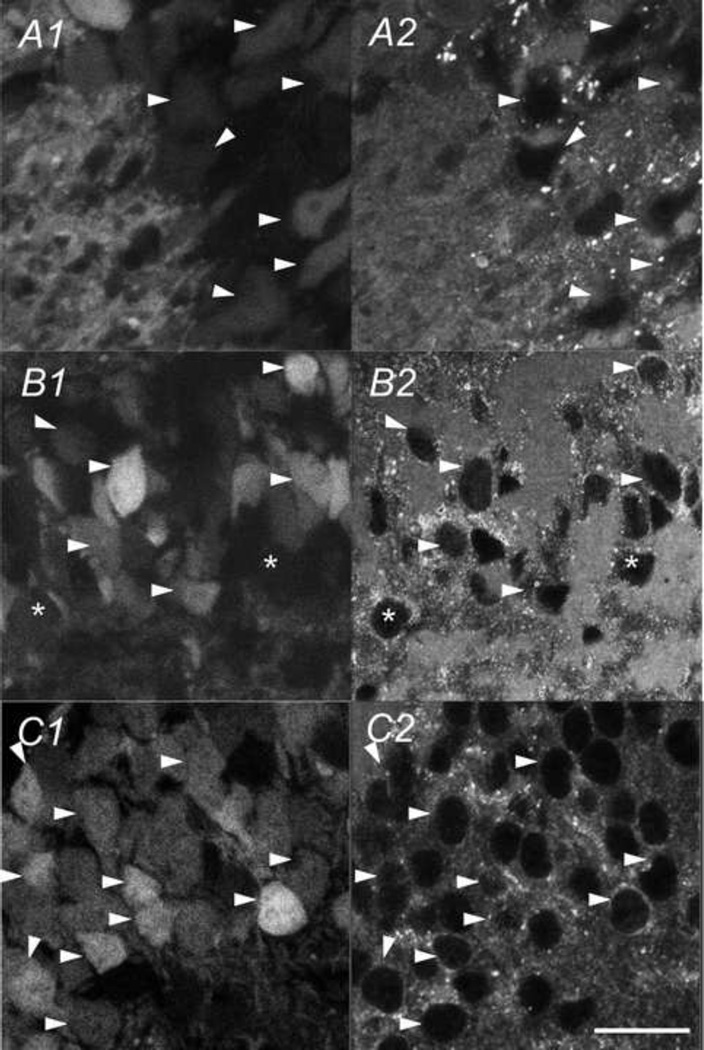
Next, we examined the overlapping between GFP with CaMKII-IR in two selected forebrain regions: the primary somatosensory cortex (S1) and the hippocampus. In different layers of the S1, nearly all GFP expressing cells were CaMKII-IR positive (table 1) but a significant number of CaMKII-IR positive cells were not marked with GFP (table 2). For example, in layer II/III, as shown in Fig. 12A and table 2, 60 ± 4% (n=3 sections) CaMKII-IR positive neurons also expressed GFP signal. In layer IV shown in Fig. 12B and table 2, only 33 ± 2% (n=3 sections) of the CaMKII-IR positive cells were GFP-positive. This indicates a partial expression of GFP in cells in CaMKII-expressing cell population in the somatosensory cortex, presumably due to an incomplete CaMKIIα promoter function used in the transgenetic mouse line. Fig. 13 shows the colocalization of the CaMKII antibody and GFP in three sub-regions of the hippocampus: CA3 (Fig. 13A), CA1 (Fig. 13B) and DG (Fig. 13C). Again, all GFP expressing cells were also CaMKII-IR positive. At the same time, a very high percentage of CaMKII-IR also expressed GFP throughout the hippocampus: 92.2 ± 2%, 97.3 ± 3%, 98.1 ± 1% for CA1, CA3, and DG, respectively (n=3 sections). Therefore, we conclude that the partial expression of GFP was region-specific. Furthermore, in the hippocampus, the GFP signal was more robust than in the CaMKII-IRs (marked with white arrowheads in Fig. 13). Colocalization rates in sub-regions of somatosensory cortex and hippocampus are shown in table 1 and 2.
Table 1.
Percentage of CamKIIα-GFP cells that are positive for CaMKII-IR in selected brain areas
| Region | Somatosensory cortex |
Region | Hippocampus |
|---|---|---|---|
| Layer I | 100% (n=5) | CA1 | 100% (n=3) |
| Layer II/III | 81.6% (n=5) | CA3 | 100% (n=3) |
| Layer IV | 100% (n=5) | DG | 100% (n=3) |
| Layer V | 100% (n=5) | ||
Table 2.
Percentage of CaMKII-IR positive cells that are positive for CamKIIα-GFP in selected areas of neocortex
| Region | Somatosensory cortex |
Region | Hippocampus |
|---|---|---|---|
| Layer I | 30.1 ± 2% (n=3) | CA1 | 92.20 ± 2% (n=3) |
| Layer II/III | l60 ± 4% (n=3) | CA3 | 97.30 ± 3% (n=3) |
| Layer IV | 33 ± 2% (n=3) | DG | 98.10 ± 1% (n=3) |
| Layer V | 26.6 ± 8% (n=3) | ||
Fig. 12.
Colocalization of CaMKIIα -GFP and CaMKIIα-IR in the somatosensory cortex. GFP (A1 & B1) and CaMKIIα-IR (A2 & B2) in a coronal section of the somatosensory cortex (Bregma −2.22mm) of a postnatal day 83 mouse brain. White arrowheads show cells positive for both the CaMKIIα-IR and GFP. Asterisks mark CaMKIIα-IR positive cells lacking GFP. Scale bar = 25µm.
Fig. 13.
Colocalization of CaMKIIα -GFP and CaMKIIα-IR in the hippocampus. Double labeling for GFP (A1 B1 & C1) and CaMKIIα-IR (A2 B2 & C2) in a coronal section of hippocampus (Bregma −2.22mm) from a postnatal day 83 mouse brain. White arrowheads show cells positive for both CaMKII-IR and GFP. Asterisks mark CaMKII-IR positive cells lacking GFP. A) CA3 field. B) CA1 field. C) Dentate gyrus. Scale bar = 20µm.
DISCUSSION
As here we report the first case of transgenic mice expressing GFP under the control of the promoter for CaMKIIα, our discussion will focus primarily on the relationship between CaMKIIα -GFP expression and CaMKIIα expression in various brain regions studied with immunohistochemical method. An intense expression and substantial heterogeneity in the distribution of CaMKIIα across the brain was observed by both immunohistochemistry and biochemical methods (Ouimet et al., 1984;Erondu and Kennedy, 1985;Benson et al., 1992). A similar expression pattern of GFP was found in the present study. CaMKII antibody used in the present study recognizes α, δ, and γ isoforms of CaMKII but not β isoform. Since the expression levels of δ and γ isoforms is negligible compared to αisoform, we believe CaMKII-IRs reflect mostly the distribution of CaMKIIα. High colocalization rates have been observed between CaMKIIα -GFP and CaMKII-IR.
Hippocampus
The highest levels of CaMKIIα have been found in the hippocampus and are known to comprise as much as 2% of the total protein in the brain (Erondu and Kennedy, 1985). In the present study, the hippocampus also showed the strongest GFP signal of the whole brain. In agreement with in situ hybridization studies on CaMKIIα mRNA, strong GFP signal was found in cell bodies within pyramidal and granule cell layers of hippocampal formation with a 92.2 ± 2%, 97.3 ± 3%, and 98.1 ± 1% colocalization rate between GFP and CaMKII-IR in field CA1, CA3 and DG, respectively. Therefore, CaMKIIα-GFP can be used as an indicator of CaMKIIα in this region. Further studies should be done on the developmental expression pattern of GFP in this region to find out whether it can be also used as an indicator in developmental studies.
Interestingly, although sharing a similar localization profile in the hippocampal formation with CaMKII-IR, CaMKIIα-GFP showed a more homogenous and stronger expression in both cell bodies and neuropil than CaMKII-IR. This could be due to extra copies of the CaMKIIα transgenes and its amplification during expression in the transgenic mice. Previous studies (Burgin et al., 1990) showed that CaMKIIα is denser in the middle and distal dendrites of pyramidal cells near associational and commissural fiber terminals, rather than proximal dendrites near mossy fiber terminals. However, in our study, the Slu of field CA3, where proximal parts of pyramidal dendrites locate, were found with very high density of dendritic GFP. Mossy fibers are consisted of axons replaying from DG and have been extensively studied because of their strong influence on the excitability of CA3 neurons. In contrast to associational and commissural synapses, mossy fiber LTP doesn’t require either postsynaptic calcium or NMDA (Zalutsky and Nicoll, 1990). However, studies have shown that the NMDA-independent mossy fiber LTP can be blocked by the CaMKII inhibitor, suggesting that CaMKII could play an important role in mossy fiber LTP (Kessey and Mogul, 1997). It has also been shown that intraterminal Ca2+ and CaMKII are necessary for frequent facilitation of mossy fiber synapses (Salin et al., 1996). A high GFP signal in the present study could be due to the high density of synaptic contacts, suggesting an important role of CaMKIIα in mossy fiber synapse plasticity. Another explanation would be that a signal previous neglected was observed in the CaMKIIα -GFP line due to the enhanced function of CaMKIIα-promoter and the brightness of GFP. Of course, a remote possibility that an altered promoter function leading to ectopic expression in this region cannot be entirely excluded.
Cortex
Distinct laminar distribution of CaMKII in the primary somatosensory cortex has been described in several previous studies (Ouimet, McGuinness, and Greengard, 1984, Erondu and Kennedy, 1985;Jones et al., 1994;Burgin et al., 1990). Present study showed that the GFP signal was more robust in layer II/III and VI than layer I, IV and V, which is consistent with Burgin et al’s findings. This is reflected by the expression rates in cell bodies: 32 ± 2% of neurons in layer II/III are GFP-positive, whereas only 7.1 ± 0.2% of layer IV are GFP-positive, and only 9.5 ± 0.5% in layer V. Noticeably, GFP expression in the neuropil is higher in layer II/III, and VI rather than layer IV. Converging apical dendrites of all pyramidal neurons from layer IV and V may contribute to the stronger GFP signal in layer II/III. A weak GFP signal in Layer I is mainly due to a lack of GFP-positive cell bodies, however, a moderate GFP can still be observed from neuropil. This pattern is consistent throughout the cerebral cortex: retrosplenial granular cortex, somatosensory cortex, auditory cortex, ect, PRh and Pir, suggesting a similar functional mapping throughout neocortex and paleocortex. In the neocortex, colocalization rates of GFP with CaMKII-IR were different across layers. 66% of CaMKII-IR neurons are negative for GFP in layer IV and they are mostly large pyramidal neurons as reported to be positive for CaMKIIα (Table 2) (Jones, Huntley, and Benson, 1994). This suggests a partial expression pattern of the CaMKIIα promoter used in this transgenic mouse in large pyramidal neurons of this layer. The molecular and regulatory mechanism responsible for this partial expression requires further investigation.
Cerebellum
as reported in rat brain (Conlee et al., 2000;Ichikawa et al., 1992), in cerebellum, CaMKIIα is found exclusively in Purkinje cells, including cell bodies, dendrites and axons. In the present study, our results agreed with previous studies in that Purkinje cells were found to express high level of GFP, particularly in posterior lobes (e.g. Fig. 9). The number of GFP+ Purkinje cells was roughly similar to the number of large Nissl positive cells in the same layer (see Fig. 9A), suggesting that CaMKIIα was robustly expressed in Purkinje cells.
In the molecular layer, modest GFP marked neuropil (e.g. from basket cells or stellate cells) instead of somata (marked with asterisks in Fig. 9A). However, in anterior lobes, very weak GFP signal was detected, presumably due to incomplete promoter function in this region. The molecular and regulatory mechanisms responsible for this partial expression require further investigation. The GFP expression patterns in the other two layers of the cerebellum were very different from previous studies. Modest densities of GFP+ ‘patches’ were found in granular layers, as well as medullary layers of the white matter (e.g. Fig. 9). In the granular layer, a large part of the GFP signal comes from the somata of presumed granule cells, however, further characterization of GFP+ cell types in this region requires colocalization studies with specific cell markers.
Thalamus and hypothalamus
CaMKIIα has been reported to be involved in activity-dependent dendritic plasticity in the thalamus (Willis, 2002; Wu and Cline, 1998). It is also known to be necessary for mammalian circadian rhythms generated by a hypothalamic suprachiasmatic nuclei (SCN) clock (Golombek et al., 2004) and leptin-induced plasticity in Arc nucleus (Morishita et al., 1998). In agreement with immunochemical studies (Erondu and Kennedy, 1985), modest GFP was seen in the thalamus and hypothalamus. Moreover, the GFP signal was stronger in the presumed dendritic processes of the thalamic relay nucleus. Bright GFP signal in cell bodies of the Arc nucleus indicates the role of CaMKIIα in neuroplasticity in these areas. Therefore, we believe that GFP could be used as a functional indicator of CaMKIIα in these regions. Further studies could be done on whether GFP can be used as an indicator of CaMKIIα protein expression quantitatively in relation to specific activation of these nucleuses under various physiological conditions (e.g. hyperosmotic challenge).
Other regions
CaMKIIα has been shown to mediate activity-dependent plasticity in basal ganglia (Kebabian, 1997), reinforcement learning in striatum (Wanjerkhede and Bapi, 2008;Wang et al., 2004), synaptic signaling (Diez-Guerra, 2010;Ota et al., 2010), memory, and stress function (Xiao et al., 2009;Bilecki et al., 2009;Musumeci et al., 2009) in amygdala. Our results showed that the expression of GFP varies greatly throughout different subdivisions of basal ganglia. With further studies of CaMKII-IR/GFP colocalization in this region, in a cell specific manner, these transgenic mice could provide more information on the function of CaMKIIα in these regions and how it is regulated in different plasticity paradigms.
To summarize, the present study described expression patterns of GFP driven by the CaMKIIα promoter in adult brain tissue. GFP signals were shown to be clearly visible and differentially expressed throughout the entire brain (e.g. Fig. 1). High levels of colocalization between GFP and CaMKII-IR throughout the mouse brain suggest that the distribution of GFP reflects the distribution of functional CaMKIIα to a great extent. Therefore, examination on GFP signal could provide us important insights regarding brain region specific localization of CaMKIIα. An important application of this information is the visualization of CaMKIIα-expressing cells in vivo and in vitro physiological studies. The bright GFP signal of these mice can also be taken advantage to study carefully how GFP expression is regulated in each brain region across different developmental stages and plasticity paradigms. However, further examination should be conducted to determine whether the distribution and intensity of GFP reflects that functional CaMKIIα.
Materials and Methods
CaMKIIα -GFP transgenic mice
We used CaMKIIα -GFP mice, in which GFP is selectively expressed under the control of the endogenous CaMKIIα gene promoter described by previous studies (Mayford et al., 1996). The DNA construct was provided by Dr. Mayford and the mice were generated by Gábor Szábo’s group. Briefly, the the 8.5-kbp CaMKIIα promoter region, as well as 84 nucleotides of the 5’ non-coding exon, was fused to the GFP. The entire 3’-UTR of the CaMKIIα mRNA was placed downstream of the GFP coding region. Transgenic mice were derived by standard pronuclear injection of CBA/C57Bl6F2 fertilized eggs. For this study, heterozygous transgenic mice of the C57Bl6 background were used. In this study, these transgenic mice were called CaMKIIα -GFP mice for simplicity. The CaMKIIα -GFP transgenic mouse line was used to study the distribution of CaMKIIα throughout the brain in vivo. Adult mice (postnatal day 74) were given a lethal injection of Nembutal and perfused intracardially with 0.9% sodium chloride, followed by 4% paraformaldehyde, and the brain was then removed. The tissues were cryoprotected in 30% sucrose and then cut into 30 µm-thick coronal and sagittal sections.
Fluorescent labeling and microscopy
For GABA immunostaining, sections were incubated in 0.6% H2O2 for 30 min, PBS washed, switched to 50% alcohol for 10 min, PBS washed, and then incubated in TBS with 0.5% Triton X-100, 2% BSA, 10% normal goat serum for 2 h at room temperature and incubated in primary antibodies directed against GABA (1:10,000; Sigma A2052; raised in rabbit using GABA-BSA as the immunogen) overnight. The next day, after PBS rinsing, sections were incubated in goat anti-rabbit IgG (1:1000; Invitrogen, Carlsbad, CA) for 3 h, rinsed, mounted, and coverslipped. For CaMKIIα immunostaining, MOM (mouse on mouse) kit (Vector laboratories, Burlingame, CA) was used. Sections were incubated in 0.6% H2O2 for 30 min, PBS washed, switched to 50% alcohol for 10 min, PBS washed, incubated in TBS with 0.5% Triton X-100, 2% BSA, 10% normal goat serum for 2 h, MOM Ig Blocking Reagent for 3 h, MOM dilution for 2 h at room temperature and then incubated in primary antibodies directed against CaMKII (1:500; Millipore, AB3111) overnight. The next day, after PBS rinsing, sections were incubated in working solution of MOM biotinylated anti-mouse LgG Reagent for 3 hours, Texas Red Avidin D(1:250, Vector laboratories, Burlingame, CA) in PBS for 2 h, rinsed, mounted, and cover slipped. The immunofluorescent specimens were examined using an epifluorescence microscope (Zeiss, Thornwood, NY) equipped with AxioCam digital color camera. Double-immunofluorescent images were analyzed using an AxioVision LE imaging suite (Zeiss). Cell counting was conducted with the automeasure function of the AxioVision LE imaging suite. Confocal imaging was conducted using FV10i confocal microscope (Olympus) and ECLIPSE E800 microscopes (Nikon). For Nissl staining, NeuroTrace™ Fluorescent Nissl Stains kit (Molecular Probes, invitrogen, Carlsbad, CA) was used. Fresh sections were washed in 0.1M PBS plus 0.1% Triton® X-100 before being applied with NeuroTrace staining (1:300) for 20 minutes. After washed with PBS with Triton® X-100, the sections were washed for 2 hours in PBS at room temperature, mounted with ProLong® Antifade Kit (P-7481) and coverslipped.
Brain-wide information on the CaMKIIα-GFP expression
CaMKIIα-GFP expression at cellular and subcellular level
Comparison with endogenous CaMKIIα
Transgenic mice that can be used in in vivo and in vitro studies
Acknowledgements
This project was supported by grants from the National Center for Research Resources (5P20RR016474-12) and the National Institute of General Medical Sciences (8P20 GM103432-12 and P30 GM103398-RR32128) from the National Institutes of Health; and the Academic Affairs Office of the University of Wyoming. Confocal microscopy was performed in the University of Wyoming’s Microscopy Core Facility, which is supported by the Wyoming Neuroscience COBRE Grant (P30 GM103398-RR32128).
Table of Abbreviations
- 7n
Facial nucleus root
- 7N
Facial nucleus
- Acb
Accumbens nucleus
- Aco
Anterior commissure
- AM
Amygdalar nucleus, medial
- AL
Amygdalar nucleus, lateral
- Ang
Angular thalamic nucleus
- AON
Anterior olfactory neucleus
- ArcD
Arcuate hypothalamic nucleus, Dorsal part
- ArcL
Arcuate hypothalamic nucleus, Lateral part
- Au
Auditory cortex
- CA1
Field CA1
- CA3
Field CA3
- Cb
cerebellum
- CEAI
Central amygdalar nucleus, lateral
- CL
Central lateral nucleus of the thalamus
- CM
Central medial nucleus of the thalamus
- CPu
Caudoputamen
- DG
Dentate gyrus
- DM
Dorsal medial nucleus of the hypothalamus
- Ect
Ectorhinal cortex
- Fr
Fasciculus retroflexus
- FrA
Frontal association cortex
- Ge5
Gelatinous layer of the caudal spinal trigeminal nucleus
- gr
granule layer of cerebellum
- GrDG
Granular layer of Dentate gyrus
- HPF
Hippocampal formation
- HY
Hypothalamus
- IC
Inferior collicullus
- IMD
Infermediodorsal nucleus of the thalamus
- LDDM
Laterodorsal thalamic nucleus, dorsomedial part
- LDVL
Laterodorsal thalamic nucleus, ventrolateral part
- LPMR
Lateral posterior thalamic nucleus, mediorostral part
- LH
Lateral hypothalamus area
- Lmol
stratum lacunosum molecular
- Lrt
Lateral reticular nucleus
- LSO
Lateral superior olive
- MB
Midbrain
- MO
Motor cortex
- MDC
Mediodorsal nucleus of the thalamus, Central part
- MdD
Medullary reticular nucleus, Dorsal part
- MDL
Mediodorsal nucleus of the thalamus, Dorsal part
- MDM
Mediodorsal nucleus of the thalamus, Medial part
- ME
Median eminence
- mmt
mammilothalmic tract
- Mo5
Motor trigeminal nucleus
- MOB
Main olfactory bulb
- MoDG
Dentate gyrus, molecular layer
- MRN
Midbrain reticular nucleus
- MY
Medulla
- MVe
Medial vestibular nucleus
- Opt
optic tract
- Or
stratum oriens
- P
Pons
- Pa
Paraventricular hypothalamic nucleus
- PARN
Parvicellular reticular nucleus
- PAG
Periaqueductal gray
- PC
Paracentral nucleus
- Pir
Piriform cortex
- Pc
Purkinje cell layer of cerebellum
- PLCo
Posterolateral cortical Amygdaloid nucleus
- Po
Posterior complex of the thalamus
- PoDG
Polymorph layer of the dentate gyrus
- PRh
Perirhinal cortex
- Rad
stratum radiatum
- Re
Nucleus of Reunions
- RPO
Rostal periolivary region
- RSG
Retrosplenial granular cortex
- RT
Reticular nucleus of the thalamus
- S1
Primary somatosensory cortex
- SC
Superior colliculus
- Slu
stratum lucidum
- SNR
Substantia nigra, reticular part of amygdaloid area
- Sp5
Spinal trigeminal nucleus
- SPVC
Spinal nucleus of the trigeminal, caudal part
- Str
striatum terminals
- Sub
Subparafascicular nucleus
- TH
Thalamus
- Tu
Olfactory tubercle
- VIS
Visual cortex
- VL
Ventrolateral nucleus of thalamus
- VO
Ventral orbital cortex
- VPM
Ventral posteromedial nucleus of thalamus
- VPL
Ventral posterolateral nucleus of thalamus
- Wm
White matter
Footnotes
Publisher's Disclaimer: This is a PDF file of an unedited manuscript that has been accepted for publication. As a service to our customers we are providing this early version of the manuscript. The manuscript will undergo copyediting, typesetting, and review of the resulting proof before it is published in its final citable form. Please note that during the production process errors may be discovered which could affect the content, and all legal disclaimers that apply to the journal pertain.
Reference List
- Bagley JA, Belluscio L. Dynamic imaging reveals that brain-derived neurotrophic factor can independently regulate motility and direction of neuroblasts within the rostral migratory stream. Neuroscience. 2010;169:1449–1461. doi: 10.1016/j.neuroscience.2010.05.075. [DOI] [PMC free article] [PubMed] [Google Scholar]
- Bayer KU, LeBel E, McDonald GL, O’Leary H, Schulman H, De Koninck P. Transition from reversible to persistent binding of CaMKII to postsynaptic sites and NR2B. J Neurosci. 2006;26:1164–1174. doi: 10.1523/JNEUROSCI.3116-05.2006. [DOI] [PMC free article] [PubMed] [Google Scholar]
- Bayer KU, Lohler J, Schulman H, Harbers K. Developmental expression of the CaM kinase II isoforms: ubiquitous gamma- and delta-CaM kinase II are the early isoforms and most abundant in the developing nervous system. Brain Res Mol Brain Res. 1999;70:147–154. doi: 10.1016/s0169-328x(99)00131-x. [DOI] [PubMed] [Google Scholar]
- Benson DL, Isackson PJ, Gall CM, Jones EG. Contrasting patterns in the localization of glutamic acid decarboxylase and Ca2+/calmodulin protein kinase gene expression in the rat central nervous system. Neuroscience. 1992;46:825–849. doi: 10.1016/0306-4522(92)90188-8. [DOI] [PubMed] [Google Scholar]
- Benson DL, Isackson PJ, Hendry SH, Jones EG. Differential gene expression for glutamic acid decarboxylase and type II calcium-calmodulin-dependent protein kinase in basal ganglia, thalamus, and hypothalamus of the monkey. J Neurosci. 1991;11:1540–1564. doi: 10.1523/JNEUROSCI.11-06-01540.1991. [DOI] [PMC free article] [PubMed] [Google Scholar]
- Bilecki W, Wawrzczak-Bargiela A, Przewlocki R. Regulation of kinesin light chain 1 level correlates with the development of morphine reward in the mouse brain. Eur J Neurosci. 2009;30:1101–1110. doi: 10.1111/j.1460-9568.2009.06886.x. [DOI] [PubMed] [Google Scholar]
- Buard I, Coultrap SJ, Freund RK, Lee YS, Dell’Acqua ML, Silva AJ, Bayer KU. CaMKII “autonomy” is required for initiating but not for maintaining neuronal long-term information storage. J Neurosci. 2010;30:8214–8220. doi: 10.1523/JNEUROSCI.1469-10.2010. [DOI] [PMC free article] [PubMed] [Google Scholar]
- Burgin KE, Waxham MN, Rickling S, Westgate SA, Mobley WC, Kelly PT. In situ hybridization histochemistry of Ca2+/calmodulin-dependent protein kinase in developing rat brain. J Neurosci. 1990;10:1788–1798. doi: 10.1523/JNEUROSCI.10-06-01788.1990. [DOI] [PMC free article] [PubMed] [Google Scholar]
- Chalfie M. GFP: Lighting up life. Proc Natl Acad Sci U S A. 2009;106:10073–10080. doi: 10.1073/pnas.0904061106. [DOI] [PMC free article] [PubMed] [Google Scholar]
- Chin D, Means AR. Calmodulin: a prototypical calcium sensor. Trends Cell Biol. 2000;10:322–328. doi: 10.1016/s0962-8924(00)01800-6. [DOI] [PubMed] [Google Scholar]
- Conlee JW, Shapiro SM, Churn SB. Expression of the alpha and beta subunits of Ca2+/calmodulin kinase II in the cerebellum of jaundiced Gunn rats during development: a quantitative light microscopic analysis. Acta Neuropathol. 2000;99:393–401. doi: 10.1007/s004010051141. [DOI] [PubMed] [Google Scholar]
- Coultrap SJ, Bayer KU. CaMKII regulation in information processing and storage. Trends Neurosci. 2012;35:607–618. doi: 10.1016/j.tins.2012.05.003. [DOI] [PMC free article] [PubMed] [Google Scholar]
- Coultrap SJ, Buard I, Kulbe JR, Dell’Acqua ML, Bayer KU. CaMKII autonomy is substrate-dependent and further stimulated by Ca2+/calmodulin. J Biol Chem. 2010;285:17930–17937. doi: 10.1074/jbc.M109.069351. [DOI] [PMC free article] [PubMed] [Google Scholar]
- Diez-Guerra FJ. Neurogranin, a link between calcium/calmodulin and protein kinase C signaling in synaptic plasticity. IUBMB Life. 2010;62:597–606. doi: 10.1002/iub.357. [DOI] [PubMed] [Google Scholar]
- Drubin DG, Nelson WJ. Origins of cell polarity. Cell. 1996;84:335–344. doi: 10.1016/s0092-8674(00)81278-7. [DOI] [PubMed] [Google Scholar]
- Elgersma Y, Sweatt JD, Giese KP. Mouse genetic approaches to investigating calcium/calmodulin-dependent protein kinase II function in plasticity and cognition. J Neurosci. 2004;24:8410–8415. doi: 10.1523/JNEUROSCI.3622-04.2004. [DOI] [PMC free article] [PubMed] [Google Scholar]
- Erondu NE, Kennedy MB. Regional distribution of type II Ca2+/calmodulin-dependent protein kinase in rat brain. J Neurosci. 1985;5:3270–3277. doi: 10.1523/JNEUROSCI.05-12-03270.1985. [DOI] [PMC free article] [PubMed] [Google Scholar]
- Golombek DA, Agostino PV, Plano SA, Ferreyra GA. Signaling in the mammalian circadian clock: the NO/cGMP pathway. Neurochem Int. 2004;45:929–936. doi: 10.1016/j.neuint.2004.03.023. [DOI] [PubMed] [Google Scholar]
- Goshima Y, Ohsako S, Yamauchi T. Overexpression of Ca2+/calmodulin-dependent protein kinase II in Neuro2a and NG108-15 neuroblastoma cell lines romotes neurite outgrowth and growth cone motility. J Neurosci. 1993;13:559–567. doi: 10.1523/JNEUROSCI.13-02-00559.1993. [DOI] [PMC free article] [PubMed] [Google Scholar]
- Hanamura K, Mizui T, Kakizaki T, Roppongi RT, Yamazaki H, Yanagawa Y, Shirao T. Low accumulation of drebrin at glutamatergic postsynaptic sites on GABAergic neurons. Neuroscience. 2010;169:1489–1500. doi: 10.1016/j.neuroscience.2010.06.043. [DOI] [PubMed] [Google Scholar]
- Houston CM, He Q, Smart TG. CaMKII phosphorylation of the GABA(A) receptor: receptor subtype- and synapse-specific modulation. J Physiol. 2009;587:2115–2125. doi: 10.1113/jphysiol.2009.171603. [DOI] [PMC free article] [PubMed] [Google Scholar]
- Hudmon A, Schulman H. Neuronal CA2+/calmodulin-dependent protein kinase II: the role of structure and autoregulation in cellular function. Annu Rev Biochem. 2002;71:473–510. doi: 10.1146/annurev.biochem.71.110601.135410. [DOI] [PubMed] [Google Scholar]
- Ichikawa T, Sekihara S, Ohsako S, Hirata Y, Yamauchi T. Ca2+/calmodulin-dependent protein kinase II in the rat cerebellum: an immunohistochemical study with monoclonal antibodies specific to either alpha or beta subunit. J Chem Neuroanat. 1992;5:383–390. doi: 10.1016/0891-0618(92)90054-t. [DOI] [PubMed] [Google Scholar]
- Itagaki C, Isobe T, Taoka M, Natsume T, Nomura N, Horigome T, Omata S, Ichinose H, Nagatsu T, Greene LA, Ichimura T. Stimulus-coupled interaction of tyrosine hydroxylase with 14-3-3 proteins. Biochemistry. 1999;38:15673–15680. doi: 10.1021/bi9914255. [DOI] [PubMed] [Google Scholar]
- Jiang GC, Yohrling GJ, Schmitt JD, Vrana KE. Identification of substrate orienting and phosphorylation sites within tryptophan hydroxylase using homology-based molecular modeling. J Mol Biol. 2000;302:1005–1017. doi: 10.1006/jmbi.2000.4097. [DOI] [PubMed] [Google Scholar]
- Jones EG, Huntley GW, Benson DL. Alpha calcium/calmodulin-dependent protein kinase II selectively expressed in a subpopulation of excitatory neurons in monkey sensory-motor cortex: comparison with GAD-67 expression. J Neurosci. 1994;14:611–629. doi: 10.1523/JNEUROSCI.14-02-00611.1994. [DOI] [PMC free article] [PubMed] [Google Scholar]
- Kebabian JW. A phosphorylation cascade in the basal ganglia of the mammalian brain: regulation by the D-1 dopamine receptor. A mathematical model of known biochemical reactions. J Neural Transm Suppl. 1997;49:145–153. doi: 10.1007/978-3-7091-6844-8_16. [DOI] [PubMed] [Google Scholar]
- Krestel HE, Mayford M, Seeburg PH, Sprengel R. A GFP-equipped bidirectional expression module well suited for monitoring tetracycline-regulated gene expression in mouse. Nucleic Acids Res. 2001;29:E39. doi: 10.1093/nar/29.7.e39. [DOI] [PMC free article] [PubMed] [Google Scholar]
- Lai Y, Nairn AC, Greengard P. Autophosphorylation reversibly regulates the Ca2+/calmodulin-dependence of Ca2+/calmodulin-dependent protein kinase II. Proc Natl Acad Sci U S A. 1986;83:4253–4257. doi: 10.1073/pnas.83.12.4253. [DOI] [PMC free article] [PubMed] [Google Scholar]
- Marsden KC, Shemesh A, Bayer KU, Carroll RC. Selective translocation of Ca2+/calmodulin protein kinase IIalpha (CaMKIIalpha) to inhibitory synapses. Proc Natl Acad Sci U S A. 2010;107:20559–20564. doi: 10.1073/pnas.1010346107. [DOI] [PMC free article] [PubMed] [Google Scholar]
- Mayford M, Baranes D, Podsypanina K, Kandel ER. The 3’-untranslated region of CaMKII alpha is a cis-acting signal for the localization and translation of mRNA in dendrites. Proc Natl Acad Sci U S A. 1996;93:13250–13255. doi: 10.1073/pnas.93.23.13250. [DOI] [PMC free article] [PubMed] [Google Scholar]
- McDonald AJ, Muller JF, Mascagni F. GABAergic innervation of alpha type II calcium/calmodulin-dependent protein kinase immunoreactive pyramidal neurons in the rat basolateral amygdala. J Comp Neurol. 2002;446:199–218. doi: 10.1002/cne.10204. [DOI] [PubMed] [Google Scholar]
- Merrill MA, Chen Y, Strack S, Hell JW. Activity-driven postsynaptic translocation of CaMKII. Trends Pharmacol Sci. 2005;26:645–653. doi: 10.1016/j.tips.2005.10.003. [DOI] [PubMed] [Google Scholar]
- Meyer T, Hanson PI, Stryer L, Schulman H. Calmodulin trapping by calcium-calmodulin-dependent protein kinase. Science. 1992;256:1199–1202. doi: 10.1126/science.256.5060.1199. [DOI] [PubMed] [Google Scholar]
- Miller SG, Kennedy MB. Distinct forebrain and cerebellar isozymes of type II Ca2+/calmodulin-dependent protein kinase associate differently with the postsynaptic density fraction. J Biol Chem. 1985;260:9039–9046. [PubMed] [Google Scholar]
- Miller SG, Kennedy MB. Regulation of brain type II Ca2+/calmodulin-dependent protein kinase by autophosphorylation: a Ca2+-triggered molecular switch. Cell. 1986;44:861–870. doi: 10.1016/0092-8674(86)90008-5. [DOI] [PubMed] [Google Scholar]
- Morishita T, Hidaka T, Sugahara K, Noguchi T. Leptin changes Ca2+/calmodulin-dependent response and up-regulates the gene expression of calcineurin in rat hypothalamus. Life Sci. 1998;63:L311–L315. doi: 10.1016/s0024-3205(98)00460-3. [DOI] [PubMed] [Google Scholar]
- Musumeci G, Sciarretta C, Rodriguez-Moreno A, Al BM, Negrete-Diaz V, Costanzi M, Berno V, Egorov AV, von Bohlen Und HO, Cestari V, Delgado-Garcia JM, Minichiello L. TrkB modulates fear learning and amygdalar synaptic plasticity by specific docking sites. J Neurosci. 2009;29:10131–10143. doi: 10.1523/JNEUROSCI.1707-09.2009. [DOI] [PMC free article] [PubMed] [Google Scholar]
- Nicoll RA, Malenka RC. Expression mechanisms underlying NMDA receptor-dependent long-term potentiation. Ann N Y Acad Sci. 1999;868:515–525. doi: 10.1111/j.1749-6632.1999.tb11320.x. [DOI] [PubMed] [Google Scholar]
- Nomura T, Kumatoriya K, Yoshimura Y, Yamauchi T. Overexpression of alpha and beta isoforms of Ca2+/calmodulin-dependent protein kinase II in neuroblastoma cells -- H-7 promotes neurite outgrowth. Brain Res. 1997;766:129–141. doi: 10.1016/s0006-8993(97)00535-0. [DOI] [PubMed] [Google Scholar]
- Ochiishi T, Terashima T, Yamauchi T. Specific distribution of Ca2+/calmodulin-dependent protein kinase II alpha and beta isoforms in some structures of the rat forebrain. Brain Res. 1994;659:179–193. doi: 10.1016/0006-8993(94)90877-x. [DOI] [PubMed] [Google Scholar]
- Ohyama A, Hosaka K, Komiya Y, Akagawa K, Yamauchi E, Taniguchi H, Sasagawa N, Kumakura K, Mochida S, Yamauchi T, Igarashi M. Regulation of exocytosis through Ca2+/ATP-dependent binding of autophosphorylated Ca2+/calmodulin-activated protein kinase II to syntaxin 1A. J Neurosci. 2002;22:3342–3351. doi: 10.1523/JNEUROSCI.22-09-03342.2002. [DOI] [PMC free article] [PubMed] [Google Scholar]
- Omkumar RV, Kiely MJ, Rosenstein AJ, Min KT, Kennedy MB. Identification of a phosphorylation site for calcium/calmodulindependent protein kinase II in the NR2B subunit of the N-methyl-D-aspartate receptor. J Biol Chem. 1996;271:31670–31678. doi: 10.1074/jbc.271.49.31670. [DOI] [PubMed] [Google Scholar]
- Ota KT, Monsey MS, Wu MS, Schafe GE. Synaptic plasticity and NO-cGMP-PKG signaling regulate pre- and postsynaptic alterations at rat lateral amygdala synapses following fear conditioning. PLoS One. 2010;5:e11236. doi: 10.1371/journal.pone.0011236. [DOI] [PMC free article] [PubMed] [Google Scholar]
- Ouimet CC, McGuinness TL, Greengard P. Immunocytochemical localization of calcium/calmodulin-dependent protein kinase II in rat brain. Proc Natl Acad Sci U S A. 1984;81:5604–5608. doi: 10.1073/pnas.81.17.5604. [DOI] [PMC free article] [PubMed] [Google Scholar]
- Rotenberg A, Mayford M, Hawkins RD, Kandel ER, Muller RU. Mice expressing activated CaMKII lack low frequency LTP and do not form stable place cells in the CA1 region of the hippocampus. Cell. 1996;87:1351–1361. doi: 10.1016/s0092-8674(00)81829-2. [DOI] [PubMed] [Google Scholar]
- Saitoh T, Schwartz JH. Phosphorylation-dependent subcellular translocation of a Ca2+/calmodulin-dependent protein kinase produces an autonomous enzyme in Aplysia neurons. J Cell Biol. 1985;100:835–842. doi: 10.1083/jcb.100.3.835. [DOI] [PMC free article] [PubMed] [Google Scholar]
- Schulman H, Greengard P. Ca2+-dependent protein phosphorylation system in membranes from various tissues, and its activation by “calcium-dependent regulator”. Proc Natl Acad Sci U S A. 1978a;75:5432–5436. doi: 10.1073/pnas.75.11.5432. [DOI] [PMC free article] [PubMed] [Google Scholar]
- Schulman H, Greengard P. Stimulation of brain membrane protein phosphorylation by calcium and an endogenous heat-stable protein. Nature. 1978b;271:478–479. doi: 10.1038/271478a0. [DOI] [PubMed] [Google Scholar]
- Shimomura O. Discovery of green fluorescent protein. Methods Biochem Anal. 2006;47:1–13. [PubMed] [Google Scholar]
- Silva AJ, Paylor R, Wehner JM, Tonegawa S. Impaired spatial learning in alpha-calcium-calmodulin kinase II mutant mice. Science. 1992;257:206–211. doi: 10.1126/science.1321493. [DOI] [PubMed] [Google Scholar]
- Singh TJ, Wang JZ, Novak M, Kontzekova E, Grundke-Iqbal I, Iqbal K. Calcium/calmodulin-dependent protein kinase II phosphorylates tau at Ser-262 but only partially inhibits its binding to microtubules. FEBS Lett. 1996;387:145–148. doi: 10.1016/0014-5793(96)00485-1. [DOI] [PubMed] [Google Scholar]
- Soderling TR, Derkach VA. Postsynaptic protein phosphorylation and LTP. Trends Neurosci. 2000;23:75–80. doi: 10.1016/s0166-2236(99)01490-3. [DOI] [PubMed] [Google Scholar]
- Sosulina L, Graebenitz S, Pape HC. GABAergic interneurons in the mouse lateral amygdala: a classification study. J Neurophysiol. 2010;104:617–626. doi: 10.1152/jn.00207.2010. [DOI] [PubMed] [Google Scholar]
- Tamamaki N, Yanagawa Y, Tomioka R, Miyazaki J, Obata K, Kaneko T. Green fluorescent protein expression and colocalization with calretinin, parvalbumin, and somatostatin in the GAD67-GFP knock-in mouse. J Comp Neurol. 2003;467:60–79. doi: 10.1002/cne.10905. [DOI] [PubMed] [Google Scholar]
- Thomson AM. Neocortical layer 6, a review. Front Neuroanat. 2010;4:13. doi: 10.3389/fnana.2010.00013. [DOI] [PMC free article] [PubMed] [Google Scholar]
- Tobimatsu T, Fujisawa H. Tissue-specific expression of four types of rat calmodulin-dependent protein kinase II mRNAs. J Biol Chem. 1989;264:17907–17912. [PubMed] [Google Scholar]
- Tsien RY. The 2009 Lindau Nobel Laureate Meeting: Roger Y. Tsien, Chemistry 2008. J Vis Exp. 2010 doi: 10.3791/1575. [DOI] [PMC free article] [PubMed] [Google Scholar]
- Wang JQ, Tang Q, Parelkar NK, Liu Z, Samdani S, Choe ES, Yang L, Mao L. Glutamate signaling to Ras-MAPK in striatal neurons: mechanisms for inducible gene expression and plasticity. Mol Neurobiol. 2004;29:1–14. doi: 10.1385/MN:29:1:01. [DOI] [PubMed] [Google Scholar]
- Wanjerkhede SM, Bapi RS. Modeling the sub-cellular signaling pathways involved in reinforcement learning at the striatum. Prog Brain Res. 2008;168:193–206. doi: 10.1016/S0079-6123(07)68016-9. [DOI] [PubMed] [Google Scholar]
- Willis WD. Long-term potentiation in spinothalamic neurons. Brain Res Brain Res Rev. 2002;40:202–214. doi: 10.1016/s0165-0173(02)00202-3. [DOI] [PubMed] [Google Scholar]
- Wu GY, Cline HT. Stabilization of dendritic arbor structure in vivo by CaMKII. Science. 1998;279:222–226. doi: 10.1126/science.279.5348.222. [DOI] [PubMed] [Google Scholar]
- Xiao B, Han F, Shi YX. Dysfunction of Ca2+/CaM kinase IIalpha cascades in the amygdala in post-traumatic stress disorder. Int J Mol Med. 2009;24:795–799. doi: 10.3892/ijmm_00000294. [DOI] [PubMed] [Google Scholar]
- Yamauchi T, Fujisawa H. Disassembly of microtubules by the action of calmodulin-dependent protein kinase (Kinase II) which occurs only in the brain tissues. Biochem Biophys Res Commun. 1983;110:287–291. doi: 10.1016/0006-291x(83)91293-7. [DOI] [PubMed] [Google Scholar]
- Yamauchi T, Fujisawa H. Calmodulin-dependent protein kinase (kinase II) which is involved in the activation of tryptophan 5-monooxygenase catalyzes phosphorylation of tubulin. Arch Biochem Biophys. 1984;234:89–96. doi: 10.1016/0003-9861(84)90327-8. [DOI] [PubMed] [Google Scholar]
- Zhang C, Szabo G, Erdelyi F, Rose JD, Sun QQ. Novel interneuronal network in the mouse posterior piriform cortex. J Comp Neurol. 2006;499:1000–1015. doi: 10.1002/cne.21166. [DOI] [PubMed] [Google Scholar]
- Zou DJ, Greer CA, Firestein S. Expression pattern of alpha CaMKII in the mouse main olfactory bulb. J Comp Neurol. 2002;443:226–236. doi: 10.1002/cne.10125. [DOI] [PubMed] [Google Scholar]


