Abstract
Objective:
This study analyzes the spatial distribution of scrub typhus in Korea.
Methods:
A spatial distribution of Orientia tsutsugamushi occurrence using a geographic information system (GIS) is presented, and analyzed by means of spatial clustering and correlations.
Results:
The provinces of Gangwon-do and Gyeongsangbuk-do show a low incidence throughout the year. Some districts have almost identical environmental conditions of scrub typhus incidence. The land use change of districts does not directly affect the incidence rate.
Conclusion:
GIS analysis shows the spatial characteristics of scrub typhus. This research can be used to construct a spatial-temporal model to understand the epidemic tsutsugamushi.
Keywords: GIS, Korea, land category, scrub typhus, spatial analysis
1. Introduction
Tsutsugamushi disease, or scrub typhus, is a vector transmitted infectious and febrile illness caused by Orientia tsutsugamushi bacteria. It is transmitted to humans through larvae bites of different species of trombiculid mites. The habitat of mites is located in low trees and bushes. However, this vector can live in many different areas, even in sandy and mountainous deserts [1]. Scrub typhus was known in Japanese folklore to be associated with the jungle mite or chigger, which was named “dangerous bug” (tsutsugamushi) [2].
Scrub typhus is a militarily important disease which caused thousands of cases in the Far East during the Second World War. In Korea, eight cases were reported among the US troops during the Korean War. Soldiers were exposed to chigger bites in forest areas during the military operation [3].
In Korea, there were no cases for more than 30 years following the Korean War. In 1985, the infection appeared again [4]. Since then, scrub typhus incidences have been reported every year. Now it is considered as one of the most prevalent diseases affecting people in Korea, especially in the southwestern provinces of the country [5]. From 2004, the disease has spread widely in the southwestern provinces of the country and is becoming endemic.
Usually, the larvae of mites feed on wild rats and humans become infected accidentally in a zone of infected mites. The chance of an outbreak of this disease depends on the number of contacts between humans and the infected mites. Hence, the habitats of mites and human activities are the key factors in the prevalence of tsutsugamushi disease. Human activities include war, farming, camping, urbanization and so on.
Chigger population densities were great in areas with a high relative humidity, low temperature, low incidence of sunlight and a dense substrate vegetative canopy [6]. The relationship between human incidence of scrub typhus and climate should largely reflect the responses of chiggers to the environment [7].
The occurrence of scrub typhus is also related to land uses such as urbanization, developing cornfields, bio-fuel production and oil palms. The pattern of land use is changing widely [8]. The replacement of natural forests with plantations at the forest fringe facilitated the establishment of the disease, providing the best habitats for the mite [9]. Malaysia has seen an increasing incidence of scrub typhus, which is directly related to large-scale cultivation of oil palm and rubber [10]. Urbanization means that the habitats of mites and the life style of humans are changing. The contact rate of humans with wild life is increasing. Information is needed on the habitats of mites and human activities. The incidence of scrub typhus could also be influenced by climate change in Korea [11].
Geographical information is important for tracing and predicting the occurrence of scrub typhus in a spatial respect. Use of the geographic information system (GIS) method to help with the analysis of the occurrence trend is valuable. It is widely used in the management of vector-borne diseases and human health [12–14]. The GIS method can be useful in evaluating the habitats of wildlife [15,16]. Recently, it has been applied to the spatial analysis of scrub typhus [17]. We analyzed the spatial pattern of the occurrence of scrub typhus in Korea using the data from the Korea Centers for Disease Control and Prevention (KCDC). The correlation with occurrence of scrub typhus and land use change is studied.
2. Materials and Methods
2.1. Data of GIS and scrub typhus incidence
We explored the spatial distribution of scrub typhus incidence in Korea. The tsutsugamushi database from the communicable diseases statistics of the KCDC are available, which include address, incidence date, diagnosis date, age, job, gender, etc., of all patients in all districts from 2001 to 2011. Although some of the infections occurred away from a patient’s residence, we assume that most patients were infected in or near their residence, considering their occupations, such as farmers or fishermen.
To assess the relationship between infection and geospatial factors, the GIS database of administrative boundaries and highways was used. The administrative boundaries were merged into a total of 232 Si (cities), Gun and Gu (counties) for the unit district. Gu was used for Seoul, Incheon, Daegu, Busan, Ulsan, Gwangju, and Daejeon. We also obtained the statistics of the land categories by Si and Gun in a cadastral map in Chungcheongnam-do, from 2001 to 2010.
The processing programs of fitting, clustering, etc, used in this study, were coded with MATLAB (Mathworks Inc.) [18]. The tsutsugamushi occurrences and GIS maps are displayed using ArcGIS software (ESRI Inc.) [19].
2.2. Space-time clusters of disease incidence
We assessed the time-series trends of tsutsugamushi occurrence by district, using histograms and first-order polynomial fitting. Each district can be categorized as having a minus (decreasing), plus (increasing), or irregular slope from 2001 to 2011. The slope is estimated by first-order polynomial fitting of tsutsugamushi occurrence. Also, first-order polynomial fitting is used for land category change.
We performed clustering of administrative districts using hierarchical clustering and region-growing segmentation [20]. First, only three data sets (mean tsutsugamushi incidence of 2001–2002, 2004–2006 and 2010–2011) were clustered for the distribution pattern by district. Second, all 11 data sets of all districts from 2001 to 2011 were clustered hierarchically into 10 groups, on the basis of the similarity of disease incidence. Third, the spatial clustering of 11 data sets was performed using the region-growing method. In this process, an adjacent district (polygon) list and Pearson’s linear correlation are applied. All adjacent districts were found for each district using ArcGIS. Two districts with maximum correlation coefficients are firstly grouped in a region-growing procedure. A district, or two districts with the next maximum correlation coefficient, are subsequently grouped until a predefined threshold for correlation coefficient, for example 0.8, is met.
2.3. Relationship between scrub typhus incidence and land category change
Tsutsugamushi incidence is related with urbanization, and land use change. We selected the land category of the cadastral map, which is the quantitatively available source of land use history. Land categories in the Korean cadastral map are classified with 28 land uses. We selected two groups as follows: vegetation, which includes dry paddy-fields, paddy-fields, and forestry, and urban, which includes building sites, factory sites, school sites, parking lots, gas station sites, warehouse sites, roads, fish-farms, water supply sites, parks, and sites of religion. The sum of the area of each group is used as a variable for relationship analysis with tsutsugamushi incidence and land use. We applied correlations to assess the relationships.
3. Results
3.1. Disease incidence
A total of 51,825 tsutsugamushi infections were reported from 2001 to 2011 in Korea. The mean incidence rate was 9.95 cases per year per 100,000 residents. The incidence also varied by month. It occurred most frequently from the middle of October to the middle of November.
Figure 1 shows the number of incidences of tsutsugamushi in cities and counties of Korea from 2001 to 2011. Generally, it is possible to classify into Gang-wondo plus Gyeongsangbukdo regions and other regions.
Figure 1.
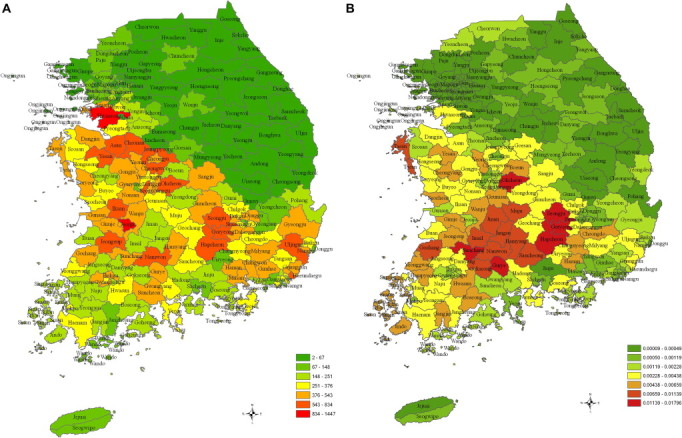
(A) Incidence map by districts; (B) incidence rate map by districts per capita.
There are many patterns, such as increasing, decreasing, and fluctuation according to districts (Figure 2). However, it is hard to find specific patterns. One typical phenomenon is the sudden decrease in 2003 in many cities (Si) and counties (Gun, Gu).
Figure 2.
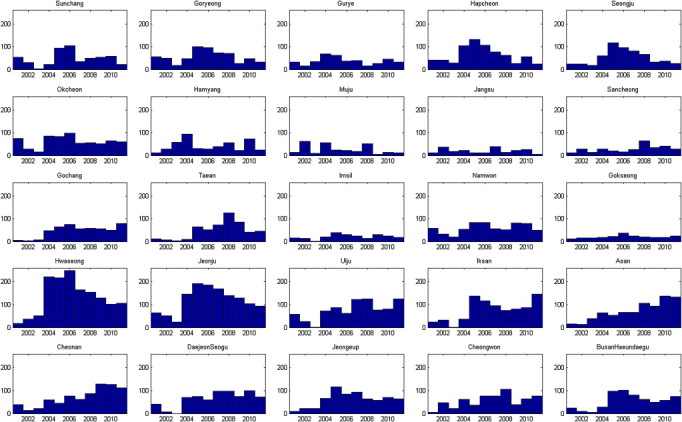
Histogram of incidence numbers in 25 districts.
In Figure 3, we can see the variation pattern of incidence of tsutsugamushi. Incidences were not distributed evenly across Korea. The red region shows the high increasing incidence rate, while the green region, Gangwon-do and Gyeongsangbuk-do, shows a decreasing pattern.
Figure 3.
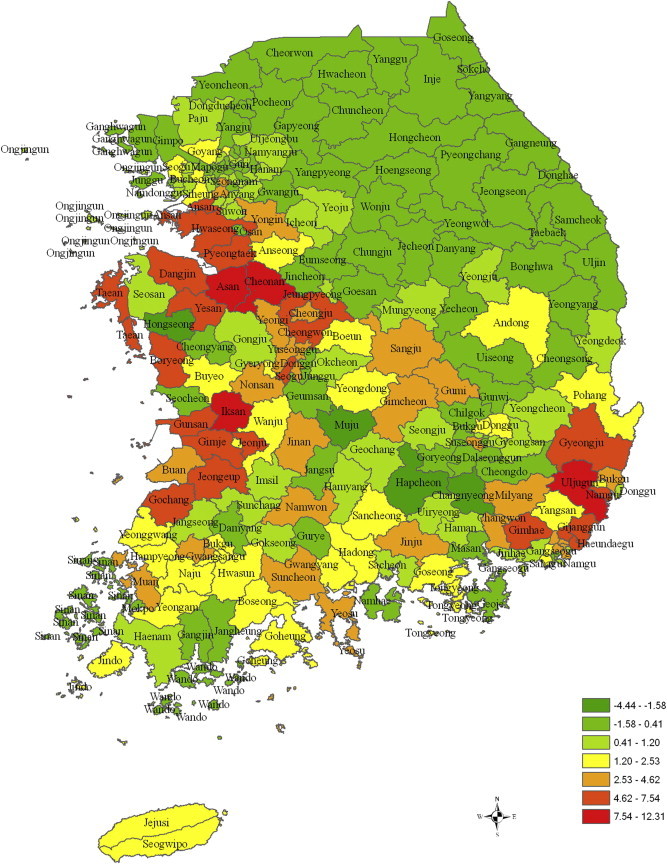
The slope of first order polynomial fitting to the yearly varying incidence number.
3.2. Spatial clusters of disease incidence
Figure 4 shows the serial incidence analysis method, by making three axes which consist of the incidence number grouped with three bands. The x, y, and z axes are for the mean incidence number of 2001–2002, 2005–2007, and 2010–2011, respectively. We can analyze how the incidence of tsutsugamushi varies through 11 years, by grouping the incidence numbers. If a group locates in the high number of (x, y, z), A, then the incidence number remains high. If a group locates near (0, 0, 0), B, then the incidence of tsutsugamushi has been low. If a group locates near (x, y, 0), near the x, y plane, then the outbreaks of tsutsugamushi were hard to find after 2010. The dark blue clustering near the origin in Figure 4A, represents developed cities. Figure 4A shows the incidence number per capita for 11 years. The yellow clustering near the origin in Figure 4B, also represents developed cities. The districts near C, show high x and y values and a low z value. It is a recently decreasing case. The side index color is only for the visualization of clustering, and not related to the incidence number.
Figure 4.
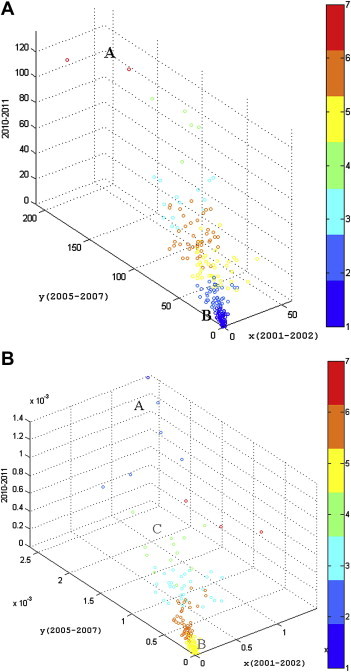
The seven clusters with three axes of incidence number. It is helpful to analyze the time series characteristic. (A) x, y, z axes is for the incidence number of 2001–2002, 2005–2007, and 2010–2011, respectively and (B) per capita of (A).
We conducted a classification of all districts using time series data of tsutsugamushi incidence. Figure 5 represents the result of clustering based on Euclidian Cost or correlation coefficients. EUC (Euclidian distance cost) means the correlation coefficient. In this figure, information of neighboring counties is not considered; only the incidence number of tsutsugamushi was used. The incidence data was classified into 10 classes. The same analysis was done as in Figure 5A for per capita data in Figure 5B. Gangwon-do and Gyeongsangbuk-do clearly shows the identical group.
Figure 5.
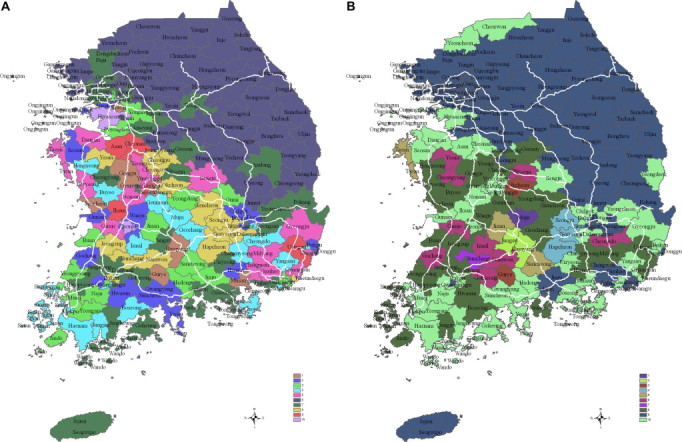
(A) 10 classes are grouped according to the number of incidences; (B) 10 classes are grouped according to the number of incidences per capita.
The region growing method, using adjacency relations, is helpful for understanding the spatial pattern variation. We can induce the similarity of outbreaks among the adjacent countries and cities. In Figure 6A, several groups show correlation coefficients >0.9. Those places have a high serial similarity of tsutsugamushi incidence. We can infer that those places have almost identical environmental conditions. Figure 6B shows the regions with correlation coefficients >0.8. We can analyze the spreading possibility in Figure 6.
Figure 6.
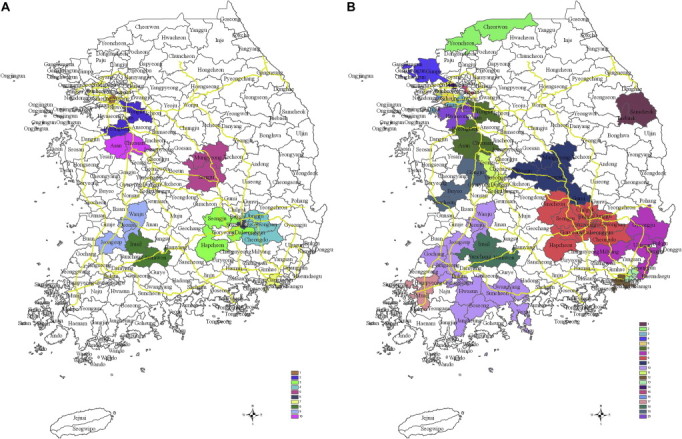
Grouping based on region growing analysis. (A) Correlation coefficients > 0.9; (B) correlation coefficients > 0.8. Light yellow green represents the unidentified region.
3.3. Relationship between land use and incidence rates
We analyzed the relation between land use variation and the incidence of tsutsugamushi in Chungcheongnam-do (Figures 7 and 8). The slopes of fitting of incidence number in cities and counties of Chungcheongnam-do are grouped and analyzed by land use change patterns (Figures 9 and 10).
Figure 7.
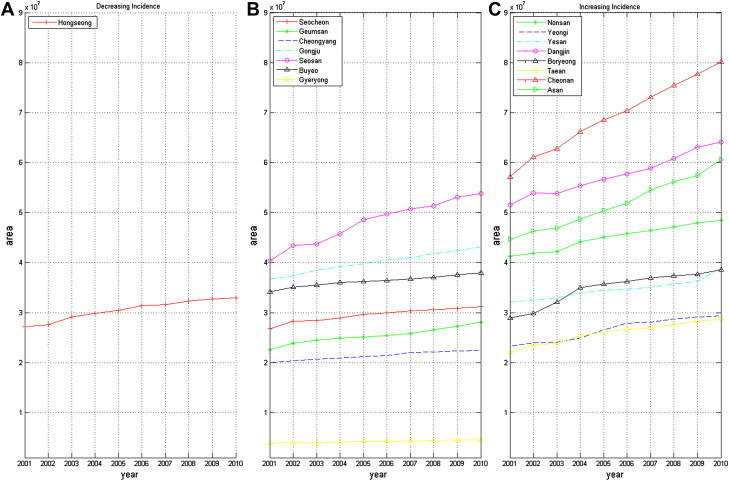
The area of urban land categories increased through 2001∼2010. Generally, the urban land categories are increasing. (A) Urban land category in Hongseong-gun is increasing slowly. The incidence number is decreasing in Figure 1: (B) seven districts where the tendency of incidence number is not clear. Urban land categories are increasing slowly, too; (C) eight places where the tendency of incidence number is increasing. The increasing rate of urban land categories is relatively high.
Figure 8.
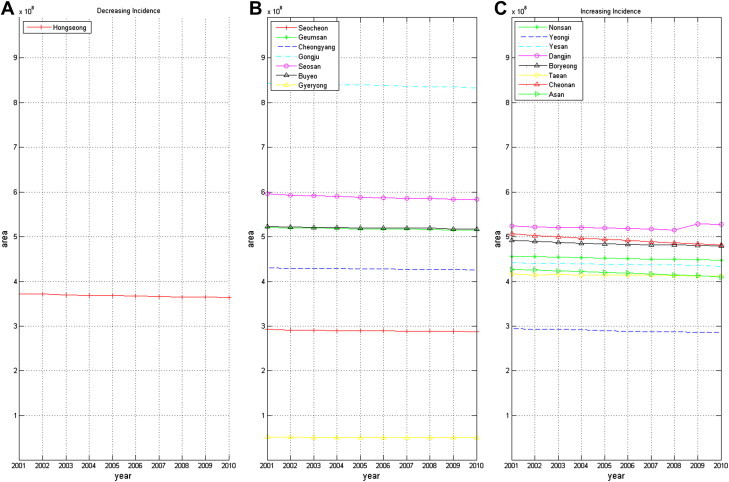
The areas of vegetation land categories decreased through 2001∼2010. Dangjin-gun shows a recent increasing tendency. Generally, the vegetation land categories are decreasing. (A) The vegetation land category in Hongseong-gun is decreasing slowly. The incidence number is decreasing in Figure 1; (B) seven districts where the tendency of incidence number is not clear. Vegetation land categories are decreasing slowly, too; (C) eight places where the tendency of incidence number is decreasing. The increasing rate of urban land categories is relatively high.
Figure 9.
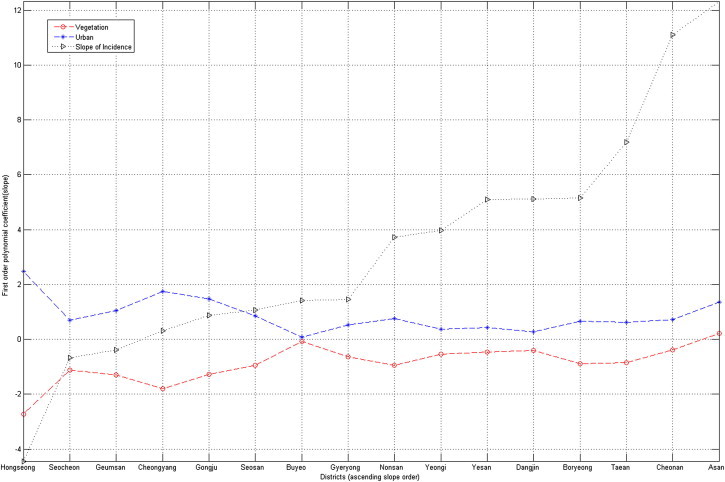
The slope of the first order polynomial fitting to urban land category, vegetation land category and the yearly varying incidence number.
Figure 10.
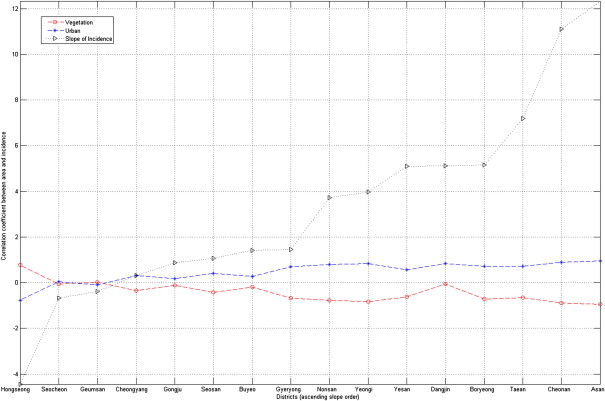
Correlation coefficients between urban land category and incidence number (blue line) and between vegetation land category and incidence number (red line). The slope of first order polynomial fitting to the yearly varying incidence number (black line).
The x axis consists of the sorting order following the magnitude of variation rate of the tsutsugamushi incidence rate in cities and counties, in Figure 9. The increasing rates of tsutsugamushi incidence are compared with the variation rates of the urban land category area (blue line) and with the vegetation land category (red line). In all provinces, the land categories are increasing, but may not be related to the increasing rates of tsutsugamushi incidence. The variation rates of vegetation land category appear to be related to the increasing rates of tsutsugamushi incidence.
For more precise analysis, the correlation coefficients are calculated (Figure 10). Vegetation land categories and the slopes show meaningful correlation coefficients. When the absolute value of the slope is >2.0, the correlation coefficient is >0.7, except for Dangjin and Yesan. Although in some papers land categories are clearly correlated to the incidence rate of tsutsugamushi [21], the tendency is not always clear in our analysis.
4. Discussion
We analyzed the characteristics of tsutsugamushi incidence rate from 2001 to 2011 in Korea. The data is from the KCDC. There are various patterns of tsutsugamushi incidence rate. In some places, it shows an increasing pattern and in some places it shows decreases or fluctuation. The provinces of Gangwon-do and Gyeongsangbuk-do clearly show a low incidence number throughout the year. This may be related to the Gyeongbu Expressway (Seoul-Busan). More research is needed to link the expressway and the tsutsugamushi incidence.
Region-growing clustering analysis was done in almost all cities and counties. In some places, the correlation coefficient is >0.9. If the group with a high correlation coefficient has a low incidence rate, then there is a low possibility of spreading and if it has a high incidence rate, then there is a high possibility of spreading. Consequently, we can analyze the spreading possibility from high serial similarity of tsutsugamushi incidence or region-growing clustering analysis. Except for a couple of places with high incidence rates, the land use change does not directly affect the incidence rate. We analyzed the relation between the incidence rate and land use of two categories, such as urban and vegetation land use.
For future studies, we need more categories to analyze, including many other cities and counties, to understand the relationship between incidence rate and land use. Habit split or disconnection by the high way and local way should be taken into account in the prediction of tsutsugamushi outbreaks and spreading.
Acknowledgments
This study was financially supported by Chonnam National University, 2011.
References
- 1.World Health Organization Frequently asked questions: scrub typhus. Available from: http://www.searo.who.int/LinkFiles/CDS_faq_Scrub_Typhus.pdf; 2009.
- 2.Mahajan SK. Scrub typhus. J Assoc Physicians India. 2005 Nov;53:954–8. PubMed. [PubMed] [Google Scholar]
- 3.Beran GW. Handbook of zoonoses. 2nd ed. Boca Raton, Fla: CRC Press; 1994. Oct, pp. 663–8. v. [Google Scholar]
- 4.Bang HA, Lee MJ, Lee WC. Comparative research on epidemiological aspects of tsutsugamushi disease (scrub typhus) between Korea and Japan. Jap J Infect Dis. 2008 Mar;61(2):148–50. PubMed. [PubMed] [Google Scholar]
- 5.Korea Centers for Disease Control and Prevention Current trends of scrub typhus. Communicable Disease Monthly report. 2004;15:245–52. [Google Scholar]
- 6.Clopton RE, Gold RE. Distribution and seasonal and diurnal activity patterns of Eutrombicula alfreddugesi (Acari: Trombiculidae) in a forest edge ecosystem. J Med Entomol. 1993 Jan;30(1):47–53. doi: 10.1093/jmedent/30.1.47. PubMed. [DOI] [PubMed] [Google Scholar]
- 7.Kawamura A, Tanaka H, Takamura A. Tsutsugamushi disease: an overview. Tokyo: University of Tokyo Press; 1995. [Google Scholar]
- 8.Rockstrom J, Steffen W, Noone K, et al. A safe operating space for humanity. Nature. 2009 Sep;461(7263):472–5. doi: 10.1038/461472a. http://dx.doi.org/10.1038/461472a. PubMed. [DOI] [PubMed] [Google Scholar]
- 9.Kim BN, Gordillo LF, Kim Y. A model for the transmission dynamics of orientia tsutsugamushi among its natural reservoirs. J Theor Biol. 2010 Jun;266(1):154–61. doi: 10.1016/j.jtbi.2010.06.015. http://dx.doi.org/10.1016/j.jtbi.2010.06.015. PubMed. [DOI] [PubMed] [Google Scholar]
- 10.Kwa BH. Environmental change, development and vectorborne disease: Malaysia’s experience with filariasis, scrub typhus and dengue. Environ Dev Sustain. 2008 Apr;10(2):209–17. Epub 217. [Google Scholar]
- 11.Kim SH, Jang JY. Correlations between climate change-related infectious diseases and meteorological factors in Korea. J Prev Med Pub Health. 2010 Sep;43(5):436–44. doi: 10.3961/jpmph.2010.43.5.436. [DOI] [PubMed] [Google Scholar]
- 12.Estrada-Pena A, Venzal JM. A GIS framework for the assessment of tick impact on human health in a changing climate. Geospatial Health. 2007 May;1(2):157–68. doi: 10.4081/gh.2007.264. PubMed. [DOI] [PubMed] [Google Scholar]
- 13.Lozano-Fuentes S, Elizondo-Quiroga D, Farfan-Ale JA, et al. Use of Google Earth to strengthen public health capacity and facilitate management of vector-borne diseases in resource-poor environments. Bull World Health Organ. 2008 Sep;86(9):718–25. doi: 10.2471/BLT.07.045880. PubMed. PubMed Central. [DOI] [PMC free article] [PubMed] [Google Scholar]
- 14.Rogers DJ, Randolph SE, Snow RW, et al. Satellite imagery in the study and forecast of malaria. Nature. 2002 Feb;415(6872):710–5. doi: 10.1038/415710a. http://dx.doi.org/10.1038/415710a. PubMed. PubMed Central. [DOI] [PMC free article] [PubMed] [Google Scholar]
- 15.Gerrard R, Stine P, Church R, et al. Habitat evaluation using GIS -A case study applied to the San Joaquin Kit Fox. Landscape Urban Plan. 2001 Jan;52(4):239–55. http://dx.doi.org/10.1016/S0169-2046(00)00119-5. PubMed. [Google Scholar]
- 16.Jose MCP, Itami RM. GIS-based habitat modeling using logistic multiple regression: a study of the Mt. Graham red squirrel. Photogramm Eng Remote Sensing. 1991 Nov;57(11) 147501486. Epub 1486. [Google Scholar]
- 17.Kuo CC, Huang JL, Ko CY, et al. Spatial analysis of scrub typhus infection and its association with environmental and socioeconomic factors in Taiwan. Acta Trop. 2011 Oct-Nov;120(1–2):52–8. doi: 10.1016/j.actatropica.2011.05.018. http://dx.doi.org/10.1016/j.actatropica.2011.05.018. PubMed. [DOI] [PubMed] [Google Scholar]
- 18.Chapra SC. Applied numerical methods with MATLAB for engineers and scientists. New York: MCGRAW-HILL; 2008. [Google Scholar]
- 19.Ormsby T. Getting to know ArcGIS desktop. 3rd ed. Redlands, CA: ESRI Press; 2010. [Google Scholar]
- 20.Shapiro LG, Stockman GC. Computer vision. Upper Saddle River, NJ: Prentice Hall; 2001. London. [Google Scholar]
- 21.Kong WS, Shin EH, Lee HI, et al. Time-spatial distribution of scrub typhus and its environmental ecology. J Korean Geogr Soc. 2007;42(6):863–78. [Google Scholar]


