

Abstract
Purpose.
The accumulation of lipofuscin in the RPE is a hallmark of aging in the eye. The best characterized component of lipofuscin is A2E, a bis-retinoid byproduct of the normal retinoid visual cycle, which exhibits a broad spectrum of cytotoxic effects in vitro. The purpose of our study was to correlate the distribution of lipofuscin and A2E across the human RPE.
Methods.
Lipofuscin fluorescence was imaged in flat-mounted RPE from human donors of various ages. The spatial distributions of A2E and its oxides were determined using matrix-assisted laser desorption-ionization imaging mass spectrometry (MALDI-IMS) on flat-mounted RPE tissue sections and retinal cross-sections.
Results.
Our data support the clinical observations of strong RPE fluorescence, increasing with age, in the central area of the RPE. However, there was no correlation between the distribution of A2E and lipofuscin, as the levels of A2E were highest in the far periphery and decreased toward the central region. High-resolution MALDI-IMS of retinal cross-sections confirmed the A2E localization data obtained in RPE flat-mounts. Singly- and doubly-oxidized A2E had distributions similar to A2E, but represented <10% of the A2E levels.
Conclusions.
This report to our knowledge is the first description of the spatial distribution of A2E in the human RPE by imaging mass spectrometry. These data demonstrate that the accumulation of A2E is not responsible for the increase in lipofuscin fluorescence observed in the central RPE with aging.
Keywords: lipofuscin, A2E, retinoids, mass spectrometry, imaging, retinal degeneration, human
This report to our knowledge is the first description of the spatial distribution of A2E in the human RPE at high resolution, which has allowed a direct comparison of A2E distribution with lipofuscin fluorescence.
Introduction
Lipofuscin is undigested cellular waste that accumulates with increasing age in the lysosomes of postmitotic cells, including those of the nervous system. The composition of lipofuscin is characterized best in the eye, but varies among tissues. In the retina/RPE, where retinoid content is high and lipofuscin accumulates, over 20 bis-retinoid products have been extracted from lipofuscin (for a recent review, see the report of Sparrow et al.1). The best characterized of these compounds, and the first component of lipofuscin to be identified, is N-retinylidene-N-retinylethanolamine (A2E).2
Lipofuscin in the eye has been measured principally by fluorescence.3 In the human RPE, lipofuscin has been detected as early as one year of age,4 and increases until the age of 70 to 75 years.5 The concentration of lipofuscin has been shown to be elevated in the posterior pole,5 with a sharp drop in the region of the optic nerve head.3 This pattern is maintained with aging. Studies on the composition of lipofuscin usually are conducted on total extracts from the RPE, which prevents any spatially-resolved measurements of components. Unfortunately, the approach is hampered further by the relative insolubility of the material. The proteomics study by Ng et al.6 showed that lipofuscin is a complex mixture of lipids and protein components, with less than 2% of the material by weight having amino acid content.
The accumulation of lipofuscin (as measured by fluorescence) was proposed to depend on the availability of all-trans retinal, a potentially highly toxic allylic aldehyde, produced in the photoreceptor outer segments upon light exposure.7 However, recent studies suggest that 11-cis retinal also can give rise to lipofuscin.8 In animals where the production of 11-cis retinal is suppressed (such as in the RPE65−/− mouse), the level of fluorescence associated with lipofuscin is decreased.9,10 Likewise, in mouse models where all-trans retinal is not removed, lipofuscin is increased.11 Thus, retinal metabolites clearly are part of lipofuscin in the mouse. Based on mass spectrometry of total retinal extracts, many of the yet unidentified products in lipofuscin may be chemically-modified forms of A2E.12
A2E has been shown to increase with age, and more prominently in certain disease processes, such as Stargardt and Best diseases.13–15 The A2E molecule is formed from the N-retinylidene-phosphatidylethanolamine-derivative (A2-PE) which can be generated in the photoreceptor outer segments from all-trans retinal16; however, at least in certain mouse models, the precursor has been shown to be 11-cis retinal.8 In the RPE, where A2E accumulates, the molecule has been found to interfere with the lysosomal degradation of lipids,17 destabilize cellular membranes,18 and cause photo-oxidative damage in vitro.19,20 However, even though A2E is a major component of the organic extract of lipofuscin,15,21 it has not been possible to correlate disease pathology to A2E in vivo. Moreover, the role of A2E as the principal phototoxic component in lipofuscin has been questioned.22 In RPE cells, the generation of singlet oxygen by A2E is less efficient than by all-trans retinal.23 Activation of the retinoic acid receptor, which is detrimental to photoreceptor survival, also is more affected by all-trans retinal than by A2E.22 A detoxifying role for A2E has been suggested based on recent data showing that the removal of reactive all-trans retinal by amines results in protection from light-induced retinal degeneration.24
A direct spatial correlation of A2E with lipofuscin is not possible by traditional immunolocalization techniques. However, we recently reported a technique using matrix-assisted laser desorption/ionization (MALDI) imaging in which we have developed a high resolution and molecule-specific method to collect spatial information on A2E and its oxides across the RPE. Our experiments demonstrated that in the mouse, the distribution of A2E and lipofuscin correlate well.25 However the Bernstein group, using 8 mm punches from human RPE followed by extraction with organic solvents and analysis by HPLC, has shown that A2E concentration is lowest in the posterior pole of the eye, contrary to what was expected from lipofuscin fluorescence patterns.26 In the current study, we have applied the MALDI imaging technique to human RPE, and report that we did not find a correlation between the spatial distribution of A2E and lipofuscin fluorescence in humans.
Materials and Methods
Human Tissues
Human cadaver eyes (age 0–98 years, 24–48 hours postmortem) were obtained from the San Diego Eye Bank (San Diego, CA), the National Disease Resource Interchange (Philadelphia, PA), the Charleston Eye Bank (LifePoint, Inc., Charleston, SC), and Advanced Bioscience Resources (San Francisco, CA). The period between death and dissection of the tissue varied from 24 to 48 hours. All protocols were approved by the Medical University of South Carolina Institutional Review Board. Eyes were placed on a moist pad, the cornea was removed, and the sclera was separated gently from the underlying tissue. The eyecups were flattened onto indium tin oxide-coated conductive glass slides (50 × 75 mm; Delta Technologies Ltd., Stillwater, MN). Through small incisions in the anterior tissue, the neural retina was removed, and the tissue was desiccated in the dark. Care was taken to document the orientation of each eye. All protocols complied with the Declaration of Helsinki and were approved by the Medical University of South Carolina Institutional Review Board.
Synthesis of A2E
A2E was synthesized as described previously from ethanolamine (Sigma-Aldrich Corp., St. Louis, MO) and all-trans retinal (Sigma-Aldrich Corp.).27 The product was characterized by HPLC retention time and absorption spectra27 (Breeze 2 with a 2998 photodiode array detector; Waters Corp., Milford, MA), and NMR (Avance II with a 600 MHz Ultrashield magnet; Bruker Corp., Billerica, MA). The data are in agreement with those reported previously.27
Fluorescence Measurements
Tissues were imaged using a Zeiss Axioplan-2 Fluorescent Microscope (Carl Zeiss Microscopy, Thornwood, NY) with two objectives ×10 (numerical aperture [NA] = 0.3 or ×20 NA = 0.5) using 450 to 490 nm excitation. Color images were collected with a Nikon D200 DSLR camera (Nikon, Inc., Melville, NY). Fluorescence images of entire eyecups were collected with a bioluminescent imaging system (IVIS 200; Caliper Life Sciences, Hopkinton, MA) at two distinct wavelength ranges (515–575 nm, GFP filter; and 575–650 nm, DS red filter) with 450 to 490 nm excitation. The absolute intensities were calculated by selecting a region of interest in the instrument software (Living Image 4.3.1; Caliper Life Sciences) around the tissues and provided by the software in units of photon/(steradian × cm2 × h). The spatial resolution of these images was 500 μm. The IVIS instrument (IVIS 200; Caliper Life Sciences) has a cooled CCD camera capable of <5 electrons RMS readout noise, <100 electrons/s/cm2 dark noise, and 70 photons/s/sr/cm2 detection limit. The instrument uses a 150 W quartz halogen lamp with an autofluorescence background of 1 in 107. The intensities in these images were shown on a color scale compared to maximal intensity (red 100%, orange ∼90%, yellow ∼75%, green ∼50%, light blue ∼30%, and dark blue ∼15%, with continuous shades between).
MALDI Imaging of Flat-Mounted RPE Tissue
The flat-mounted tissues were hand sprayed with 20 mL of 10 mg/mL 2′,5′-dihydroxyacetophenone (Sigma-Aldrich Corp.) in 70:30 ethanol (Thermo Fisher Scientific, Inc., Waltham, MA) water (vol:vol) using a 5 mL TLC sprayer (Thermo Fisher Scientific, Inc.). MALDI data were collected in the positive ion mode at +25 kV accelerating potential on an AutoFlex II TOF mass spectrometer (Bruker Corp.) operating in reflector mode with the laser repetition rate set to 500 Hz. Before data collection, a linear external calibration was applied using leucine enkephalin (mass-to-charge ratio [m/z] 556.28; Bruker Corp.) and angiotensin II (m/z 1046.54; Bruker Corp.). These standards flank the mass of A2E to facilitate best calibration for the A2E molecule. Imaging data sets were acquired in the m/z 420 to 1400 range, with a raster step size of 300 μm and 200 laser shots per spectrum. After data acquisition, MALDI images were constructed using FlexImaging 2.0 software (Bruker Corp.). Each m/z signal was plotted ±0.5 m/z units. For display purposes in each individual sample, the data were normalized to the maximum of A2E signal in that sample, and pixel intensities were plotted on a color scale compared to maximal intensity (red 100%, orange ∼90%, yellow ∼75%, green ∼50%, light blue ∼30%, and dark blue ∼15%, with continuous shades between).
High-Resolution MALDI Imaging of Human Retina Cross-Sections
Retina tissue from an 82-year-old eye was prepared for high spatial resolution MALDI ionization imaging mass spectrometry (MALDI-IMS) experiments by removing the lens and drawing out the vitreous humor with a pipette, and replacing it with carboxymethyl cellulose (CMC, 1.0% in water). The tissue and CMC then were frozen to preserve the native structure and shape of the remaining eye cup. To obtain sections from the embedded eye cup, the CMC and sclera were removed from the outside of the eye using a Dremel rotary tool (Dremel, Mount Prospect, IL) with a 100 high-speed cutter attachment, which was cooled on dry ice. Great care was taken to ensure only the outer scleral tissue was removed and the retinal layers on the interior of the sclera were not damaged. The tissue was kept frozen during the entire procedure. After the majority of the sclera was removed, the tissue was re-embedded in 2.7% CMC. Sagittal sections 12 μm thick across the whole breadth of the eye cup were obtained with minimal wrinkling of the section as it passed over the cryostat blade. Sections were thaw-mounted onto gold-coated MALDI target plates (AB Sciex, Concord, Ontario, Canada) and placed in a vacuum desiccator until dry. An adjacent section was thaw-mounted to a microscope slide, and stained using hematoxylin and eosin before an optical scan was acquired using a Mirax scanner (HistechKft, Budapest, Hungary). The Mirax scanner acquired images at a 0.33 μm per pixel resolution, and the file was exported at a 1:16 ratio resulting in a 50 DPI resolution for the image.
The MALDI matrix, 2,5-dihydroxyacetophenone (DHA; Sigma-Aldrich Corp.) was applied via sublimation at 110°C for 10 minutes at 50 mTorr using a custom in-house apparatus. Four retina regions from the central retina region to the periphery of the eye cup were selected for MALDI imaging using Fleximaging 3.0 (Bruker Corp.) software and data were acquired in positive ion mode using a Bruker UltrafleXetreme II (Bruker Corp.) with a spatial resolution of 20 μm. Calibration was performed with a series of phosphorus cluster ions before image-data acquisition.28 The data obtained were processed using FlexImaging 3.0 and the A2E signal was normalized to the total ion current.
Results
Lipofuscin Fluorescence Increased Centrally With Age in the Human Eye
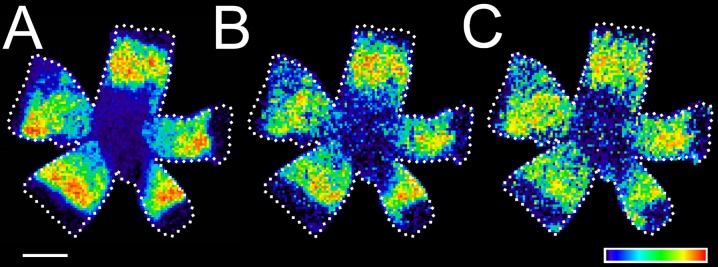
We analyzed for lipofuscin 35 human eyes across the lifespan (11–98 years) and two fetal human eyes (18–22 weeks). Flat-mounted tissues were examined under the fluorescent microscope, and fluorescence across the entire tissue was recorded using a bioluminescent imager in two ranges (golden-yellow, 575–650 nm and greenish-yellow, 515–575 nm). Fluorescence images of the entire RPE (with a 575–650 nm emission filter) from 21-, 41-, and 65-year-old human eyes are shown in Figures 1A to 1C, respectively. With increasing age, there was a gradual 1.5 order of magnitude increase in total fluorescence intensity, with the highest lipofuscin fluorescence intensities in the central area of the RPE. Regression analysis of the data showed that total lipofuscin fluorescence increases monotonically with age (Fig. 1D).5
Figure 1.

The spatial distribution of lipofuscin fluorescence in the human eye. Fluorescence images of the entire RPE from 21- (A), 41- (B), and 65-year-old (C) human eyes. The images were recorded with a bioluminescent imaging system with a 575 to 650 nm emission filter (DS red). Fluorescence intensity was coded by a false color scale. The images were oriented: superior (top); inferior (bottom); nasal (right); temporal (left); λexc = 450 to 490 nm (GFP). Scale bar: 1 cm. (D) The measured total intensity of lipofuscin fluorescence (DS red filter) increased with age. The unit is 109 photons/(steradian × cm2 × s).
The Table summarizes the total fluorescence intensities averaged by decades of age. Lipofuscin has been reported previously in eyes as early as 7 weeks of age.4 Our data showed that lipofuscin is abundant by 11 years, although fetal human eyes did not contain lipofuscin (data not shown). Lipofuscin increases until the age of 70 to 80 years. Fluorescence spectra of the RPE from eyes of different ages and within different topographic locations in individual eyes showed a similar spectral shape, with the emission maxima varying between 560 and 590 nm (data not shown). In all samples, the fluorescence was more intense (approximately one order of magnitude) in the golden-yellow range than in the greenish-yellow range. The consistent intensity ratios between the two ranges indicated no significant increase in a major fluorophore in either of these ranges with age.
Table.
Total Lipofuscin Fluorescence in the RPE With Age
|
Age Range |
N
Tissues |
Fluorescence, 515–575 nm* |
SD, 515–575 nm* |
Fluorescence, 575–650 nm* |
SD, 575–650 nm* |
|
|
| 10–19 | 1 | 1.18 | – | 1.85 | – | 0.64 | |
| 20–29 | 3 | 1.46 | 0.30 | 2.14 | 0.11 | 0.68 | |
| 40–49 | 1 | 5.94 | – | 8.35 | – | 0.71 | |
| 50–59 | 1 | 6.44 | – | 9.23 | – | 0.67 | |
| 60–69 | 6 | 6.84 | 0.99 | 10.20 | 1.67 | 0.67 | |
| 70–79 | 5 | 7.35 | 0.25 | 12.20 | 1.16 | 0.60 | |
| 80–89 | 6 | 8.97 | 1.26 | 13.80 | 2.08 | 0.65 | |
| 90–99 | 1 | 14.10 | – | 18.80 | – | 0.75 |
Units are 109 photons/(steradian × cm2 × s). Fluorescence is total fluorescence intensity in the tissue.
A2E in the Human Was Not Concentrated in the Central RPE
As the fluorescence emission spectrum of A2E is similar to that of other bis-retinoids as well as to the collected lipofuscin spectra,29 the presence of A2E cannot be inferred unequivocally on this basis. However, the MALDI-IMS technique is able to confirm the presence of A2E in the tissue as shown previously.25 Flat-mounted tissues were analyzed by MALDI-IMS with mass spectra collected in the 500 to 2500 m/z range at a resolution of 300 μm. A signal at m/z 592, the expected molecular weight of A2E, was observed in mass spectra acquired from the tissue. The tandem mass (MS/MS) spectrum confirmed that this peak was A2E by comparison to the fragmentation pattern of synthetic A2E as shown previously for the mouse model.25
The spatial distribution of A2E was determined by charting the relative abundance of m/z 592 over the tissue surface analyzed by MALDI. Figure 2 shows representative tissue images of A2E in flat-mounted RPE from 21- (Fig. 2A), 41- (Fig. 2B), and 62-year-old (Fig. 2C) human eyes. The intensities were proportional to the quantities of A2E detected and were normalized to the maximal level of A2E in the tissue. The distribution of A2E was not uniform at any age, but showed a pattern with the highest intensity in the far periphery (just below the ora serrata), with a gradual decrease toward the center. With increasing age, there was an apparent increase in A2E. Significant quantities of A2E in the mid periphery were detected by 42 years (Fig. 2B), and continued to be observed until 62 years of age (Fig. 2C). Beyond the age of 70 years the detection of A2E revealed lower levels, but without a change in the overall distribution. The cell density of the RPE is known to decrease with age, which may account for these old-age changes.30–32 Considerable levels of A2E (compared to the periphery) were not measured in the central area of the RPE in any of the tissues examined.
Figure 2.

The spatial distribution of A2E in the human eye. MALDI images of A2E (m/z 592) in flat-mounted RPE from 21- (A), 41- (B), and 62-year-old (C) human eyes. The pixel intensity was proportional to A2E quantity, with the scale normalized to total ion current. The relative amount of the appropriate molecule was coded by a false color scale. The images were oriented: superior, top; inferior, bottom; nasal, right (A, B) or left (C); temporal, left (A, B) or right (C). Scale bar: 1 cm. Comparisons of mass spectra from different areas of the human eye (D). The MALDI spectra in the m/z 580 to 625 range are from the same tissue as in (C) and are shown with the same intensity scale. The graph on the top (black trace) is the average mass spectrum (MALDI profile) from the entire tissue. The lower traces show individual mass spectra from selected points from the periphery (red trace), the center (blue trace), and the ciliary epithelium outside the RPE (green trace) were shown. The peak at m/z 592.5 was identified by tandem mass spectrometry directly from the tissue as A2E and the peak at m/z 616 was identified as heme. Oxidized A2E (singly-oxidized, m/z 608; and doubly-oxidized A2E, m/z 624) also were indicated in the red trace. The locations of the individual spectra are indicated in (C). Scale bar: 5 arbitrary intensity units (D).
To demonstrate that the absence of A2E signal in the center of the RPE was not due to cell loss, mass spectra in the range of 580 to 625 m/z from random points in the periphery, in the center, and from the area of the ciliary epithelium outside the RPE were compared on the same intensity scale (Fig. 2D). This was the same eye as shown in Figure 2C, and the arrows in Figure 2C indicate the locations of the traces in Figure 2D. For comparison, Figure 2D also contains the MALDI profile or average mass spectrum over the entire tissue (black trace). In the average spectrum, the intensity of A2E (m/z 592.5) was quite low; however, in the periphery A2E was more abundant than the prominent m/z 616 ion (Fig. 2D, red trace). Using tandem mass spectrometry, m/z 616 was identified as heme (data not shown). A2E and heme were present with their expected isotopic distribution peaks. Although we did not detect A2E in the central region (Fig. 2D, blue trace), a strong signal for heme was observed in that region. In the ciliary epithelium, outside of the RPE, neither A2E nor heme was present in quantities higher than the background (Fig. 2D, green trace).
A2E Distribution as Measured in Retinal Cross-Sections
A potential concern with the MALDI imaging measurements was whether there was more A2E present deeper (>5 μm) within the tissue than could be detected in the flat-mounted tissue. For this reason, we made measurements on cross-sections of human retinal tissue. Figure 3A displays a hematoxylin and eosin stained image from a sagittal section through the whole eyecup (neural retina intact) of an 82-year-old donor (enlarged in Supplementary Fig. S1). The areas outlined by the boxes labeled 1 to 4 indicate the regions where MALDI-IMS data were acquired with 20 μm spatial resolution. The images spanned the retina cell layers from sclera to inner neural retina. Figure 3B shows the A2E signal (m/z 592.5) for these regions in corresponding adjacent sections both alone (top row) and also superimposed on the histologic images of Figure 3A (bottom row). The RPE (indicated by the arrow in Fig. 3A) produced an intense signal for A2E in periphery of the eye (Fig. 3B, region 4) with decreasing intensity observed in more central regions of the eye (Fig. 3B, regions 2–3). The signal was present in a one pixel (20 μm) width cell layer, which is consistent with its presence in the RPE (approximately 14 μm wide).33 The data were in agreement with that from the flat-mounted tissue, as significant signal was not observed in the central region (Fig. 3B, region 4). Considerable amounts of A2E were not observed in any of the layers of the retinal tissue other than the peripheral RPE in these MALDI experiments, although more sensitive techniques detected some low levels of A2E signals in the central RPE and also in photoreceptor cells (data not shown).
Figure 3.

A2E detection in retinal cross-sections. Hematoxylin and eosin stain of an 82-year-old eye cup sagittal section (A). In the retina overview, black boxes (1–4) indicate the regions where the MALDI-IMS data were acquired, spanning from the center (1) to the periphery (4) of the tissue as shown enlarged. Scale bar: 1 mm. (B) MALDI images of m/z 592 (A2E) in the regions (1–4) indicated in (A), taken from the adjacent section. (A) shows the A2E signal (m/z 592.5) alone (top row) and also superimposed on the histologic images of ([A], bottom row). The images display the distribution of A2E across the breadth of the tissue, normalized to total ion current. The panels are aligned vertically around the location of the RPE.
Oxidized A2E Species Followed a Spatial Pattern Similar to That of A2E
Oxidized A2E has been reported from in vitro studies to form under blue light and oxidative conditions, and the oxidized products have been shown to be more toxic than A2E itself.34 In all the human RPE tissues analyzed, the distribution patterns of singly- and doubly-oxidized A2E closely followed that of A2E. Examples of images for oxidized A2E products are shown in Figure 4 for the flat-mounted RPE from a 62-year-old human eye (Fig. 4A, A2E, m/z 592; Fig. 4B, singly-oxidized A2E, m/z 608; and Fig. 4C, doubly-oxidized A2E, m/z 624). The identities of these products were confirmed by tandem mass spectrometry.21 For comparison of the distribution patterns, the signal intensities in the panels of Figure 4 were normalized to the ion of interest in the panel; however, the measured levels of oxidized A2E products always were lower (<10%) than those of A2E. The addition of more than two oxygen atoms could not be confirmed in any of the human RPE tissues studied, although higher oxidation levels have been reported previously from in vitro experiments.35
Figure 4.
The spatial distribution of A2E oxides in the human eye. MALDI images of (A) A2E (m/z 592), (B) singly-oxidized A2E (m/z = 608), and (C) doubly-oxidized A2E (m/z = 624) in flat-mounted RPE from a 62-year-old human eye. The pixel intensity was proportional to the quantity of the molecule of interest, with the scale normalized to total ion current. The relative amount of the appropriate molecule was coded by a false color scale, but the intensities of the oxidized A2E images have been enhanced (∼30-fold) to emphasize signal distribution. The images were oriented: superior (top); inferior (bottom); nasal (left); temporal (right). Oxidation states higher than doubly-oxidized A2E were not detected. Scale bar: 1 cm.
No Correlation Between A2E Levels and Lipofuscin Fluorescence Intensities
A profile distribution analysis was prepared to demonstrate the lack of correlation of lipofuscin fluorescence intensity and A2E distribution, as calculated from MALDI-IMS imaging. Figure 5A represents the lipofuscin fluorescence (blue) and A2E levels (red) in a 63-year-old healthy eye across the same section (which contained the optic nerve head and central area). The intensities were proportional to normalized pixel intensities in the respective images. The strongest A2E signals were in the peripheral tissue, while the lipofuscin fluorescence distribution was strongest in the center of the RPE tissue. To confirm these observations further, Figure 5B shows a direct comparison of lipofuscin fluorescence (left flat-mount) and A2E (right flat-mount) in the same 11-year-old RPE tissue, and indicating a representative area that was photographed in the fluorescence microscope (inset). The micrograph shows cells of a hexagonal pattern, characteristic of the RPE, with golden-yellow fluorescent lipofuscin material. No A2E signal was detected in this area.
Figure 5.

The comparison of lipofuscin fluorescence and MALDI images of A2E in human eyes. (A) Cross-section profile of lipofuscin fluorescence and A2E levels in a 63-year-old eye showed lack of distribution correlation. Both quantities were normalized to their maximal values. The cross-section was drawn through the optic nerve head and central areas; λexc = 450 to 490 nm. (B) Lipofuscin and A2E do not colocalize. The left flat-mount showed lipofuscin fluorescence (λexc = 450–490 nm) in an 11-year-old eye. The right flat-mount showed the MALDI image of A2E (m/z 592) in the same eye. Scale bar: 1 cm. The fluorescent micrograph in the inset was from the indicated central area and shows the visible presence of golden-yellow lipofuscin (λexc = 488 nm), while A2E is minimal in the same area. The melanin pigment is seen as the brownish color and the areas where the RPE is transparent show up as green (the color of the underlying collagenous layers). Scale bar: 50 μm.
To date, we have analyzed two dozen tissues from normal human eyes of ages fetal to 98 years. In all tissues, there was a lack of correlation in the spatial distribution when comparing the tissue images of lipofuscin fluorescence and A2E. Contrary to lipofuscin, which was distributed first uniformly, then centrally with increasing age in all samples, A2E showed a higher accumulation in the far periphery which, independent of age, tapered-off toward the center. In none of the samples analyzed did the distribution pattern of A2E correlate with that of lipofuscin.
Discussion
Lipofuscin accumulation in the RPE has been shown to be associated with aging in humans. There is a clear pattern of increased lipofuscin as measured by fluorescence toward the center of the RPE and our data supported numerous earlier findings. Although the procedure collects whole tissue fluorescence, and not specifically that emitted by lipofuscin granules, it is likely to be a good measure of lipofuscin fluorescence. Tissue fluorescence measurements may be affected slightly by melanin screening, as the light used for fluorescence excitation (445–490 nm) also is absorbed by melanin, potentially resulting in an underestimation of the fluorescence in the central region compared to that in the rest of the eye.36 However, the peak fluorescence excited with wavelengths ranging from 420 to 560 nm shows good correlation with the fluorescence of lipofuscin, measured using 550 nm excitation and collecting the emission from 650 to 750 nm (conditions that minimize interference).36
A2E, a principal component of lipofuscin, also has been shown to increase with age in humans and animal models (for a review, see the report of Sparrow et al.1). A2E is a byproduct of the normal visual cycle and is one of a class of over 20 bis-retinoids that have been identified in the RPE.1 Currently, A2E levels usually are determined by ESI-MS/MS from whole tissue homogenates after extraction from the tissue with organic solvents and subsequent HPLC separation.21 The methods used to detect A2E are highly sensitive and molecularly selective, but preclude spatial information unless small sections are assayed and compared, as was done by the Bernstein group.26 Our goal was to determine the spatial distribution of A2E across the human RPE and to correlate this distribution with lipofuscin fluorescence, which is not specific for molecular identification. With the ability of collecting molecularly specific information over the surface of the tissue, MALDI-IMS is an ideal technique for this task.25 The comparison of the mass spectra from the various points on the surface to the average mass spectrum (Fig. 2D) provided clear evidence that MALDI imaging detects information (local concentrations) that is lost to traditional extraction-based methods (the results of which are comparable to the average MALDI mass spectrum).
Using the MALDI-IMS imaging technique, we have found that, unlike in the mouse,25 there was no correlation of A2E distribution with lipofuscin fluorescence in the 35 human eyes examined. These tissues were not controlled for sex or race. The donor health history was unknown, although no major ocular disease was reported. Our results confirmed the earlier findings using extraction of A2E from small regions of the RPE,26 that the greatest concentration of A2E is in the peripheral RPE. The extraction data of Bhosale et al.26 show that some A2E is present in the center of the RPE. However, it is not detected in these MALDI experiments due to the limited dynamic range of the MALDI, which prohibits detection of low abundance signals when other highly intense ions are present. We have not measured absolute quantities; however, we can estimate this potential error using the data from their measurements (∼0.1 ng/mm2 A2E density in the center and approximately 3-fold that in the periphery). The MALDI data are collected at a single spot from a circular area with a diameter of half of the instrument resolution (25 μm); therefore, 80 attomol A2E/MALDI spot (in the center) was undetected, but 240 attomol A2E/MALDI spot (in the periphery) was detectable. Consequently, we do not wish to imply that no A2E is in the center area of the RPE, but rather that its greatest concentration is in the peripheral RPE. The oxides of A2E follow the pattern found for A2E and, like in the mouse model, we only see the addition of two oxygen atoms, representing <10% of A2E. Data on the distribution of other modified forms and metabolites of A2E are needed for an in-depth analysis of the effect of bis-retinoids on the overall health and function of the retina.
A2E is extracted readily from the RPE and the synthetic standard can be prepared to confirm its identity. There is compelling evidence from in vitro experiments that this compound is highly cytotoxic. Further, it has been shown that this compound is a normal byproduct of the visual process. As A2E accumulation has been linked to lipofuscin increases and aging, there has been considerable interest in developing pharmacologic approaches to reduce the rate of A2E accumulation. The data presented here suggested that A2E and its oxides are not major contributors to the fluorescence associated with lipofuscin in the posterior pole of the human eye. Still, it remains unclear if breakdown products or metabolites of A2E could be deleterious to the retina/RPE, and if controlling those levels could affect retinal degeneration. To address some of these fundamental questions, we currently are developing technologies to identify the major lipofuscin fluorophores in the posterior pole of the human eye.
Acknowledgments
The authors thank John Oatis for the synthesis of A2E.
Supported in part by National Institutes of Health (NIH) Grants R21 EY020661 (ZA, RKC), R01 EY004939 (RKC), R01 EY014850 (YK), R21 EY019728 (KLS), and R01 EY19065 (ZA); the Foundation Fighting Blindness, Inc. (Owings Mills, Maryland; RKC), and an unrestricted grant to the Department of Ophthalmology at MUSC from Research to Prevent Blindness (New York). RKC is an RPB Senior Scientific Investigator. Research was conducted in part in the MUSC Mass Spectrometry Institutional Research Resource Facility, and in the Cell & Molecular Imaging Shared Resource of the Hollings Cancer Center per Cancer Center Support Grant P30 CA138313.
Disclosure: Z. Ablonczy, None; D. Higbee, None; D.M. Anderson, None; M. Dahrouj, None; A.C. Grey, None; D. Gutierrez, None; Y. Koutalos, None; K.L. Schey, None; A. Hanneken, None; R.K. Crouch, None
References
- 1. Sparrow JR, Gregory-Roberts E, Yamamoto K, et al. The bisretinoids of retinal pigment epithelium. Prog Retin Eye Res. 2012; 31: 121–135 [DOI] [PMC free article] [PubMed] [Google Scholar]
- 2. Sakai N, Decatur J, Nakanishi K, Eldred GE. Ocular age pigment “A2E”: an unprecedented pyridinium bisretinoid. J Am Chem Soc. 1996; 118: 1559–1560 [Google Scholar]
- 3. Delori FC, Dorey CK, Staurenghi G, Arend O, Goger DG, Weiter JJ. In vivo fluorescence of the ocular fundus exhibits retinal pigment epithelium lipofuscin characteristics. Invest Ophthalmol Vis Sci. 1995; 36: 718–729 [PubMed] [Google Scholar]
- 4. Feeney L. Lipofuscin and melanin of human retinal pigment epithelium. Fluorescence, enzyme cytochemical, and ultrastructural studies. Invest Ophthalmol Vis Sci. 1978; 17: 583–600 [PubMed] [Google Scholar]
- 5. Wing GL, Blanchard GC, Weiter JJ. The topography and age relationship of lipofuscin concentration in the retinal pigment epithelium. Invest Ophthalmol Vis Sci. 1978; 17: 601–607 [PubMed] [Google Scholar]
- 6. Ng KP, Gugiu B, Renganathan K, et al. Retinal pigment epithelium lipofuscin proteomics. Mol Cell Proteomics. 2008; 7: 1397–1405 [DOI] [PMC free article] [PubMed] [Google Scholar]
- 7. Liu J, Itagaki Y, Ben-Shabat S, Nakanishi K, Sparrow JR. The biosynthesis of A2E, a fluorophore of aging retina, involves the formation of the precursor, A2-PE, in the photoreceptor outer segment membrane. J Biol Chem. 2000; 275: 29354–29360 [DOI] [PubMed] [Google Scholar]
- 8. Boyer NP, Higbee D, Currin MB, et al. Lipofuscin and N-retinylidene-N-retinylethanolamine (A2E) accumulate in retinal pigment epithelium in absence of light exposure: their origin is 11-cis-retinal. J Biol Chem. 2012; 287: 22276–22286 [DOI] [PMC free article] [PubMed] [Google Scholar]
- 9. Katz ML, Drea CM, Robison WG Jr. Relationship between dietary retinol and lipofuscin in the retinal pigment epithelium. Mech Ageing Dev. 1986; 35: 291–305 [DOI] [PubMed] [Google Scholar]
- 10. Katz ML, Redmond TM. Effect of Rpe65 knockout on accumulation of lipofuscin fluorophores in the retinal pigment epithelium. Invest Ophthalmol Vis Sci. 2001; 42: 3023–3030 [PubMed] [Google Scholar]
- 11. Maeda A, Maeda T, Imanishi Y, et al. Role of photoreceptor-specific retinol dehydrogenase in the retinoid cycle in vivo. J Biol Chem. 2005; 280: 18822–18832 [DOI] [PMC free article] [PubMed] [Google Scholar]
- 12. Murdaugh LS, Mandal S, Dill AE, Dillon J, Simon JD, Gaillard ER. Compositional studies of human RPE lipofuscin: mechanisms of molecular modifications. J Mass Spectrom. 2011; 46: 90–95 [DOI] [PubMed] [Google Scholar]
- 13. Mata NL, Weng J, Travis GH. Biosynthesis of a major lipofuscin fluorophore in mice and humans with ABCR-mediated retinal and macular degeneration. Proc Natl Acad Sci U S A. 2000; 97: 7154–7159 [DOI] [PMC free article] [PubMed] [Google Scholar]
- 14. Bakall B, Radu RA, Stanton JB, et al. Enhanced accumulation of A2E in individuals homozygous or heterozygous for mutations in BEST1 (VMD2). Exp Eye Res. 2007; 85: 34–43 [DOI] [PubMed] [Google Scholar]
- 15. Wu Y, Fishkin NE, Pande A, Pande J, Sparrow JR. Novel lipofuscin bisretinoids prominent in human retina and in a model of recessive Stargardt disease. J Biol Chem. 2009; 284: 20155–20166 [DOI] [PMC free article] [PubMed] [Google Scholar]
- 16. Sparrow JR, Kim SR, Cuervo AM, Bandhyopadhyayand U. A2E, a pigment of RPE lipofuscin, is generated from the precursor, A2PE by a lysosomal enzyme activity. Adv Exp Med Biol. 2008; 613: 393–398 [DOI] [PubMed] [Google Scholar]
- 17. Lakkaraju A, Finnemann SC, Rodriguez-Boulan E. The lipofuscin fluorophore A2E perturbs cholesterol metabolism in retinal pigment epithelial cells. Proc Natl Acad Sci U S A. 2007; 104: 11026–11031 [DOI] [PMC free article] [PubMed] [Google Scholar]
- 18. Sparrow JR, Cai B, Jang YP, Zhou J, Nakanishi K. A2E, a fluorophore of RPE lipofuscin, can destabilize membrane. Adv Exp Med Biol. 2006; 572: 63–68 [DOI] [PubMed] [Google Scholar]
- 19. Schutt F, Davies S, Kopitz J, Holz FG, Boulton ME. Photodamage to human RPE cells by A2-E, a retinoid component of lipofuscin. Invest Ophthalmol Vis Sci. 2000; 41: 2303–2308 [PubMed] [Google Scholar]
- 20. Sparrow JR, Nakanishi K, Parish CA. The lipofuscin fluorophore A2E mediates blue light-induced damage to retinal pigmented epithelial cells. Invest Ophthalmol Vis Sci. 2000; 41: 1981–1989 [PubMed] [Google Scholar]
- 21. Gutierrez DB, Blakeley L, Goletz PW, et al. Mass spectrometry provides accurate and sensitive quantitation of A2E. Photochem Photobiol Sci. 2010; 9: 1513–1519 [DOI] [PMC free article] [PubMed] [Google Scholar]
- 22. Maeda A, Golczak M, Maeda T, Palczewski K. Limited roles of Rdh8, Rdh12, and Abca4 in all-trans-retinal clearance in mouse retina. Invest Ophthalmol Vis Sci. 2009; 50: 5435–5443 [DOI] [PMC free article] [PubMed] [Google Scholar]
- 23. Pawlak A, Wrona M, Rozanowska M, et al. Comparison of the aerobic photoreactivity of A2E with its precursor retinal. Photochem Photobiol. 2003; 77: 253–258 [DOI] [PubMed] [Google Scholar]
- 24. Maeda A, Golczak M, Chen Y, et al. Primary amines protect against retinal degeneration in mouse models of retinopathies. Nat Chem Biol. 2011; 8: 170–178 [DOI] [PMC free article] [PubMed] [Google Scholar]
- 25. Grey AC, Crouch RK, Koutalos Y, Schey KL, Ablonczy Z. Spatial localization of A2E in the retinal pigment epithelium. Invest Ophthalmol Vis Sci. 2011; 52: 3926–3933 [DOI] [PMC free article] [PubMed] [Google Scholar]
- 26. Bhosale P, Serban B, Bernstein PS. Retinal carotenoids can attenuate formation of A2E in the retinal pigment epithelium. Arch Biochem Biophys. 2009; 483: 175–181 [DOI] [PMC free article] [PubMed] [Google Scholar]
- 27. Parish CA, Hashimoto M, Nakanishi K, Dillon J, Sparrow J. Isolation and one-step preparation of A2E and iso-A2E, fluorophores from human retinal pigment epithelium. Proc Natl Acad Sci U S A. 1998; 95: 14609–14613 [DOI] [PMC free article] [PubMed] [Google Scholar]
- 28. Sladkova K, Houska J, Havel J. Laser desorption ionization of red phosphorus clusters and their use for mass calibration in time-of-flight mass spectrometry. Rapid Commun Mass Spectrom. 2009; 23: 3114–3118 [DOI] [PubMed] [Google Scholar]
- 29. Haralampus-Grynaviski NM, Lamb LE, Clancy CM, et al. Spectroscopic and morphological studies of human retinal lipofuscin granules. Proc Natl Acad Sci U S A. 2003; 100: 3179–3184 [DOI] [PMC free article] [PubMed] [Google Scholar]
- 30. Del Priore LV, Kuo YH, Tezel TH. Age-related changes in human RPE cell density and apoptosis proportion in situ. Invest Ophthalmol Vis Sci. 2002; 43: 3312–3318 [PubMed] [Google Scholar]
- 31. Harman AM, Fleming PA, Hoskins RV, Moore SR. Development and aging of cell topography in the human retinal pigment epithelium. Invest Ophthalmol Vis Sci. 1997; 38: 2016–2026 [PubMed] [Google Scholar]
- 32. Panda-Jonas S, Jonas JB, Jakobczyk-Zmija M. Retinal pigment epithelial cell count, distribution, and correlations in normal human eyes. Am J Ophthalmol. 1996; 121: 181–189 [DOI] [PubMed] [Google Scholar]
- 33. Curcio CA, Messinger JD, Sloan KR, Mitra A, McGwin G, Spaide RF. Human chorioretinal layer thicknesses measured in macula-wide, high-resolution histologic sections. Invest Ophthalmol Vis Sci. 2011; 52: 3943–3954 [DOI] [PMC free article] [PubMed] [Google Scholar]
- 34. Wielgus AR, Collier RJ, Martin E, et al. Blue light induced A2E oxidation in rat eyes--experimental animal model of dry AMD. Photochem Photobiol Sci. 2010; 9: 1505–1512 [DOI] [PubMed] [Google Scholar]
- 35. Ben-Shabat S, Itagaki Y, Jockusch S, Sparrow JR, Turro NJ, Nakanishi K. Formation of a nonaoxirane from A2E, a lipofuscin fluorophore related to macular degeneration, and evidence of singlet oxygen involvement. Angew Chem Int Engl. 2002; 41: 814–817 [DOI] [PubMed] [Google Scholar]
- 36. Delori FC, Goger DG, Dorey CK. Age-related accumulation and spatial distribution of lipofuscin in RPE of normal subjects. Invest Ophthalmol Vis Sci. 2001; 42: 1855–1866 [PubMed] [Google Scholar]