

Abstract
OBJECTIVE
Insulin may play important roles in brain metabolism. Proton magnetic resonance spectroscopy (1H-MRS) of the central nervous system gives information on neuronal viability, cellular energy, and membrane status. To elucidate the specific role of insulin action in the brain, we estimated neurometabolites with 1H-MRS and assessed their regulation by insulin infusion and their relationship with insulin sensitivity.
RESEARCH DESIGN AND METHODS
We studied 16 healthy young men. 1H-MRS was performed at baseline and after 240 min of euglycemic-hyperinsulinemic clamp. Voxels were positioned in the left frontal lobe, left temporal lobe, and left thalamus. The ratios of N-acetylaspartate (NAA), choline-containing compounds (Cho), myo-inositol, and glutamate/glutamine/γ-aminobutyric acid complex (Glx) to creatine (Cr) and nonsuppressed water signal were determined. The participants were divided into subgroups of high (high IS) and low (low IS) insulin sensitivity.
RESULTS
Baseline neurometabolic substrates were not different between the groups. Insulin infusion resulted in an increase in frontal NAA/Cr and NAA/H2O and frontal and temporal Glx/Cr and Glx/H2O and a decrease in frontal Cho/Cr and temporal Cho/H2O and myo-inositol/H2O (all P < 0.05, except temporal Glx/H2O, P = 0.054, NS) in the high-IS, but not in the low-IS, group. Insulin sensitivity correlated positively with frontal NAA/Cr and NAA/H2O and temporal Glx/H2O and negatively with temporal myo-inositol/Cr and myo-inositol/H2O assessed during the second 1H-MRS (all P < 0.05).
CONCLUSIONS
Insulin might influence cerebral metabolites, and this action is impaired in subjects with low whole-body insulin sensitivity. Thus, our results provide a potential link between insulin resistance and altered metabolism of the central nervous system.
Diabetes is associated with an increased risk of cognitive dysfunction and dementia, including Alzheimer disease (1). Cognitive disturbances relative to age-matched controls appear to be more pronounced in patients with type 2 diabetes than in patients with type 1 diabetes. Type 1 diabetic patients with >30 years of diabetes have a similar cognitive profile and less brain structural magnetic resonance imaging (MRI) abnormalities than age- and education-matched type 2 diabetic patients with only 7 years of diabetes (2). Furthermore, many studies indicate that cognitive decline and neurodegeneration are also increased in prediabetes and the metabolic syndrome (3). Chronic exposure to hyperglycemia and severe hypoglycemia cannot fully explain the effects of diabetes on the brain (2). Some data indicate that vascular disease could contribute to abnormalities in cognition in diabetes (4). By contrast, other studies reported that adjustment for hypertension and other vascular risk factors seemed to have no effect on the relative risk of dementia in diabetic patients (5,6). Furthermore, brain abnormalities among obese adolescents with type 2 diabetes without significant vascular disease were demonstrated (7). Thus, the risk factors that primarily drive the association between diabetes and dementia need to be identified.
There is increasing evidence linking insulin resistance to cognitive decline and dementia (1). Insulin receptors are widely expressed in the brain, with a particular abundance in the hippocampus and the cortex (8). Within the brain, insulin acts as a modulator of food intake and energy homeostasis, mainly by hypothalamic nuclei (9). Furthermore, brain insulin, in interaction with other regulatory peptides and neurotransmitters, can activate cognitive processes. There is evidence that insulin may play important roles in learning and memory (10). Insulin administration improved memory in both human and animal studies (11–13). It was shown that insulin signaling was altered in the brain in Alzheimer disease (14), which is the most common cause of dementia in people with type 2 diabetes (15).
Neurometabolic substrates of human brain function, which are imperceptible to conventional structural MRI, may be shown with proton magnetic resonance spectroscopy (1H-MRS). 1H-MRS allows for the analysis of brain chemistry in vivo and gives the opportunity to monitor changes in the neurometabolites of the human brain in different conditions. N-acetylaspartate (NAA) is a neuronal amino acid that is used as a marker of neuronal density and integrity (16). NAA is reduced in disease states where neuronal loss is evident, such as in tumors, and reduction of NAA correlates with the degree of neurodegeneration in neuropathological conditions, including dementia. However, after transient ischemia and brain injury without neuronal death, NAA levels are able to recover, suggesting that it is a marker of neuronal functionality rather than neuronal density (17). The choline (Cho) peak in 1H-MRS includes phosphorylcholine, glycerophosphocholine, and a relatively negligible amount of free Cho (18,19). The changes in peak Cho can reflect altered cell membrane synthesis and degradation and might correspond to glial cell proliferation (18,19). Myo-inositol is a simple sugar alcohol that is a putative glial cell marker. It acts as an intracellular second messenger and an osmoregulator, and it is a cell membrane constituent (20). The spectral peaks of glutamine, glutamate, and γ-aminobutyric acid (GABA) are grouped together as Glx (21). Glutamate is the most abundant excitatory amino acid transmitter in the brain (22). Glutamine is synthesized from glutamate by glutamine synthetase in glia and converted back to glutamate by glutaminase (a mitochondrial enzyme) in neurons, completing the glutamate-glutamine cycle. This cycle is a sequence of events by which an adequate supply of the neurotransmitter glutamate is maintained in the central nervous system (17). Glutamate can also be produced by the transamination of 2-oxoglutarate, an intermediate in the tricarboxylic acid cycle (23). Glutamate is also the precursor of GABA, the major inhibitory neurotransmitter (24). The creatine (Cr) signal refers to the sum of Cr and phosphocreatine and reflects energy use. Except in trauma, stroke, tumor, and hyperglycemic conditions, Cr levels tend to remain relatively unchanged (25–27). Therefore, Cr is used as a putative internal standard against which other metabolites can be compared (25,26). The water peak is also used as an internal reference, with the assumption that the concentration of water does not vary significantly between regions (26). Metabolic alterations in cerebral tissues on 1H-MRS were demonstrated in patients with impaired glucose tolerance and type 2 diabetes (28).
So far, no studies have examined the role of insulin in the regulation of neurometabolites through assessment with 1H-MRS, which reflects neuronal density and integrity, markers of energy metabolism or inflammation, as well as neurotransmitters. Therefore, to elucidate the specific role of insulin action in brain functions, we quantified metabolites in cerebral tissues with 1H-MRS and assessed their regulation by insulin infusion and their relationship with insulin sensitivity in young healthy men.
RESEARCH DESIGN AND METHODS
Study group
The study group consisted of 16 apparently healthy male volunteers. All study participants had normal glucose tolerance in the oral glucose tolerance test according to World Health Organization criteria. The exclusion criteria were morbid obesity (BMI >40 kg/m2), extreme physical activity, cardiovascular diseases, hypertension, infectious diseases, or other serious medical problems. All study participants were nonsmokers and not taking anti-inflammatory drugs or drugs affecting carbohydrate and lipid metabolism. They followed the weight-maintaining diet for at least the previous 3 months. Before entering the study, the clinical examination and appropriate laboratory tests were performed. All analyses were performed after an overnight fast.
Study protocol
All participants underwent a 1-day study protocol that included a brain structural MRI and 1H-MRS at basal state and then the 240-min euglycemic-hyperinsulinemic clamp study, combined with the second brain structural MRI and 1H-MRS after the clamp, in the conditions of euglycemic hyperinsulinemia.
The study protocol was approved by the local ethics committee of the Medical University of Białystok, and all subjects gave their informed written consent before participation.
Anthropometry
The BMI was calculated as weight in kilograms divided by the square of height in meters. The waist circumference was measured at the smallest circumference between the rib cage and the iliac crest, with the subject in the standing position. Percentage of body fat was assessed by bioelectric impedance analysis using the Tanita TBF-511 Body Fat Analyzer (Tanita Corp., Tokyo, Japan).
Insulin sensitivity
Insulin sensitivity was evaluated by the euglycemic-hyperinsulinemic clamp technique according to DeFronzo et al. (29). On the morning of the study, two venous catheters were inserted into antecubital veins, one for the infusion of the insulin and glucose and the other in the contralateral hand for the blood sampling, with that hand heated to about 60°C (30). Insulin (Actrapid HM; Novo Nordisk, Copenhagen, Denmark) was given as a primed continuous intravenous infusion for 240 min at 40 mU ⋅ m−2 ⋅ min−1, resulting in constant hyperinsulinemia of about 80 µIU/mL. Arterialized blood glucose was obtained every 5 min, and 20% dextrose (1.11 mol/L) infusion was adjusted to maintain a glucose level at 5 mmol/L. The rate of whole-body glucose uptake (M value) was calculated as the mean glucose infusion rate during the last 40 min of the clamp, corrected for the glucose space and normalized for fat-free mass (ffm). Then, participants were divided into subgroups of high insulin sensitivity (high IS) (above median from the clamp study, 8.86 mg/kg ffm/min, n = 8; M = 11.54 ± 2.71 mg/kg ffm/min) and low insulin sensitivity (low IS) (below median, n = 8; M = 7.19 ± 1.87 mg/kg ffm/min).
After the 4-h clamp, the second structural MRI and 1H-MRS were performed. During the second brain structural MRI and 1H-MRS, we prolonged insulin infusion at the same rate as during the clamp study. The glucose infusion rate was continued as during the end of the 4-h period. To maintain euglycemia, the measurement of blood glucose was performed every 10 min, and 20% dextrose infusion was appropriately adjusted. Steady-state insulin concentration did not differ during the clamp and the second brain structural MRI and 1H-MRS.
MRI and 1H-MRS
Brain structural MRI imaging and 1H-MRS examinations were performed on a 1.5 T scanner (Picker Eclipse; Picker International Inc., Highlands Heights, OH) with the use of a standard circularly polarized head coil. Imaging sequences included T1-weighted 5-mm-thick sections and axial T2-weighted series. 1H-MRS examinations were performed with a single voxel point-resolved single voxel localized spectroscopy (PRESS) sequence with repetition time (TR) = 1,500 ms, echo time (TE) = 35 ms, number of excitations = 192, and 2-kHz bandwidth. Voxels of 2 × 2 × 2 cm3 were positioned in the following regions of interest: left frontal lobe, left temporal lobe, and left thalamus.
The signal over the voxel of interest was shimmed to within a line width of 3–7 Hz, and then an unsuppressed signal of water was acquired with eight excitations. Subsequently, the multiply optimized insensitive suppression train (MOIST) method was used for suppressing the signal from water.
Spectroscopic data were analyzed using the software package Via 2.0 E provided by Picker. The 1H-MRS data were zero filled to 4,096 points. Residual water resonances were removed using time-domain high-pass filtering. Exponential to Gaussian transformation was applied as a time-domain apodizing filter. Then data were Fourier transformed and phase corrected. After application of a Legendre polynomial function to approximate the baseline, an automated curve fitting was performed using an iterative, nonlinear least squares fitting procedure by the means Levenberg-Marquardt algorithm. Line shapes of the simulated peaks used in the fitting process were fixed with 85% Gaussian and 15% Lorentzian fractions.
Metabolites to Cr ratios were analyzed, and the ratios of metabolites to nonsuppressed water signal were calculated according to the following formula: metabolite area × 1,000/nonsuppressed water area.
The following peaks were assessed: NAA at 2.01 ppm and Cr at 3.03 ppm, Cho at 3.22 ppm, Glx complex in the area from 2.11 to 2.45 ppm, and myo-inositol at 3.56 ppm (Fig. 1).
Figure 1.

1H-MRS spectrum obtained from left frontal lobe of the subject from the examined group. Thick gray line represents the raw spectrum; thin black line is the best-fitted spectrum. mI, myo-inositol.
Biochemical analysis
Plasma glucose was measured immediately by the enzymatic method using a glucose analyzer (YSI 2300 STAT Plus; YSI Life Sciences, Yellow Springs, OH) for the oral glucose tolerance test and clamp studies. Serum total cholesterol, HDL cholesterol, and triglycerides were assessed by an enzymatic method using commercial kits produced by ANALCO-GBG (Warsaw, Poland). The concentration of LDL cholesterol was calculated from the Friedewald formula: LDL cholesterol = total cholesterol − triglycerides/5 − HDL cholesterol (mg/dL) (31). Before estimation of the serum concentrations of insulin, the samples were kept frozen at −80°C. The serum insulin was measured with immunoradiometric assay (BioSource Europe, Nivelles, Belgium). The sensitivity of the assay was 1 µIU/mL, and the intra-assay and interassay coefficients of variation were below 2.2 and 6.5%, respectively.
Statistical analysis
The statistics were performed with the STATISTICA 8.0 program (StatSoft, Krakow, Poland). The variables, which did not have a normal distribution, were log transformed before analyses. For the purpose of the data presentation, these variables were antilog transformed again to absolute values in the results. The differences between the groups were estimated with ANOVA. Repeated-measures ANOVA with planned comparisons was used to assess the difference between the brain metabolites on 1H-MRS at baseline and in response to hyperinsulinemia. The relationship between the variables was studied with the Pearson product-moment correlation analysis. The level of significance was accepted at P < 0.05.
RESULTS
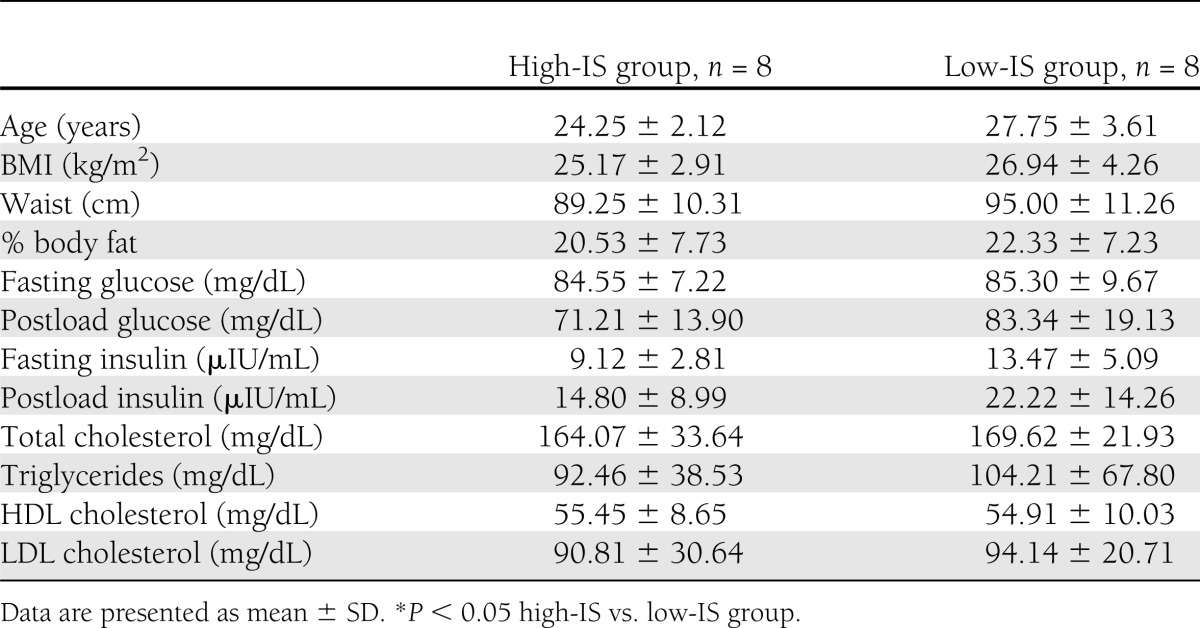
The clinical characteristics of the studied groups are given in Table 1. The groups did not differ in BMI, waist circumference, % body fat, fasting plasma glucose, and insulin concentrations (Table 1), although subjects with low IS tended to have higher fasting serum insulin (P = 0.052; NS).
Table 1.
Clinical characteristics of the studied groups
Baseline NAA, Cho, myo-inositol, and Glx in the frontal and temporal regions and thalamus were not different between high-IS and low-IS groups after correction for both Cr and H2O (Tables 2 and 3).
Table 2.
Brain metabolite-to-Cr ratios at baseline and during hyperinsulinemia in the studied groups
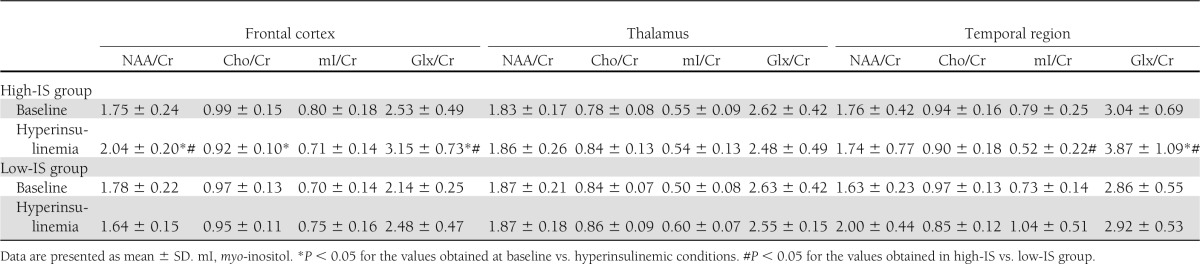
Table 3.
Brain metabolite-to-H2O ratios at baseline and during hyperinsulinemia in the studied groups
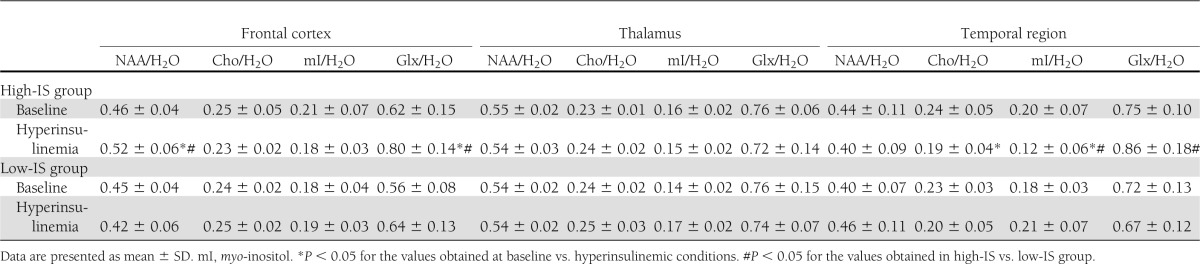
NAA/Cr and NAA/H2O in the frontal region increased in response to hyperinsulinemia in high-IS subjects (P = 0.0018 and P = 0.007, respectively), but not in the low-IS group. In the high-IS group, a decrease in frontal region Cho/Cr (P = 0.044) and a decrease in temporal region Cho/H2O (P = 0.032) and myo-inositol/H2O (P = 0.015) during insulin infusion were observed, which was not the case in the low-IS group. Frontal and temporal region Glx/Cr and Glx/H2O increased in response to hyperinsulinemia in the high-IS group (frontal region, Glx/Cr, P = 0.0033, Glx/H2O, P = 0.0065; temporal region, Glx/Cr, P = 0.002, Glx/H2O, P = 0.054, NS). There were no significant changes in the estimated parameters in the low-IS group (all P > 0.15, except frontal Glx/Cr, P = 0.078) (Tables 2 and 3).
In consequence of these changes, frontal NAA/Cr and NAA/H2O ratios assessed during the second 1H-MRS were higher in the high-IS group in comparison with the low-IS group (P = 0.0004 and P = 0.01, respectively). Temporal myo-inositol/Cr and myo-inositol/H2O ratios assessed during insulin infusion were lower in the high-IS group in comparison with the low-IS group (P = 0.032 and P = 0.015, respectively). Frontal and temporal Glx/Cr and Glx/H2O ratios assessed during the second 1H-MRS were higher in the high-IS group in comparison with the low-IS group (frontal region, Glx/Cr, P = 0.04, Glx/H2O, P = 0.029; temporal region, Glx/Cr, P = 0.057, NS, Glx/H2O, P = 0.032) (Tables 2 and 3).
When all 16 subjects were analyzed together, an increase in frontal Glx/Cr (P = 0.017) and Glx/H2O (P = 0.008) and temporal Glx/Cr (P = 0.015) and a decrease in temporal Cho/H2O (P = 0.005) were observed during insulin infusion.
We observed significant correlations between insulin sensitivity and frontal NAA/Cr (r = 0.78, P < 0.001) (Fig. 2) and NAA/H2O (r = 0.65, P = 0.006) and temporal myo-inositol/Cr (r = −0.67, P = 0.012), myo-inositol/H2O (r = −0.81, P < 0.001) (Fig. 2), and Glx/H2O (r = 0.63, P = 0.012) assessed during the second 1H-MRS.
Figure 2.
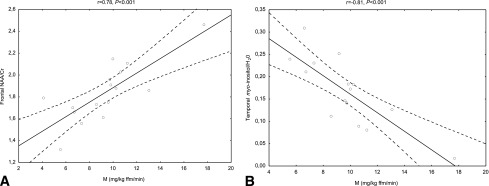
Relationships between insulin sensitivity and frontal NAA/Cr (A) and temporal myo-inositol/H2O (B) during insulin infusion in the entire study population (n = 16).
We also observed significant correlations between percent body fat and baseline temporal myo-inositol/H2O (r = 0.55, P = 0.027). Waist circumference was related to baseline temporal myo-inositol/H2O (r = 0.57, P = 0.02). Baseline temporal myo-inositol/Cr and myo-inositol/H2O were related to total cholesterol (r = 0.61, P = 0.011 and r = 0.56, P = 0.025, respectively) and LDL cholesterol (r = 0.62, P = 0.01 and r = 0.54, P = 0.03, respectively). Baseline temporal myo-inositol/H2O and Cho/H2O were also related to triglycerides (r = 0.60, P = 0.015 and r = 0.57, P = 0.022, respectively). No correlations between BMI and neurometabolites were observed.
The correlations and all significant differences (before and during insulin infusion) observed in the high-IS group were still significant after excluding one subject with the highest insulin sensitivity.
CONCLUSIONS
The main finding of our study is that insulin infusion resulted in significant changes of brain neurochemistry on 1H-MRS in young healthy men with high IS but not with low IS. In particular, we observed an increase in frontal NAA/Cr and NAA/H2O and frontal and temporal Glx/Cr and Glx/H2O and a decrease in frontal Cho/Cr and temporal Cho/H2O and myo-inositol/ H2O in young healthy men with high insulin sensitivity.
The metabolites in our study were calculated for Cr, which is altered in hyperglycemic conditions (27). However, we conducted our experiments under a euglycemic state, which should not affect Cr, and we also corrected all metabolites for H2O signal.
We found that NAA after correction for both Cr and H2O in the frontal cortex increased in insulin-stimulated conditions in high-IS subjects but not in the low-IS group. In consequence of these changes, frontal NAA/Cr and NAA/ H2O ratios assessed during the second 1H-MRS were higher in the high-IS group in comparison with the low-IS group. The baseline NAA/Cr and NAA/H2O ratios in the frontal lobe were not different between the high- and low-IS groups. Of note is the fact that insulin infusion revealed differences in young healthy men according to their insulin sensitivity. NAA is used as a marker of neuronal metabolism. Our data suggest that insulin could improve neuronal metabolism in healthy subjects with better insulin action. Sahin et al. (28) found decreased NAA/Cr ratios in the frontal cortex of type 2 diabetic patients with higher hemoglobin A1c levels (>10%). Reduced NAA has been also reported in patients with atherosclerotic cerebral disease (32). Chronic exposure to hyperglycemia and cerebrovascular disease independently will turn out neuronal dysfunction or accelerate neuronal damage. However, our data indicate that the young healthy subjects with normal glucose metabolism and without vascular diseases but with low IS could have impaired neuronal metabolism. This indicates that altered insulin signaling could be a primary risk factor for neuronal dysfunction. Our data provide the first evidence that low NAA might be associated with an impaired insulin action even without clinically evident pathology. This might provide a potential link for the previously observed associations between apparent pathological conditions and low NAA and might also reflect reduced neuronal mass in these diseases. NAA is synthesized mostly in mitochondria (17), and our data indicate that insulin might affect mitochondrial processes in neurons. Impaired insulin signaling could play a role in Alzheimer disease pathogenesis. A decrease in the NAA/Cr ratios, in both cortical and/or limbic structures, was observed in patients with Alzheimer disease (21). Importantly, we observed significant positive correlations between insulin sensitivity and frontal lobe NAA/Cr and NAA/H2O ratios in insulin-stimulated conditions. It was shown that homeostasis model assessment of insulin resistance levels were inversely correlated with parietal white matter NAA/Cr ratios in type 2 diabetic patients (28). Interestingly, in another study, an altered insulin effect on cerebrocortical activity as assessed by magneto-encephalography was shown in conditions associated with peripheral insulin resistance (33).
Frontal and temporal lobe Glx/Cr and Glx/H2O increased during the clamp in the high-IS group. The balance of glutamatergic and GABAergic transmission is required to maintain proper brain function (10). Emerging evidence has suggested that insulin signaling plays a role in synaptic plasticity by modulating the activities of excitatory and inhibitory receptors, such as glutamate and GABA receptors, and by triggering signal transduction cascades, leading to an alternation of gene expression that is required for memory consolidation (10). Our data indicate that insulin could influence glutamatergic and GABAergic transmission in frontal and temporal lobes, and the insulin influence of this neurotransmission could be altered in healthy humans with low IS. The limitation of our study is that we cannot discriminate between glutamate, glutamine, and GABA within the Glx spectrum. However, previous data (17) indicate that glutamate is the main metabolite in the Glx spectrum. As glutamate mainly reflects neuronal metabolism, we hypothesize that the observed increase in Glx after insulin indicates the hormone influence on neuronal metabolism and transmission. Because glutamate metabolism is connected with mitochondria (23), insulin could influence glutamatergic activity by affecting mitochondrial processes in neurons. In future studies, it would be advisable to also assess the glutamine/glutamate ratio, as it is a better marker of glutamatergic activity than each concentration separated (17). Glx may be a measure of glutamate-glutamine cycling activity (34). Importantly, we observed significant correlations between insulin sensitivity and the insulin-stimulated temporal Glx/H2O ratio. It has been discovered by functional MRI that insulin, when given to healthy human adults under euglycemic clamp to maintain normal blood glucose levels, results in activation of the medial temporal lobe, including the hippocampus, a structure critically required for processing declarative memory (35).
We observed a decrease in the temporal lobe myo-inositol/H2O ratio in the high-IS group, which was not the case in the low-IS group. Myo-inositol is involved in the metabolism of cell membrane inositol phospholipids, which is fundamental for cellular signal transduction. It is a substrate for the components of the phosphoinositide pathways (36). The activation of the insulin receptor stimulates the routes for inositol lipid metabolism associated with phosphatidylinositol 3-kinase and production of the phosphorylated derivatives of phosphoinositide, which are second messengers in cellular signal transduction (10). The decrease in myo-inositol during insulin infusion in the high-IS group could be connected with an increase in the concentrations of phosphorylated derivatives of phosphoinositide. Impaired insulin signaling in insulin-resistant subjects may result in decreased concentrations of the inositol metabolites in these pathways and could lead to an increase in brain myo-inositol levels in insulin resistance. In our study, insulin sensitivity inversely correlated with temporal myo-inositol/Cr and myo-inositol/H2O ratios assessed during the second 1H-MRS. In the study of Sahin et al. (28), there was an increase in the myo-inositol/Cr ratio in the frontal cortex in type 2 diabetic subjects in comparison with controls. In the same study, the change in the myo-inositol/Cr ratio obtained from the frontal cortex, thalamus, and parietal white matter was similar for patients with impaired glucose tolerance and type 2 diabetes. These findings may suggest a role for increased insulin resistance in causing the observed changes (28). Some data indicate that the accumulation of myo-inositol within the brain of diabetic subjects is associated with chronic hyperglycemia. Myo-inositol as a major organic osmolyte could regulate brain osmotic adaptation in hyperglycemic conditions (17), which is not the case in our study.
Interestingly, reduced phosphoinositide concentrations were found in the anterior temporal cortex of a brain with Alzheimer disease (36). Furthermore, it has been shown that the activity of phosphatidylinositol kinase was reduced in the postmortem brains of patients with Alzheimer disease (36). These data may suggest that alteration in phosphoinositide pathways could promote the enhancement of myo-inositol levels in the brain. Indeed, an increase in myo-inositol levels has been frequently reported in the brain with Alzheimer disease. It has been suggested that myo-inositol was a marker of glial proliferation in this disease (37). In several neurological disorders, myo-inositol was found to be increased, and this is generally assumed to be a marker of gliosis, based on the fact that higher myo-inositol levels are found in cultured astrocytes as compared with neurons in vitro (17). However, in the study by Duarte et al. (27) brain myo-inositol levels did not correlate with the molecular marker of gliosis.
In our study, in the high-IS group, but not in the low-IS group, a decrease in frontal region Cho/Cr and temporal region Cho/H2O in the insulin-stimulated condition was observed. The decrease in Cho during the clamp could be the result of using Cho-containing compounds in the synthesis of neurotransmitters. Some data showed an increase of Cho in both the white matter and the gray matter of type 2 diabetic patients when compared with patients with type 1 diabetes (38). Sahin et al. (28) showed an increase in frontal cortical Cho/Cr in patients with impaired glucose tolerance. Authors suggested that this finding may indicate a demyelinating process. Our results indicate that insulin could influence membrane turnover, and in insulin-resistant subjects, these processes could be altered.
We cannot exclude the possibility that the low-IS group may have shown changes if studied longer. On the other hand, a 4-h period was sufficient to induce changes in high-IS subjects with no significant changes in the low-IS group.
In our study, the changes in the brain neurochemistry under hyperinsulinemic conditions were observed only in the frontal and temporal region and not in the thalamus. Lack of the changes in neurometabolites in the thalamus might indicate that the alterations observed in other areas of interest are not related to a different amount of glucose infused. It might be related to the higher density of insulin receptors in these regions in comparison with the thalamus (39).
The potential limitation of our study is the clinical relevance of low IS/insulin resistance derived from clamp, given the lack of differences in other studied parameters, for instance, BMI. However, this approach allowed us to analyze the results only with respect to insulin action, without any confounding factors. Clamp-derived insulin sensitivity was reduced by 37.7% in the low-IS group in comparison with the high-IS group. Insulin resistance is an important risk factor for type 2 diabetes, cardiovascular disease, and Alzheimer disease (1). Indeed, in a recently published study, an impaired insulin action in the postmortem brains of patients with Alzheimer disease was demonstrated (40).
Our data show that insulin might influence cerebral metabolites, and this action is impaired in subjects with low whole-body insulin sensitivity. Thus, our results provide a potential link between insulin resistance and altered metabolism of the central nervous system.
Acknowledgments
This study was supported by a grant from the Poland Ministry of Science and Higher Education (NN 402477337).
No potential conflicts of interest relevant to this article were reported.
M.K.-K. designed the study, researched data, performed the statistics, and wrote the manuscript. E.T. researched 1H-MRS data. A.N., M.S., N.M., and E.O. researched data. M.G. reviewed the manuscript. M.S. researched data, performed the statistics, and reviewed the manuscript. I.K. researched data, performed the statistics, and wrote and reviewed the manuscript. M.K.-K. is the guarantor of this work and, as such, had full access to all the data in the study and takes responsibility for the integrity of the data and the accuracy of the data analysis.
References
- 1.Roriz-Filho JS, Sá-Roriz TM, Rosset I, et al. (Pre)diabetes, brain aging, and cognition. Biochim Biophys Acta 2009;1792:432–443 [DOI] [PubMed]
- 2.Brands AM, Biessels GJ, Kappelle LJ, et al. Utrecht Diabetic Encephalopathy Study Group Cognitive functioning and brain MRI in patients with type 1 and type 2 diabetes mellitus: a comparative study. Dement Geriatr Cogn Disord 2007;23:343–350 [DOI] [PubMed] [Google Scholar]
- 3.Luchsinger JA, Tang MX, Shea S, Mayeux R. Hyperinsulinemia and risk of Alzheimer disease. Neurology 2004;63:1187–1192 [DOI] [PubMed] [Google Scholar]
- 4.McCall AL. The impact of diabetes on the CNS. Diabetes 1992;41:557–570 [DOI] [PubMed] [Google Scholar]
- 5.Peila R, Rodriguez BL, Launer LJ, Honolulu-Asia Aging Study Type 2 diabetes, APOE gene, and the risk for dementia and related pathologies: The Honolulu-Asia Aging Study. Diabetes 2002;51:1256–1262 [DOI] [PubMed] [Google Scholar]
- 6.MacKnight C, Rockwood K, Awalt E, McDowell I. Diabetes mellitus and the risk of dementia, Alzheimer’s disease and vascular cognitive impairment in the Canadian Study of Health and Aging. Dement Geriatr Cogn Disord 2002;14:77–83 [DOI] [PubMed] [Google Scholar]
- 7.Yau PL, Javier DC, Ryan CM, et al. Preliminary evidence for brain complications in obese adolescents with type 2 diabetes mellitus. Diabetologia 2010;53:2298–2306 [DOI] [PMC free article] [PubMed] [Google Scholar]
- 8.Bondy CA, Cheng CM. Signaling by insulin-like growth factor 1 in brain. Eur J Pharmacol 2004;490:25–31 [DOI] [PubMed] [Google Scholar]
- 9.Plum L, Belgardt BF, Brüning JC. Central insulin action in energy and glucose homeostasis. J Clin Invest 2006;116:1761–1766 [DOI] [PMC free article] [PubMed] [Google Scholar]
- 10.Zhao WQ, Chen H, Quon MJ, Alkon DL. Insulin and the insulin receptor in experimental models of learning and memory. Eur J Pharmacol 2004;490:71–81 [DOI] [PubMed] [Google Scholar]
- 11.McNay EC, Ong CT, McCrimmon RJ, Cresswell J, Bogan JS, Sherwin RS. Hippocampal memory processes are modulated by insulin and high-fat-induced insulin resistance. Neurobiol Learn Mem 2010;93:546–553 [DOI] [PMC free article] [PubMed] [Google Scholar]
- 12.Benedict C, Hallschmid M, Hatke A, et al. Intranasal insulin improves memory in humans. Psychoneuroendocrinology 2004;29:1326–1334 [DOI] [PubMed] [Google Scholar]
- 13.Kern W, Peters A, Fruehwald-Schultes B, Deininger E, Born J, Fehm HL. Improving influence of insulin on cognitive functions in humans. Neuroendocrinology 2001;74:270–280 [DOI] [PubMed] [Google Scholar]
- 14.de la Monte SM. Insulin resistance and Alzheimer’s disease. BMB Rep 2009;42:475–481 [DOI] [PMC free article] [PubMed] [Google Scholar]
- 15.Janson J, Laedtke T, Parisi JE, O’Brien P, Petersen RC, Butler PC. Increased risk of type 2 diabetes in Alzheimer disease. Diabetes 2004;53:474–481 [DOI] [PubMed] [Google Scholar]
- 16.Rutgers DR, Klijn CJ, Kappelle LJ, van der Grond J. Cerebral metabolic changes in patients with a symptomatic occlusion of the internal carotid artery: a longitudinal 1H magnetic resonance spectroscopy study. J Magn Reson Imaging 2000;11:279–286 [DOI] [PubMed] [Google Scholar]
- 17.Duarte JM, Lei H, Mlynárik V, Gruetter R. The neurochemical profile quantified by in vivo 1H NMR spectroscopy. Neuroimage 2012;61:342–362 [DOI] [PubMed] [Google Scholar]
- 18.Miller BL, Chang L, Booth R, et al. In vivo 1H MRS choline: correlation with in vitro chemistry/histology. Life Sci 1996;58:1929–1935 [DOI] [PubMed] [Google Scholar]
- 19.Katz-Brull R, Koudinov AR, Degani H. Direct detection of brain acetylcholine synthesis by magnetic resonance spectroscopy. Brain Res 2005;1048:202–210 [DOI] [PubMed] [Google Scholar]
- 20.Fisher SK, Novak JE, Agranoff BW. Inositol and higher inositol phosphates in neural tissues: homeostasis, metabolism and functional significance. J Neurochem 2002;82:736–754 [DOI] [PubMed] [Google Scholar]
- 21.Hall H, Cuellar-Baena S, Dahlberg C, In’t Zandt R, Denisov V, Kirik D. Magnetic resonance spectroscopic methods for the assessment of metabolic functions in the diseased brain. Curr Top Behav Neurosci 2012;11:169–198 [DOI] [PubMed] [Google Scholar]
- 22.Meldrum BS. Glutamate as a neurotransmitter in the brain: review of physiology and pathology. J Nutr 2000;130(Suppl.):1007S–1015S [DOI] [PubMed] [Google Scholar]
- 23.Shank RP, Bennett DJ. 2-Oxoglutarate transport: a potential mechanism for regulating glutamate and tricarboxylic acid cycle intermediates in neurons. Neurochem Res 1993;18:401–410 [DOI] [PubMed] [Google Scholar]
- 24.Ben-Ari Y, Gaiarsa JL, Tyzio R, Khazipov R. GABA: a pioneer transmitter that excites immature neurons and generates primitive oscillations. Physiol Rev 2007;87:1215–1284 [DOI] [PubMed] [Google Scholar]
- 25.Martin WR. MR spectroscopy in neurodegenerative disease. Mol Imaging Biol 2007;9:196–203 [DOI] [PubMed] [Google Scholar]
- 26.Ross AJ, Sachdev PS. Magnetic resonance spectroscopy in cognitive research. Brain Res Brain Res Rev 2004;44:83–102 [DOI] [PubMed] [Google Scholar]
- 27.Duarte JM, Carvalho RA, Cunha RA, Gruetter R. Caffeine consumption attenuates neurochemical modifications in the hippocampus of streptozotocin-induced diabetic rats. J Neurochem 2009;111:368–379 [DOI] [PubMed] [Google Scholar]
- 28.Sahin I, Alkan A, Keskin L, et al. Evaluation of in vivo cerebral metabolism on proton magnetic resonance spectroscopy in patients with impaired glucose tolerance and type 2 diabetes mellitus. J Diabetes Complications 2008;22:254–260 [DOI] [PubMed] [Google Scholar]
- 29.DeFronzo RA, Tobin JD, Andres R. Glucose clamp technique: a method for quantifying insulin secretion and resistance. Am J Physiol 1979;237:E214–E223 [DOI] [PubMed] [Google Scholar]
- 30.Ferrannini E, Mari A. How to measure insulin sensitivity. J Hypertens 1998;16:895–906 [DOI] [PubMed] [Google Scholar]
- 31.Friedewald WT, Levy RI, Fredrickson DS. Estimation of the concentration of low-density lipoprotein cholesterol in plasma, without use of the preparative ultracentrifuge. Clin Chem 1972;18:499–502 [PubMed] [Google Scholar]
- 32.Kario K, Matsuo T, Hoshide S, Umeda Y, Shimada K. Effect of thrombin inhibition in vascular dementia and silent cerebrovascular disease. An MR spectroscopy study. Stroke 1999;30:1033–1037 [DOI] [PubMed] [Google Scholar]
- 33.Tschritter O, Preissl H, Hennige AM, et al. The cerebrocortical response to hyperinsulinemia is reduced in overweight humans: a magnetoencephalographic study. Proc Natl Acad Sci USA 2006;103:12103–12108 [DOI] [PMC free article] [PubMed] [Google Scholar]
- 34.Bartha R, Williamson PC, Drost DJ, et al. Measurement of glutamate and glutamine in the medial prefrontal cortex of never-treated schizophrenic patients and healthy controls by proton magnetic resonance spectroscopy. Arch Gen Psychiatry 1997;54:959–965 [DOI] [PubMed] [Google Scholar]
- 35.Rotte M, Baerecke C, Pottag G, et al. Insulin affects the neuronal response in the medial temporal lobe in humans. Neuroendocrinology 2005;81:49–55 [DOI] [PubMed] [Google Scholar]
- 36.Ross BD, Bluml S, Cowan R, Danielsen E, Farrow N, Gruetter R. In vivo magnetic resonance spectroscopy of human brain: the biophysical basis of dementia. Biophys Chem 1997;68:161–172 [DOI] [PubMed] [Google Scholar]
- 37.Ackl N, Ising M, Schreiber YA, Atiya M, Sonntag A, Auer DP. Hippocampal metabolic abnormalities in mild cognitive impairment and Alzheimer’s disease. Neurosci Lett 2005;384:23–28 [DOI] [PubMed] [Google Scholar]
- 38.Kreis R, Ross BD. Cerebral metabolic disturbances in patients with subacute and chronic diabetes mellitus: detection with proton MR spectroscopy. Radiology 1992;184:123–130 [DOI] [PubMed] [Google Scholar]
- 39.Schulingkamp RJ, Pagano TC, Hung D, Raffa RB. Insulin receptors and insulin action in the brain: review and clinical implications. Neurosci Biobehav Rev 2000;24:855–872 [DOI] [PubMed] [Google Scholar]
- 40.Talbot K, Wang HY, Kazi H, et al. Demonstrated brain insulin resistance in Alzheimer’s disease patients is associated with IGF-1 resistance, IRS-1 dysregulation, and cognitive decline. J Clin Invest 2012;122:1316–1338 [DOI] [PMC free article] [PubMed] [Google Scholar]