

Abstract
Enormous data collection efforts and improvements in technology have made large genome-wide association studies a promising approach for better understanding the genetics of common diseases. Still, the knowledge gained from these studies may be extended even further by testing the hypothesis that genetic susceptibility is due to the combined effect of multiple variants or interactions between variants. Here we explore and evaluate the use of a genetic algorithm to discover groups of SNPs (of size 2, 3, or 4) that are jointly associated with bipolar disorder. The algorithm is guided by the structure of a gene interaction network, and is able to find groups of SNPs that are strongly associated with the disease, while performing far fewer statistical tests than other methods.
Keywords: Biology and Genetics, Evolutionary Computing and Genetic Algorithms, Graphs and Networks
1 Introduction
In the past five years, nearly 500 large-scale genome-wide association (GWA) studies have been performed in an attempt to better understand the genetic component of complex diseases [1]. Unfortunately, for many of the diseases studied only a small fraction of disease risk can be explained by the SNP associations discovered so far. A number of hypotheses may be able to explain this lack of success. For instance, a large portion of disease susceptibility may be due to types of genetic variation that are not measured in a GWAS, such as rare variants or epigenetic variation. However, one hypothesis that can be explored with the currently available data is that multi-locus associations (interactions among SNPs) may explain a greater proportion of risk than individual SNPs alone.
The search for multi-locus associations is hardly a trivial problem, given the enormous combinatorial complexity and the inherent statistical issues (i.e., the multiple testing problem). Despite the difficulty of the problem, a number of different approaches have been used to discover multi-locus associations [2], [3], [4], [5], [6]. For the most part, previous approaches have dealt with the issue of combinatorial complexity by reducing the number of SNPs included in the analysis or by looking only for SNP pairs, ignoring the possibility of higher-order interactions.
Several researchers have proposed the use of genetic algorithms (GAs) to detect multi-locus associations or solve similar problems [7], [8], [9], [10], but to our knowledge no GA has yet been applied to a large-scale GWA study. The GA is a general purpose search and optimization algorithm—based on the process of natural selection—that has been used in a number of diverse areas, from engineering design to RNA structure prediction [11], [12], [13], [14]. The technique is particularly useful for exploring large search spaces, and when the problem may have multiple solutions. The current problem of discovering multi-locus associations definitely fits these criteria.
2 Methods
2.1 The Data
The main goal of this study was to show the feasibility of discovering multi-locus associations in a full-scale case-control GWA study. The genotype data is from the Bipolar Genome Study (BiGS) and consists of 1865 individuals genotyped by the Translational Genomics Research Institute (TGen) [15]. The Affymetrix Human Genome SNP 6.0 array, with over 900000 SNPs, was used to genotype all subjects, and genotype calls were made with the CRLMM algorithm [16].
Only cases with a diagnosis of bipolar I disorder were included in the study. In addition, the following criteria were used to remove low quality samples/SNPs: low genotyping call rates per sample (< 0.97), excessively high or low sample heterozygosity rates, low genotyping call rates per SNP (< 0.95), low minor allele frequency (< 0.01), and deviation from Hardy-Weinberg Equilibrium (p-value < 0.000001). After these quality control measures were applied, 1117 cases, 402 controls, and 636169 SNPs remained.
Given the large number of SNPs and the fact that we are attempting to find associations with groups of two to four SNPs, the combinatorial complexity represents a serious challenge. To address this problem, a gene interaction network was used to constrain the search space. This technique was previously used by Emily, et al. to some success [17].
Gene interaction data was gathered from the STRING database (ver. 8.1) [18], while gene definitions were taken from Ensembl (ver. 54, NCBI build 36) [19]. To integrate the SNP data and the interaction data, all SNPs were mapped to the genes in the interaction network. A SNP was mapped to a gene if it fell within the gene itself or within a 3 kb window upstream or downstream of the gene. Of the 636169 SNPs that passed quality control, 217012 SNPs mapped to 12793 genes in the interaction network. The interaction network contained 1695444 gene interactions.
In an attempt to focus the search even further, we compiled results from various studies about the pathophysiology and genetics of bipolar disorder. Evidence from previous linkage studies, gene association studies, and gene expression studies was used to assign scores to genes in the interaction network. In addition, gene function information and network connectivity were also used to score genes. The algorithm is able to use the gene scores to preferentially select the most promising genes—those with prior evidence of involvement in bipolar disorder—as it searches the network for multi-locus associations. All of the previous research used to assign gene scores in the interaction network can be found in the Supplemental Materials.
2.2 The Algorithm
A standard genetic algorithm was adapted to the task of searching for groups of SNPs that are jointly associated with bipolar disorder, in the context of a standard case-control GWAS. The algorithm is constrained by the structure of a gene interaction network, where each node in the network represents a gene and all SNPs that are located within or near that gene.
Fig. 1 gives a basic overview of the algorithm, and the algorithm’s mutation procedure is illustrated in Fig. 2. The fitness value used by the algorithm is the p-value from a simple Chi-square, but any statistical test of association could have been used. A Chi-square test was chosen because it is easily and quickly calculated. For all multi-SNP associations tested, an r × 2 contingency table was created, where the rows represent each possible genotype combination. For instance, for a pair of SNPs, a 9 × 2 contingency table is created and a Chi-square test with 8 degrees of freedom is calculated (for a group of three SNPs, a 27 × 2 contingency table would be needed).
Fig. 1.
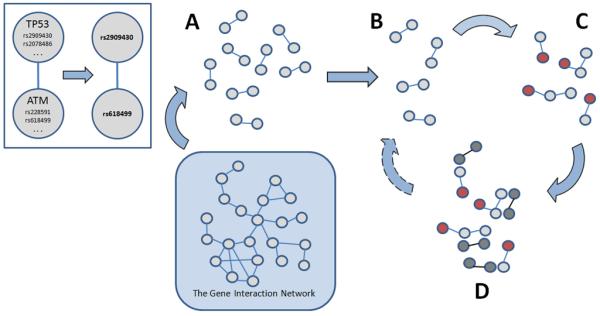
The genetic algorithm applied to a gene interaction network. The nodes in the gene interaction network represent genes and the SNPs that lie within or near each gene. The algorithm first selects a gene and then randomly chooses one of the gene’s SNPs (top left). A) Using the structure of the interaction network, a population of SNP pairs is created randomly. B) The fitness of each SNP pair is calculated and, based on those fitness scores, half of the population is selected to become “parents” for the next generation. C) A specified proportion of parents are randomly altered, or mutated, to create “offspring”. D) The parents plus the offspring become the new population and the process repeats, beginning with the calculation of fitness for each of the new offspring.
Fig. 2.
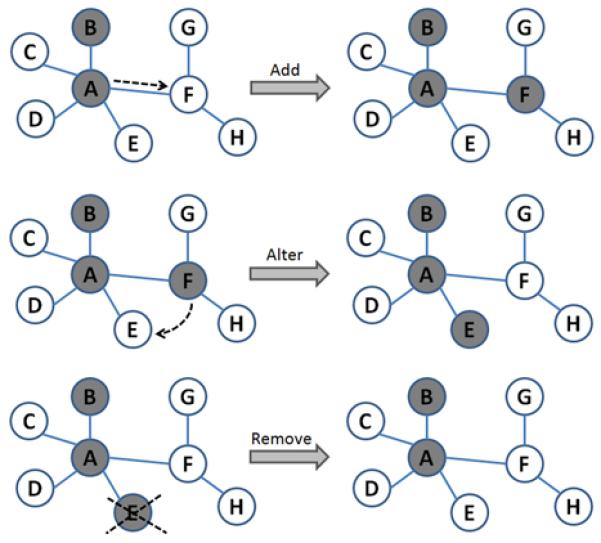
The “mutation” of a SNP group can occur in three ways, and is constrained by the structure of the gene interaction network. The nodes labeled A-F represent genes (each of which contain one or more SNPs, as shown in Fig. 1), and the edges represent some evidence for interaction between genes (e.g., physical interaction, correlated expression, etc.).
Two different hypotheses about the nature of the SNP groups were tested. Hypothesis 1 requires that all members of a SNP group be within a connect sub-network of genes (i.e., each gene must interact with at least one other gene in the group). Hypothesis 2 is the more general case and does not require that the genes be connected. Because Hypothesis 2 does not require that the network connections between genes be preserved, an additional genetic operator, the crossover function, can be used to introduce variation into the population of SNP groups. In this case, uniform crossover with a probability of 0.5 was used. This means that if two SNP groups were chosen for crossover (based on the specified crossover rate), the members of each group would be sorted and the two groups compared. Any non-matching members would then be swapped with a 50 % probability.
3 Results
3.1 Small-scale Searches
Evaluation of the algorithm was done in five steps. First, to test the performance of the algorithm and to determine the most appropriate parameter values for the task at hand, a number of small-scale searchers were performed, each with different parameter combinations. While not meant to be a formal evaluation of all aspects of the algorithm, several features of the algorithm’s behavior were demonstrated. (A quick note: we use the term “search” to mean a single execution of the algorithm, and the term “run” to mean a set of several searches all done with the same parameter values.)
Six different parameter combinations were tested for Hypothesis 1 and ten were tested for Hypothesis 2. For each parameter combination, five small-scale searches (200 generations) were performed and the results averaged. Various measures related to the effectiveness and efficiency of the search were recorded. Details on all the small-scale searches can be found in the Supplemental Materials.
Although the results vary significantly from one search to the next, certain trends were observed, which can inform the use of this approach. For instance, it is clear that a higher mutation rate produces a broader search (more SNP groups are tested). This, of course, is expected since mutation is the method by which new candidate solutions (new SNP groups) are created. The same result can be achieved by increasing the GA population size (Fig. 3). Furthermore, a larger population size, when paired with an elitist selection method (one that necessarily selects the groups with the highest fitness), allows the algorithm to reach a good solution more quickly than a smaller population size (Fig. 4). A larger population size increases the chance that good solutions (or potentially good solutions) are created in the early generations, and an elitist selection method ensures that those good candidates are carried on to the next generation. However, because of the tendency for the algorithm to become trapped in local minima, converging on a solution too quickly may be detrimental. This discussion about population size and early convergence will be revisited later.
Fig. 3.
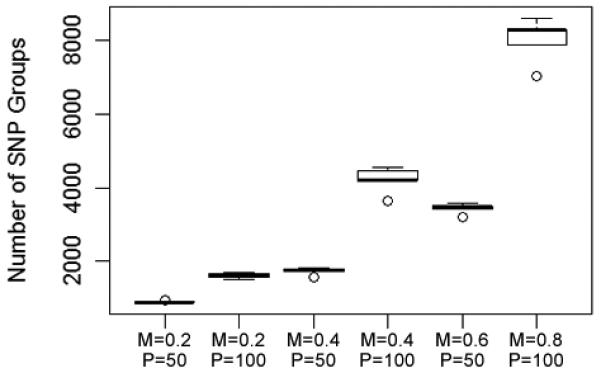
The number of SNP groups tested increases with GA population size and mutation rate. Each column shows the results of five searches done with the same parameters. M = mutation rate; P = population size. (Runs 1 through 6 in the Supplemental Materials)
Fig. 4.
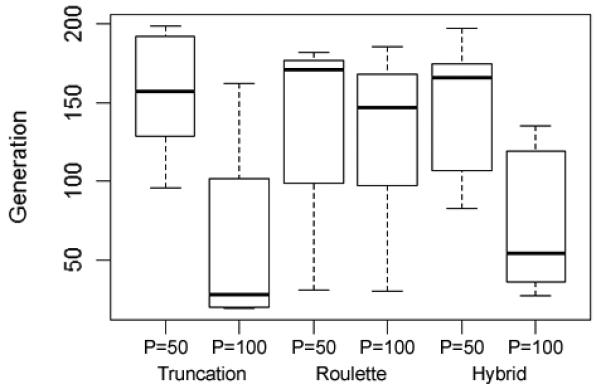
Larger population size, when paired with an elitist selection method, allows the algorithm to converge on good solutions more quickly. Here we show the generation at which the best solution was found. P = population size. (Runs 1 through 6 in the Supplemental Materials)
From the results of searches performed under Hypothesis 2, it appears the crossover rate had very little, if any, impact on performance. This suggests that exploring entirely new solutions created through mutation (and migration) is more important than recombining the current candidate solutions. But it is also clear that the impact of crossover depends on the selection method used and the rate at which new candidate solutions are introduced into the population (either through mutation or migration). However, a high crossover rate did not appear to have a negative effect, on solutions found or computation time (Fig. 5), and it may be that the benefits of crossover were simply too subtle to be noticed in these small-scale searches. Crossover, as an additional method of creating diversity among candidate solutions, should not be discounted based on the results so far.
Fig. 5.
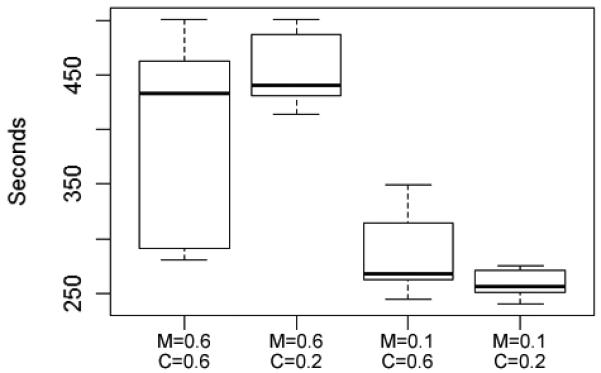
Algorithm run time was significantly impacted by the mutation rate, but NOT the crossover rate. M = mutation rate; C = crossover rate. (Runs 13 through 16 in the Supplemental Materials)
Results from the small-scale searches have revealed a number of important points about the behavior of the search algorithm. First, it’s clear that creating and maintaining diversity among the population of candidate solutions is essential. A fairly high mutation rate and the creation of a few entirely new candidate solutions (“migrants”) at each generation are important for broadening the search and discovering good solutions. Second, the Hybrid selection method appears to be the best choice. It ensures that a predefined number of “best” candidate solutions are passed on to the next generation, and it maintains diversity by allowing for probabilistic selection of the remaining candidate solutions. Third, population size should be chosen carefully. A larger population size broadens the search and may allow for quicker discovery of good solutions, but also increases computation time. In addition, good solutions found early in a search may not always be the best possible solutions.
3.2 Large-scale Searches
In the second stage of algorithm evaluation, larger-scale searches were performed with the most appropriate parameter combinations learned from the earlier small-scales searches. The goals here were to determine the number of generations needed to consistently find associations of genome-wide significance, to refine the algorithm parameters further, and to take a closer look at how thoroughly the algorithm is exploring the gene network.
The algorithm appears to have no problem exploring the vast majority of the gene interaction network. The large-scale searches visited between 85 and 99 percent of all genes in the network, and over 98 percent of all chromosome cytobands. However, the majority of the search space complexity is due to the fact that multiple SNPs map to each gene (approximately 17 SNPs per gene on average). Despite nearly all genes in the network being visited during a typical large-scale search, fewer than 25 percent of SNPs were ever included in a group and tested for association. So, while the search may be wide, its depth depends on how long the search is allowed to run. As seen so far, the algorithm may need many thousands of generations to adequately explore the search space.
Also, typical of GAs, the algorithm appears to be rather sensitive to starting conditions and therefore is somewhat inconsistent. While nearly all parameter combinations tested in this stage were able to find statistically significant multi-locus associations, the best solutions varied significantly from one search to the next (Fig. 6).
Fig. 6.
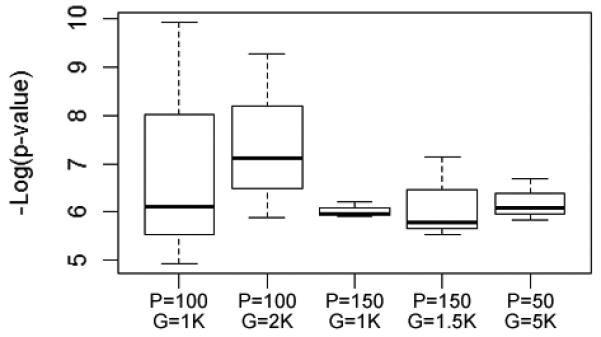
Results were inconsistent from one search to the next. Although differences in population size and run time didn’t significantly impact the results across runs, the best solution found varied significantly within runs. All runs shown here were carried out under Hypothesis 1. Each column shows the results of three searches. P = population size; G = number of generations the GA was allowed to run. (Runs 17 through 21 in the Supplemental Materials)
These larger-scale searches also shed more light on the impact of GA population size on the algorithm’s efficiency. And it appears that the impact may be different for Hypothesis 1 versus Hypothesis 2. When searching for connected sub-networks (Hypothesis 1) it seems that there is no benefit to increasing the population size beyond a certain point. Although searches with larger population sizes reached their best solutions more quickly, they were never able to reach solutions as good as some found with a moderate population size.
For Hypothesis 2, larger population size did appear to have some benefit. A larger search space (i.e., groups are not limited to connected sub-networks) and the addition of the crossover function as a source of variation in the population, may allow the algorithm to take advantage of a larger population size under Hypothesis 2.
Table 1 shows the parameter values that were found to be most successful in the large-scale searches.
TABLE 1. Genetic Algorithm Parameter Values.
| Hypothesis 1 | |
| Population Size | 100 |
| Mutation Rate | 0.6 – 0.8 |
| Crossover Rate | NA |
| Selection Method | Hybrid |
| No. of Migrants | 10 |
|
| |
| Hypothesis 2 | |
| Population Size | 100 – 152 a |
| Mutation Rate | 0.4 – 0.6 |
| Crossover Rate | 0.4 – 0.6 |
| Selection Method | Hybrid |
| No. of Migrants | 10 |
After testing a variety of parameter values in multiple small- and large-scale searches, these values produced the best results.
For Hypothesis 2 the population size must be a multiple of 4.
Next, in an effort to deal with the problem of inconsistency and to help improve the depth of the searches, two strategies were implemented. The first strategy was to run the algorithm for a longer time (10000 generations), while periodically (every 1000 generations) re-initializing the GA population. In essence a new search with new starting conditions is created every 1000 generations. The second strategy, similar to the first, was to re-initialize the population only when no improvement is seen in the previous 1000 generations. These searches were stopped if they reached a p-value < 5 × 10⁻¹⁰.
Nearly all the larger-scale searches were able to find multi-locus associations with genome-wide statistical significance. And the strategy of increasing the search time while periodically re-initializing the GA population, improved the results further (Fig. 7). Not only was it possible to find multi-locus associations, it was possible to do so while performing far fewer statistical tests than a standard GWAS. For instance, Run 30 (three separate searches, with a total of 470467 SNP groups tested) was able to find 54 multi-locus associations that are statistically significant even after Bonferroni correction (alpha = 1.063 × 10⁻⁷). Furthermore, nearly half of these associations (23 of 54) are interactions among three SNPs, which demonstrate the importance of looking for higher-order interactions. These results highlight an advantage of this approach over previous epistasis detection methods, which have mostly looked for interactions among pairs of SNPs.
Fig. 7.
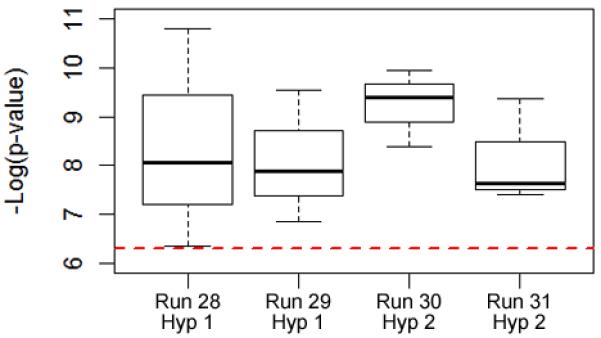
With a longer run time and periodic re-initialization of the GA population, the algorithm was able to consistently find solutions of genome-wide significance (p-values < 5 × 10⁻⁷; the dashed line). Runs 28 and 30 were re-initialized every 1000 generations; Runs 29 and 31 were re-initialized only when there was no improvement in the previous 1000 generations.
3.3 Simulated Data, Permutation Tests & Cross-validation
To examine whether the distribution of p-values found with the algorithm is different from what is expected by chance, large-scale searches were performed on two sets of simulated data, one simulated using MERLIN and another simulated with PLINK [20], [21]. MERLIN is able to simulate genotype data while maintaining the patterns of missing data and linkage disequilibrium found in the actual bipolar disorder dataset (TGen). The distribution of p-values found when searching the simulated datasets was compared to the distribution of p-values found when searching the actual data (Fig. 8). Clearly, the search performed on the actual bipolar disorder data discovered an excess of SNP groups with p-values smaller than 10−7. Very similar results were seen with the data simulated in PLINK (data not shown).
Fig. 8.
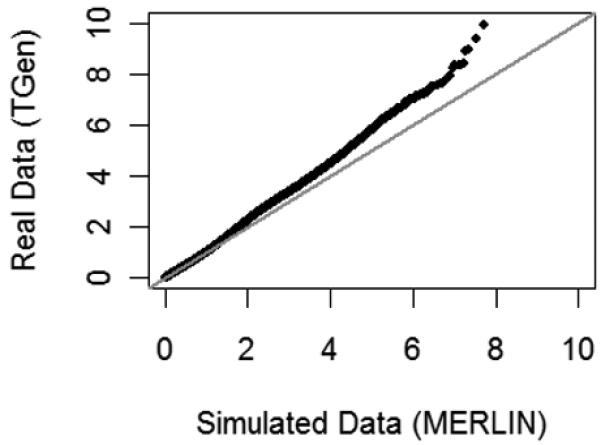
A quantile-quantile plot of the log scale p-values from a large-scale search for multi-locus associations among the actual bipolar disorder GWAS data versus data simulated with MERLIN. The simulated data was created so that no markers are associated with the disease. Also, patterns of missing data and linkage disequilibrium were simulated to match those of the real data.
In addition, large-scale searches were performed on 10 different permutations of the data (case and control labels were randomly assigned, while maintaining the same number of samples in each group as in the original data set). Again, we found that p-values smaller than approximately 10−7 were detected more frequently in the original data than in the permuted data (Fig. 9). Furthermore, the most significant associations discovered in the original data set have p-values smaller than any detected in the permuted data sets or the simulated null data set (Fig. 10).
Fig. 9.
A quantile-quantile plot of the log scale p-values from a large-scale search for multi-locus associations among the actual bipolar disorder GWAS data, versus p-values from searches of the permuted data.
Fig. 10.
A summary of the p-values of the most significant associations detected in searches of the original data set (Run 30), the ten permuted data sets, and the simulated data set.
In an attempt to provide statistical validation for the most significant multi-locus associations, we created 10 non-overlapping partitions (subsets) of the original data set and tested the associations in each subset. Multi-locus associations with p-values < 5.5 × 10⁻⁸ were significantly more likely to be nominally significant (p-value < 0.05) in the subsets than randomly selected multi-locus associations with larger p-values, ranging between 0.00057 and 0.021 (two sample t-test p-value = 0.003). In addition, the most significant multi-locus associations had a significantly smaller median p-value across all 10 subsets than the group of randomly selected associations with less significant p-values (t-test p-value = 0.002).
3.4 Single-locus Analysis & Location Analysis
A single-locus analysis revealed only two SNPs that show a significant association with the BPI group (p-values of 2.70×10⁻⁹ and 1.97×10⁻⁷). Nevertheless, numerous multi-locus associations were found during the large-scale searches described in the previous section. To better understand the types of associations discovered, all statistically significant associations found during the most successful runs (Runs 28 - 31) were categorized in two ways. “Significant Interactions” were those where the joint p-value is smaller than all of the group members’ individual p-values. And SNP groups were said to be “Absent of Main Effects” if none of the group members had an individual p-value that reached genome-wide significance (p-value < 5 × 10⁻⁷) (Table 2).
TABLE 2. Types of Associations Detected.
| Run | Significant Groups |
Significant Interactions |
Absent of Main Effects |
|---|---|---|---|
| 28 | 37 | 26 | 16 |
| 29 | 73 | 9 | 8 |
| 30 | 169 | 88 | 84 |
| 31 | 82 | 59 | 57 |
The algorithm is able to detect multi-locus associations both with and without main effects. It appears that the algorithm is more successful under Hypothesis 2 (Runs 30 and 31). Each run represents the combined results of three individual searches.
The algorithm was able to find statistically significant multi-locus associations, both with main effects and with-out (pure interactions), under Hypothesis 1 and 2. However, it appears that finding pure interactions is more difficult under Hypothesis 1. This is not surprising, given that Hypothesis 1 requires that a SNP group be part of a connected sub-network, which limits the number of possible gene combinations.
Given the nature of the search algorithm there was some concern that the search may become focused on a small area of the gene network, and therefore a small area of the genome. To determine the distribution of these significant associations across the genome, the number of chromosomes, cytobands, genes, and SNPs present in the SNP groups were counted (Table 3). It’s clear that these multi-locus associations are made up of genes spread widely across the genome. For instance, in Run 30, three searches detected 169 significant associations that contained 164 different genes (174 SNPs) from 23 chromosomes.
TABLE 3. Location Analysis of Top Associations.
| Run | Sig. Groups |
Chrs. | Cytobands | Genes | SNPs |
|---|---|---|---|---|---|
| 28 | 37 | 19 | 37 | 39 | 51 |
| 29 | 73 | 19 | 37 | 40 | 76 |
| 30 | 169 | 23 | 119 | 164 | 174 |
| 31 | 82 | 22 | 77 | 95 | 94 |
The most significant multi-locus associations contain SNPs that are spread across the entire genome. However, it appears that many of the SNP groups found during a single search are dominated by one or two SNPs that appear in multiple groups (Fig. 11).
However, it is sometimes the case that a few SNPs dominate the most significant SNP groups. For instance, consider the situation where a SNP with a very strong main effect is directly connected to ten other SNPs in the interaction network. It is possible that the algorithm will report all ten of these SNP pairs (the one strongly associated SNP paired with each of its neighbors) as significant multi-locus associations (Fig. 11). While the algorithm presented here is a good first step in the search for multi-locus associations, it is obvious that the SNP groups found will have to be scrutinized before being considered for any further study. Following best practices for the analysis of GWAS data, we manually examined the cluster plots of SNPs in the most significant multi-locus associations. No anomalies were detected that would render the SNPs and corresponding associations as suspect (data not shown).
Fig. 11.
Some SNPs are found in multiple significant SNP groups. Here the columns represent each of the SNPs that were members of significant multi-locus associations found in the three searches of Run 28. In the first search (blue) there is one SNP that is involved in nearly all of the multi-locus associations (20 out of 23 SNP groups).
3.5 Prioritizing Genes in the Network
Although the results shown so far are promising, it’s clear that the enormity of the search space poses a considerable challenge. One technique that may increase the chances of discovery is to assign scores to genes in the interaction network. Those genes with the highest scores (i.e., those thought to be involved in the disease of interest), and the SNPs located in or near them, will be preferentially chosen by the algorithm. While this method may help to focus the search on the most promising genes, it does not reduce the search space outright.
All searches done so far in this study were done with a uniform distribution of gene scores (i.e., all genes had a score of 1). In this stage of the algorithm evaluation, various types of evidence (linkage studies, association studies, gene expression studies, gene functions, and network connectivity [22], [23]) will be used to score the genes in the network. Points were assigned based on the strength of the evidence for involvement in the disease (e.g., the number of studies that have reported a particular finding). For each evidence type, genes with weak evidence were assigned 50 points; those with a moderate amount of evidence were assigned 100 points, and so on. For example, if GeneA has been implicated by two previous linkage studies and is also associated with a single Gene Ontology term that is relevant to bipolar disorder, its linkage score will be 50 and its function score will be 50. GeneA’s cumulative score will be 100. References for all the studies used as evidence are listed in the Supplemental Materials, along with details about the methods used to assign scores to genes.
The distribution of gene scores in the network follows an exponential distribution. Of the 12793 genes in the network, over half (6444 genes) are not thought to be involved in bipolar disorder; 3643 genes have a score of 100 or greater (meaning they were implicated by more than two studies of the same type, or by two or more different types of evidence); and only 45 genes have a score of 300 or greater.
The genetics of bipolar disorder have been studied extensively, so there is a great deal of information about the genes and cellular processes that are hypothesized to play a role in the disease. But it is very difficult to say that what works in the case of bipolar disorder will also work for other diseases (or even other datasets). Here we will simply point out some examples that show the potential value of integrating prior knowledge about the disease when searching for multi-locus associations.
Three searches (3000 generations each) were performed for each evidence type alone, and another three searches were done with all evidence cumulatively (i.e., the scores from all evidence types were added together). P-values from the most significant multi-locus associations detected during these searches are shown in Fig. 12. It’s difficult to make definitive conclusions from just a few searches, but it appears that linkage studies and gene association studies were helpful in guiding the search. The other evidence types were not helpful, and may actually have been detrimental.
Fig. 12.
Not all evidence types were useful for guiding the search. Here we show the results from the searches done after gene prioritization. Each column represents the results from three searches. L = linkage studies; G = gene association studies; D = differential expression; F = gene functions (GO terms); N = network connectivity (hubs); C = cumulative (all evidence types).
When linkage regions previously associated with bipolar disorder were used to assign gene scores, the algorithm consistently found associations of genome-wide significance within 650 generations. Furthermore, of the 258 SNPs that were part of all significant multi-locus associations discovered, 155 (60 %) lie within the linkage regions previously associated with the disease.
When gene scores were based on previous implication in an association study, one search found a multi-locus association with the second smallest p-value (3.4 × 10⁻¹¹) found among all the searches performed so far. This association contained one SNP with a main effect and another that is directly connected in the network to a gene (BDNF) that has been previously implicated in two association studies of bipolar disorder (see Supplemental Materials).
To determine whether or not the gene scores were actually influencing the searches, gene scores from the top hits were compared between the searches done with the cumulative genes scores and Runs 30 and 31, which were done before gene prioritization. For the SNPs from the top hits found with the cumulative gene scores, 86 % were in genes with a cumulative score of 100 or greater (moderate evidence of involvement with bipolar disorder). When gene scores were not used (Runs 30 and 31), only 39 % and 44 % of top-hit SNPs, respectively, were in genes with cumulative scores of 100 or greater. These results suggest that using a scoring method to prioritize the genes in the interaction network may truly be able to improve the algorithm’s efficiency by focusing the search on a set of particularly promising genes.
3.6 The GA vs. Random Search
In the final stage of the algorithm evaluation an attempt was made to show the computational benefit gained from using the genetic algorithm. This was done by comparing the results achieved when searching the network using the GA versus the results achieved when using a purely random search (i.e., at each generation SNP groups were chosen randomly, without any information from previous generations). Three searches using the GA and three random searches were performed. All searches were allowed to run for 10,000 generations, but were stopped early if a p-value of 5 × 10⁻¹⁰ was reached.
It’s clear that the GA was much more efficient in finding SNP groups with small p-values compared to the purely random search. Although the random search was able to find SNP groups with p-values less than 5×10⁻¹⁰, the GA was able to find many more good solutions while performing far fewer statistical tests (Table 4), offering an advantage with regard to computing time and multiple testing in a discovery framework.
TABLE 4. Genetic Algorithm vs. Random Search.
| Search Type | Total SNP Groups Tested |
Sig. SNP Groups (p-val < 5 × 10⁻⁷) |
|---|---|---|
| GA | 470467 | 168 |
| Random Search | 1988215 | 43 |
The GA was able to detect four times as many significant multi-locus associations, while performing four times fewer tests, compared to a purely random search. The numbers shown are the combined results of three searches.
4 Discussion & Conclusions
Detection of multi-locus associations is becoming an important way to extend the amount of information gained from a GWAS. While the method we have presented shows promise, this is an area of research that remains relatively unexplored, and there are a number of challenges that still need to be addressed.
Determining the threshold for statistical significance has always been a major issue in genomic studies, and this is especially true when dealing with multi-locus associations. In 1995, Lander and Kruglyak provided an important summary of the statistical issues relevant to genetic studies of complex traits. And while their discussion was aimed specifically at genome-wide linkage analyses, their arguments are directly applicable to GWAS. Following Lander and Kruglyak’s description of a linkage study, the process of a genome-wide association study can be demonstrated by three fairly simple steps: 1) perform a scan of a large number of SNPs across the entire genome, 2) calculate an appropriate measure of association at each SNP position, and 3) identify SNPs with association measures that deviate substantially from the null hypothesis of no association. However simple these three steps appear, the crucial question remains: since the measure of association “fluctuates substantially just by chance across an entire genome scan, what constitutes a ‘significant’ deviation?” As Lander and Kruglyak explain, it’s clear that the true significance (or importance) of any particular measure of association, say a p-value of 5 × 10⁻⁷, depends on how often such a p-value occurs by chance across the entire genome [24].
By convention, a false-positive rate of 5 % is considered acceptable, and is often used in biological and epidemiological research. When multiple statistical tests are performed on the same data set, the probability of a false-positive test result occurring increases, and the threshold for statistical significance must be adjusted accordingly. For instance, in the case of a GWAS where 106 SNPs are tested for association, a significance level of 5 × 10⁻⁸ will provide the same 5 % probability of a false positive occurring in the analysis (i.e., the 5 × 10⁻⁸ threshold provides a 95 % probability that no false-positive results will occur in the entire analysis) [25].
Because of the varying number of SNPs analyzed in GWAS, the conventional thresholds used have ranged between 10−5 and 10−8, with the more stringent significance levels being more common. As Lander and Kruglyak pointed out in 1995, the selection of a standard threshold for statistical significance would have important consequences for a relatively young area of research. Too lax a threshold would flood the field with false-positive results, and would have a negative impact on the credibility of these types of studies. Too strict a threshold would cause initial studies to fail to produce meaningful results, and might inhibit progress in the field. However, thanks to improvements in technology over the past decade, GWAS are being conducted routinely, and hundreds, if not thousands, of genetic associations have been reported in the literature. We now have the opportunity to examine the overall outcome of the application of these theoretical thresholds for statistical significance. Has the application of the standard threshold produced a high proportion of replicable results, or has it led to the reporting of large numbers of false-positive associations?
The Human Genome Research Institute maintains a database of all published large-scale GWAS, which includes 42 diseases (or traits) that have been examined by five or more studies [1]. In an attempt to estimate the probability of replication for genetic associations at various levels of statistical significance, 5 of the 42 well studied diseases/traits were chosen randomly (breast cancer, Crohn’s disease, Parkinson’s disease, LDL cholesterol, and smoking behavior). For each disease, the proportion of gene associations (at various significance levels) that were reported in at least two studies was recorded, and the results were averaged across the five diseases (Fig. 13).
Fig. 13.
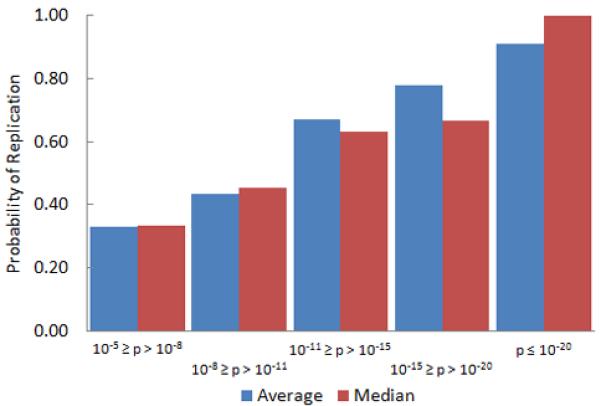
The probability of a genetic association being reported in two or more studies increases with the statistical significance of the association.
As expected, the likelihood of replication increases with smaller and smaller p-values. However, it is interesting to note that for associations with p-values near what is considered the standard threshold for statistical significance (between 10−5 and 10−11), the probability of being reported in two or more studies is less than 50 %. In fact, it appears that a p-value smaller than 10−15 may be required for there to be a high level of confidence in an association.
The question remains whether or not the significance threshold used for single-SNP associations is appropriate for studies looking for multi-locus associations (SNP interactions). There are two things that make the search for multi-locus associations different from the standard GWAS: 1) the enormous amount of combinatorial complexity, especially when looking for higher-order SNP interactions (i.e., interactions among groups of more than two SNPs), means that the number of possible statistical tests is increased substantially, and 2) the high level of correlation among statistical tests due to that fact that many SNP groups will have individual members in common. The first observation suggests that the threshold for statistical significance may need to be more stringent for multi-locus associations than for single SNP associations, simply due to the increased number of statistical tests. However, because the tests are not independent, it may not be necessary to adjust the significance threshold for all possible SNP combinations. Emily and colleagues calculated a “number of effective tests”, which takes into account the correlation among SNP groups [17]. Although they tested approximately 3000000 SNP pairs for association in the WTCCC data set, they concluded that the effective number of tests ranged from 506173 to 600010 across the seven diseases in the data set, which correspond to significance thresholds very similar to those used in a standard GWAS (between 8.3 × 10⁻⁸ and 9.9 × 10⁻⁸).
It is difficult to estimate the null distribution of p-values—those expected to occur by chance—when searching for multi-locus associations. And while we do not propose to report any disease-specific association found in our data set as significant, we have presented results from a number of different methods for assessing the statistical significance of multi-locus associations—using simulated genotype data, permutation tests, and cross-validation. But all of these methods have limitations, and it is clear this is an issue that will need to be addressed further. Others have suggested the use of permutation tests for addressing the huge multiple-testing problem of large-scale GWAS [26]. However, the computational burden of permuting large data sets (i.e., randomly assigning case/control labels) and performing multilocus association analyses for each permutation is very heavy. Still, this type of analysis may have benefits over the use of idealized simulated data. Cross-validation, or sample splitting methods, have also been used in similar applications [3], and may provide further evidence to help determine an appropriate threshold for statistical significance in multi-locus association studies.
One question that is particularly difficult to answer is whether or not it is possible to find interactions among SNPs that are not at least weakly associated individually. Our study did not directly address this issue, but because our algorithm searches for epistasis without taking into account the effects of individual SNPs beforehand, it has the potential to provide important insight into this question. This is an issue we aim to address in the future, and others have begun to bring attention to this question as well. A recent eQTL study suggests that SNPs with marginally significant main effects are more likely to be involved in epistasis, even though the majority of interacting SNPs did not have main effects [27].
Although not many studies have done full-scale, genome-wide searches for multi-locus associations, it appears that the significance thresholds used so far for reporting multi-locus associations have not been substantially different than those used for single-SNP associations [17, 24]. But, interactions among SNPs are becoming an area of focus for researchers exploring the genetic component of complex diseases, and it is only a matter of time before these types of studies become commonplace. The more data sets that are explored in this way, and the more focus placed on statistical methods for epistasis detection, the better prepared we will be to interpret the significance of the results.
Beyond the question of statistical significance, the search for multi-locus associations also presents a considerable computational challenge, particularly when looking for higher-order interactions among SNPs. As seen from the results presented, one of the limitations of using a genetic algorithm to search for multi-locus associations is the inconsistency of the results. While the algorithm may be able to consistently find good solutions (i.e., SNP groups with small p-values), the solutions may differ from one search to the next. This is not surprising given the nature of the GA and the enormity of the search space. As a hypothesis generating and discovery technique the GA is clearly successful.
Moreover, we have suggested a number of ways to increase the consistency and thoroughness of the algorithm. For example, assigning scores to the genes in the network may be able to focus the search on a set of particularly promising genes. And allowing the algorithm to run for an extended period of time will undoubtedly make for a more thorough search.
In addition, the incorporation of uncertainty in the supporting data types with regard to network inference and guiding the search should also improve the results. However, at this time, a limitation to this approach is the availability of the appropriate meta-data, data lineage and raw data to make useful estimates of uncertainty.
The main advantage of the method presented here is its flexibility. The algorithm is able to search for multilocus associations within a full-scale GWAS dataset, and can search for interactions among any number of SNPs (of course the size of the SNP group is limited by the study sample size, since large SNP groups will result in very sparse contingency tables). And testing different genetic models or hypotheses is merely a matter of changing the fitness function within the GA. For instance, rather than looking for interactions between SNPs, one could easily look at the additive risk of multiple alleles similar to the analysis done by Baum and colleagues [28].
We have shown that our algorithm is able to discover significant multi-locus associations, even among SNPs that are not strongly associated with the disease. There has been some controversy about the idea of gene interactions without main effects, but our results and others [9] suggest the possibility of such interactions should not be ignored. This is true for the simple fact that any threshold used to define a significant main effect is arbitrary, and using such a threshold necessarily excludes any interactions that may be found among SNPs with a weak but real association with the disease. Furthermore, we have provided guidelines with regard to the behavior of the algorithm to assist others in implementing this approach.
There are numerous ways that the genetic algorithm we have described can be adapted to fit the needs of researchers interested in similar problems. And when used in conjunction with new statistical methods, such as the calculation of “number of effective tests” presented by Emily and colleagues [17], it has the potential to extract a great deal of information from the wealth of large-scale GWAS data already available.
Supplementary Material
Acknowledgment
The authors wish to thank Dr. Kemal Sonmez and Dr. Thomas Barrett for helpful comments and suggestions about the work, Ping-Hsun Hsieh for data preprocessing, and Dr. John Kelsoe for allowing access to the data. This project was supported in part by a training grant from the National Library of Medicine (5T15LM007088), and by the Oregon Tax Check-Off Alzheimer’s Research Fund administered by the Layton Aging & Alzheimer’s Disease Center in collaboration with the Oregon Partnership for Alzheimer’s Research. We also wish to extend our appreciation to the editor and reviewers for their thoughtful comments.
Data and biomaterials were collected in four projects that participated in the NIMH Bipolar Disorder Genetics Initiative. From 1991-98, the Principal Investigators and Co-Investigators were: Indiana University, Indianapolis, IN, U01 MH46282, John Nurnberger, M.D., Ph.D., Marvin Miller, M.D., and Elizabeth Bowman, M.D.; Washington University, St. Louis, MO, U01 MH46280, Theodore Reich, M.D., Allison Goate, Ph.D., and John Rice, Ph.D.; Johns Hopkins University, Baltimore, MD U01 MH46274, J. Raymond DePaulo, Jr., M.D., Sylvia Simpson, M.D., MPH, and Colin Stine, Ph.D.; NIMH Intramural Research Program, Clinical Neurogenetics Branch, Bethesda, MD, Elliot Gershon, M.D., Diane Kazuba, B.A., and Elizabeth Maxwell, M.S.W.
Data and biomaterials were collected in ten projects that participated in the NIMH Bipolar Disorder Genetics Initiative. From 1999-07, the Principal Investigators and Co-Investigators were: Indiana University, Indianapolis, IN, R01 MH59545, John Nurnberger, M.D., Ph.D., Marvin J. Miller, M.D., Elizabeth S. Bowman, M.D., N. Leela Rau, M.D., P. Ryan Moe, M.D., Nalini Samavedy, M.D., Rif El-Mallakh, M.D. (at University of Louisville), Husseini Manji, M.D. (at Wayne State University), Debra A. Glitz, M.D. (at Wayne State University), Eric T. Meyer, M.S., Carrie Smiley, R.N., Tatiana Foroud, Ph.D., Leah Flury, M.S., Danielle M. Dick, Ph.D., Howard J. Edenberg, Ph.D.; Washington University, St. Louis, MO, R01 MH059534, John Rice, Ph.D., Theodore Reich, M.D., Allison Goate, Ph.D., Laura Bierut, M.D.; Johns Hopkins University, Baltimore, MD, R01 MH59533, Melvin McInnis M.D. , J. Raymond DePaulo, Jr., M.D., Dean F. MacKinnon, M.D., Francis M. Mondimore, M.D., James B. Potash, M.D., Peter P. Zandi, Ph.D., Dimitrios Avramopoulos, and Jennifer Payne; University of Pennsylvania, PA, R01 MH59553, Wade Berrettini M.D., Ph.D.; University of California at Irvine, CA, R01 MH60068, William Byerley M.D., and Mark Vawter M.D.; University of Iowa, IA, R01 MH059548, William Coryell M.D., and Raymond Crowe M.D.; University of Chicago, IL, R01 MH59535, Elliot Gershon, M.D., Judith Badner Ph.D., Francis McMahon M.D. , Chunyu Liu Ph.D., Alan Sanders M.D., Maria Caserta, Steven Dinwiddie M.D., Tu Nguyen, Donna Harakal; University of California at San Diego, CA, R01 MH59567, John Kelsoe, M.D., Rebecca McKinney, B.A.; Rush University, IL, R01 MH059556, William Scheftner M.D., Howard M. Kravitz, D.O., M.P.H., Diana Marta, B.S., Annette Vaughn-Brown, MSN, RN, and Laurie Bederow, MA; NIMH Intramural Research Program, Bethesda, MD, 1Z01MH002810-01, Francis J. McMahon, M.D., Layla Kassem, Psy.D., Sevilla Detera-Wadleigh, Ph.D., Lisa Austin, Ph.D., Dennis L. Murphy, M.D.
Data and biomaterials from the NIMH GI (Genetics Initiative) MGS2 (Molecular Genetics of Schizophrenia) control sample were collected by NorthShore University HealthSystem, Evanston, IL, R01 MH59571, Pablo V. Gejman, M.D. (Collaboration Coordinator; PI) as part of a collaborative R01 application comprised of ten sites. From 2003-2006, the Principal Investigators and Co-Investigators were: NorthShore University HealthSystem, Evanston, IL, R01 MH59571, Pablo V. Gejman, M.D. (Collaboration Coordinator; PI), Alan R. Sanders, M.D.; Emory University School of Medicine, Atlanta, GA, R01 MH59587, Farooq Amin, M.D. (PI); University of California, San Francisco, CA, R01 MH60870, William F. Byerley, M.D. (PI); University of Iowa, Iowa, IA, R01 MH59566, Donald W. Black, M.D. (PI), Raymond R. Crowe, M.D.; Washington University, St. Louis, MO, R01 MH60879, C. Robert Cloninger, M.D. (PI); University of Colorado, Denver, CO, R01 MH59565, Robert Freedman, M.D. (PI), Ann Olincy, M.D.; Stanford University, Palo Alto, CA, R01 MH61675, Douglas F. Levinson, M.D. (PI); Louisiana State University, New Orleans, LA, R01 MH67257, Nancy G. Buccola, APRN, BC, MSN (PI); University of Queensland, Brisbane, Queensland, Australia, R01 MH59588, Bryan J. Mowry, M.D. (PI); Mt. Sinai School of Medicine, New York, NY, R01 MH59586, Jeremy M. Silverman, Ph.D. (PI).
Biographies
Michael A. Mooney received the BS degree from the University of California, Los Angeles, the MA degree from New York University, and the PhD degree in bioinformatics and computational biology from Oregon Health & Science University, where he was a National Library of Medicine Fellow. Dr. Mooney is currently a postdoctoral researcher in the Knight Cancer Institute at OHSU. His research is focused on the development of statistical and computational techniques for analyzing high-throughput genomic data with the purpose of discovering risk factors for common, complex diseases.
Beth Wilmot has a PhD in Quantitative Genetics and a MS in Health Evaluation Sciences. She completed her postdoctoral training in statistical genetics at OHSU. Dr. Wilmot is a staff scientist in the Translational Bioinformatics Program and the Biostatistics and Design Program within the Oregon Clinical and Translational Institute and an Instructor in the Division of Bioinformatics and Computational Biology in the Department of Medical Informatics and Clinical Epidemiology at OHSU. The focus of her research is on the development and application of statistical and computational methodologies for analysis of genomic data (gene expression, SNP variation and copy number variation) in both unrelated individuals and pedigrees in order to understand the role of genomic variation in disease (cancer, psychiatric disorders, Alzheimer’s disease, etc). Her expertise and experience in diverse methodologies for analysis of complex traits make her well qualified for her role on this project.
Shannon K. McWeeney is an Associate Professor of Biostatistics and Bioinformatics in the Department of Public Health and Preventive Medicine’s division of Biostatistics at Oregon Health and Science University (OHSU). She has a joint appointment in the Department of Medical Informatics and Clinical Epidemiology (DMICE), where she serves as Interim Division Head for the Division of Bioinformatics and Computational Biology. Dr. McWeeney has a PhD in Statistical Genetics and a MSE in Computational Biology. She completed a postdoctoral fellowship at the Center for Bioinformatics at the University of Pennsylvania. At OHSU, Dr. McWeeney serves as the Director of Bioinformatics for the OHSU Knight Cancer Institute and the Director of Translational Bioinformatics for the Oregon Clinical and Translational Research Institute (OCTRI). The focus of her research is on the development and application of statistical and computational methodologies for analysis and integration of functional genomics (microarray, proteomics, chip-seq) data for network reconstruction with emphasis on understanding transcriptional regulation as it relates to disease etiology (cancer, alcoholism, Alzheimer’s disease, etc).
Footnotes
Appendix
Sup-1: Parameter Combinations for Algorithm Evaluation
Sup-2: Summaries of Results for All Algorithm Runs
Sup-3: Details about Gene Prioritization
Contributor Information
Michael A. Mooney, Department of Medical Informatics & Clinical Epidemiology, Oregon Health & Science University, Portland, OR 97239., mooneymi@ohsu.edu
Beth Wilmot, Oregon Clinical & Translational Research Institute and the Department of Medical Informatics & Clinical Epidemiology, Oregon Health & Science Univeristy, Portland, OR 97239., wilmotb@ohsu.edu.
Bipolar Genome Study, Directed by John Kelsoe at the University of California, San Diego, La Jolla, CA 92093., jkelsoe@ucsd.edu.
Shannon K. McWeeney, Division of Bioinformatics and Computational Biology, Department of Medical Informatics & Clinical Epidemiology; the OCTRI Translational Bioinformatics Program; and the OHSU Knight Cancer Institute, Oregon Health & Science University, Portland, OR 97239., mcweeney@ohsu.edu
REFERENCES
- [1].Hindorff LA, Junkins HA, Mehta JP, Manolio TA. [Accessed April, 2011];A Catalog of Published Genome-Wide Association Studies. Available at: www.genome.gov/gwastudies.
- [2].Nunkesser R, Bernholt T, Schwender H, Ickstadt K, Wegener I. Detecting high-order interactions of single nucleotide polymorphisms using genetic programming. Bioinformatics. 2007 Dec 15;23(24):3280–8. doi: 10.1093/bioinformatics/btm522. [DOI] [PubMed] [Google Scholar]
- [3].Gayán J, González-Pérez A, Bermudo F, Sáez ME, Royo JL, Quintas A, Galan JJ, Morón FJ, Ramirez-Lorca R, Real LM, Ruiz A. A method for detecting epistasis in genome-wide studies using case-control multi-locus association analysis. BMC Genomics. 2008 Jul 31;9:360. doi: 10.1186/1471-2164-9-360. [DOI] [PMC free article] [PubMed] [Google Scholar]
- [4].Zhang X, Huang S, Zou F, Wang W. TEAM: efficient two-locus epistasis tests in human genome-wide association study. Bioinformatics. 2010 Jun 15;26(12):i217–i227. doi: 10.1093/bioinformatics/btq186. [DOI] [PMC free article] [PubMed] [Google Scholar]
- [5].Moore JH, White BC. Genome-wide Genetic Analysis Using Genetic Programming: The Critical Need for Expert Knowledge. In: Riolo R, Soule T, Worzel B, editors. Genetic Programming Theory and Practice IV. Springer; New York: 2007. pp. 11–28. [Google Scholar]
- [6].Ruczinski I, Kooperberg C, LeBlanc ML. Exploring interactions in high-dimensional genomic data: an overview of Logic Regression, with applications. Journal of Multivariate Analysis. 2004 Jul;90(1):178–195. [Google Scholar]
- [7].Congdon CB, Sing CF, Reilly SL. Genetic algorithms for identifying combinations of genes and other risk factors associated with coronary artery disease; Proc. Workshop on Artificial Intelligence and the Genome.Aug, 1993. pp. 107–117. [Google Scholar]
- [8].Carlborg O, Andersson L, Kinghorn B. The use of a genetic algorithm for simultaneous mapping of multiple interacting quantitative trait loci. Genetics. 2000 Aug;155(4):2003–10. doi: 10.1093/genetics/155.4.2003. [DOI] [PMC free article] [PubMed] [Google Scholar]
- [9].Musani SK, Shriner D, Liu N, Feng R, Coffey CS, Yi N, Tiwari HK, Allison DB. Detection of gene × gene interactions in genome-wide association studies of human population data. Hum Hered. 2007;63(2):67–84. doi: 10.1159/000099179. [DOI] [PubMed] [Google Scholar]
- [10].Moore JH, Asselbergs FW, Williams SM. Bioinformatics Challenges for Genome-wide Association Studies. Bioinformatics. 2010;26(4):445–55. doi: 10.1093/bioinformatics/btp713. [DOI] [PMC free article] [PubMed] [Google Scholar]
- [11].Holland JH. Adaptation in Natural and Artificial Systems. 2nd Edition MIT Press; 1992. [Google Scholar]
- [12].Forrest S. Genetic algorithms: principles of natural selection applied to computation. Science. 1993 Aug 13;261(5123):872–8. doi: 10.1126/science.8346439. [DOI] [PubMed] [Google Scholar]
- [13].Man KF, Tang KS, Kwong S. Genetic algorithms: concepts and applications [in engineering design] IEEE Transactions on Industrial Electronics. 1996 Oct;43(5):519–534. [Google Scholar]
- [14].van Batenburg FH, Gultyaev AP, Pleij CW. An APL-programmed genetic algorithm for the prediction of RNA secondary structure. J Theor Biol. 1995;174(3):269–280. doi: 10.1006/jtbi.1995.0098. [DOI] [PubMed] [Google Scholar]
- [15].Smith EN, Koller DL, Panganiban C, Szelinger S, Zhang P, Badner JA, Barrett TB, Berrettini WH, Bloss CS, Byerley W, Coryell W, Edenberg HJ, Foroud T, Gershon ES, Greenwood TA, Guo Y, Hipolito M, Keating BJ, Lawson WB, Liu C, Mahon PB, McInnis MG, McMahon FJ, McKinney R, Murray SS, Nievergelt CM, Nurnberger JI, Jr, Nwulia EA, Potash JB, Rice J, Schulze TG, Scheftner WA, Shilling PD, Zandi PP, Zöllner S, Craig DW, Schork NJ, Kelsoe JR. Genome-wide association of bipolar disorder suggests an enrichment of replicable associations in regions near genes. PLoS Genetics. 2011 Jun;7(6):e1002134. doi: 10.1371/journal.pgen.1002134. [DOI] [PMC free article] [PubMed] [Google Scholar]
- [16].Carvalho B, Bengtsson H, Speed TP, Irizarry RA. Exploration, normalization, and genotype calls of high-density oligonucleotide SNP array data. Biostatistics. 2007 Apr;8(2):485–99. doi: 10.1093/biostatistics/kxl042. [DOI] [PubMed] [Google Scholar]
- [17].Emily M, Mailund T, Hein J, Schauser L, Schierup MH. Using biological networks to search for interacting loci in genome-wide association studies. Eur J Hum Genet. 2009 Oct;17(10):1231–40. doi: 10.1038/ejhg.2009.15. [DOI] [PMC free article] [PubMed] [Google Scholar]
- [18].Jensen LJ, Kuhn M, Stark M, Chaffron S, Creevey C, Muller J, Doerks T, Julien P, Roth A, Simonovic M, Bork P, von Mering C. STRING 8--a global view on proteins and their functional interactions in 630 organisms. Nucleic Acids Res. 2009 Jan;37:D412–6. doi: 10.1093/nar/gkn760. Database issue. [DOI] [PMC free article] [PubMed] [Google Scholar]
- [19].Hubbard TJP, Aken BL, Ayling S, Ballester B, Beal K, Bragin E, Brent S, Chen Y, Clapham P, Clarke L, Coates G, Fairley S, Fitzgerald S, Fernandez-Banet J, Gordon L, Gräf S, Haider S, Hammond M, Holland R, Howe K, Jenkinson A, Johnson N, Kähäri A, Keefe D, Keenan S, Kinsella R, Kokocinski F, Kulesha E, Lawson D, Longden I, Megy K, Meidl P, Overduin B, Parker A, Pritchard B, Rios D, Schuster M, Slater G, Smedley D, Spooner W, Spudich G, Trevanion S, Vilella A, Vogel J, White S, Wilder S, Zadissa A, Birney E, Cunningham F, Curwen V, Durbin R, Fernandez-Suarez XM, Herrero J, Kasprzyk A, Proctor G, Smith J, Searle S, Flicek P. Ensembl 2009. Nucleic Acids Research. 2009;37:D690–7. doi: 10.1093/nar/gkn828. Database issue. [DOI] [PMC free article] [PubMed] [Google Scholar]
- [20].Abecasis GR, Cherny SS, Cookson WO, Cardon LR. Merlin-rapid analysis of dense genetic maps using sparse gene flow trees. Nat Genet. 2002 Jan;30(1):97–101. doi: 10.1038/ng786. [DOI] [PubMed] [Google Scholar]
- [21].Purcell S, Neale B, Todd-Brown K, Thomas L, Ferreira MAR, Bender D, Maller J, Sklar P, de Bakker PIW, Daly MJ, Sham PC. PLINK: a toolset for whole-genome association and populationbased linkage analysis. Am J Hum Genet. 2007 Sep;81(3):559–75. doi: 10.1086/519795. [DOI] [PMC free article] [PubMed] [Google Scholar]
- [22].Jeong H, Mason SP, Barabási AL, Oltvai ZN. Lethality and Centrality in Protein Networks. Nature. 2001 May 3;411(6833):41–2. doi: 10.1038/35075138. [DOI] [PubMed] [Google Scholar]
- [23].Horvath S, Zhang B, Carlson M, Lu KV, Zhu S, Felciano RM, Laurance MF, Zhao W, Qi S, Chen Z, Lee Y, Scheck AC, Liau LM, Wu H, Geschwind DH, Febbo PG, Kornblum HI, Cloughesy TF, Nelson SF, Mischel PS. Analysis of oncogenic signaling networks in glioblastoma identifies ASPM as a molecular target. Proc Natl Acad Sci U S A. 2006 Nov 14;103(46):17402–7. doi: 10.1073/pnas.0608396103. [DOI] [PMC free article] [PubMed] [Google Scholar]
- [24].Lander E, Kruglyak L. Genetic dissection of complex traits: guidelines for interpreting and reporting linkage results. Nat Genet. 1995 Nov;11(3):241–7. doi: 10.1038/ng1195-241. [DOI] [PubMed] [Google Scholar]
- [25].Risch N, Merikangas K. The future of genetic studies of complex human diseases. Science. 1996 Sep 13;273(5281):1516–7. doi: 10.1126/science.273.5281.1516. [DOI] [PubMed] [Google Scholar]
- [26].Hoh J, Ott J. Mathematical multi-locus approaches to localizing complex human trait genes. Nat Rev Genet. 2003 Sep;4(9):701–9. doi: 10.1038/nrg1155. [DOI] [PubMed] [Google Scholar]
- [27].Becker J, Wendland JR, Haenisch B, Nöthen MM, Schumacher J. A systematic eQTL study of cis-trans epistasis in 210 HapMap individuals. Eur J Hum Genet. 2011 Aug 17; doi: 10.1038/ejhg.2011.156. [DOI] [PMC free article] [PubMed] [Google Scholar]
- [28].Baum AE, Akula N, Cabanero M, Cardona I, Corona W, Klemens B, Schulze TG, Cichon S, Rietschel M, Nöthen MM, Georgi A, Schumacher J, Schwarz M, Abou Jamra R, Höfels S, Propping P, Satagopan J, Detera-Wadleigh SD, Hardy J, McMahon FJ. A genome-wide association study implicates diacylglycerol kinase eta (DGKH) and several other genes in the etiology of bipolar disorder. Mol Psychiatry. 2008 Feb;13(2):197–207. doi: 10.1038/sj.mp.4002012. [DOI] [PMC free article] [PubMed] [Google Scholar]
Associated Data
This section collects any data citations, data availability statements, or supplementary materials included in this article.