

Abstract
Paired epistatic interactions, such as those in the stem regions of RNA, play an important role in many biological processes. However, unlike protein-coding regions, paired epistatic interactions have lacked the appropriate statistical tools for the detection of departures from selective neutrality. Here, a model is presented for the analysis of paired epistatic regions that draws upon the population genetics of the compensatory substitution process to detect the relative strength of natural selection acting against deleterious combinations of alleles. The method is based upon the relative rates of double and single substitution, and can differentiate between nonindependent interactions and negatively epistatic ones. The model is implemented in a fully Bayesian framework for parameter estimation and is demonstrated using a 5S rRNA data set. In addition to the detection of selection, modeling the double and single substitution processes in this manner inherently accounts for a substantial proportion of rate variation among stem positions.
Keywords: epistasis, compensatory mutation, RNA, phylogenetics
Introduction
Epistasis, or the interaction among different loci, plays a vital role in many biological processes, including the connection between genotype and phenotype (Bateson 1909), the mechanism of speciation (Dobzhansky 1936; Muller 1939), and the process of adaptation (Wright 1931, 1932). One of the clearest examples of intramolecular epistatic interactions can be found in RNA, in which the characteristic stem and loop structure is largely determined by Watson–Crick pairings between sites not immediately adjacent in the primary sequence. Maintaining the proper structure is essential for preserving the function of many RNAs. A mutation at one of these paired positions will disrupt the bond and negatively affect the structure. However, the bond can be restored by a second “compensatory” mutation at the opposite paired position. The signature of such compensatory substitution evolution events can often be observed in interspecific sequence alignments, and served as the basis for early, accurate predictions of RNA secondary structure itself (Woese and Pace 1993; Gutell 1996).
The process of compensatory substitution has been well-studied in a population genetic context (Kimura 1985; Iizuka and Takefu 1996; Michalakis and Slatkin 1996; Phillips 1996), often in the specific case of RNA (Stephan 1996; Higgs 1998; Innan and Stephan 2001). These authors have shown that when natural selection acts against deleterious intermediates, the total rate of both single and double substitutions is expected to decrease, but the relative rate of double substitution is expected to increase (Kimura 1985; Iizuka and Takefu 1996; Phillips 1996; Stephan 1996; Higgs 1998; Innan and Stephan 2001). When selection is very strong there is little chance of a single deleterious mutation going to fixation (Kimura 1962), but it may remain in the population at low frequency (or be lost then subsequently regained) long enough to be combined with a second compensatory mutation. If this occurs, these two mutations may drift to fixation, resulting in two simultaneous substitution events. When natural selection is very weak or absent; however, single substitutions can readily occur. Thus, the relative proportion of double substitution events should be a function of the strength of natural selection acting against deleterious intermediates, scaled by population size, as well as the mutation rate.
Phylogenetic substitution models have been developed for the analysis of RNA by expanding the unit of evolution from the nucleotide to the pair of nucleotides (doublet). Some doublet models considered only the possibility of single substitutions (Schöniger and von Haeseler 1994; Muse 1995; Rzhetsky 1995) while others allowed for multiple substitutions simultaneously (Tillier 1994; Tillier and Collins 1995, 1998). Savill et al. (2001) provide a thorough description of the large number of doublet models developed and compare the fit of the various models, finding that models that allow such double substitutions fit empirical data much better than do models that do not allow double substitutions. None of these models, however, explicitly account for the underlying dynamics of the population genetic process of compensatory substitution.
Epistatic interactions can also be used to draw inferences about the evolutionary process itself, such as the strength of natural selection. The nonsynonymous–synonymous substitution rate ratio (Nielsen and Yang 1998) uses codon triplets, a different kind of intramolecular interaction, for the detection of diversifying positive selection in protein-coding DNA. Such an approach has thus far been lacking for the analysis of RNA. In this article, a substitution model is presented for the analysis of RNA that accounts for the dynamics of the compensatory substitution process at the population level. Based on these dynamics, this model can be used to assess the strength of natural selection acting against noncanonical stem pairs. The method, which utilizes the relative rates of single and double substitutions, is described in the context of RNA stem regions, but it is generally applicable to any instance of pairwise negative epistasis. The model is implemented in a fully Bayesian statistical inference framework and is demonstrated using a data set of eukaryotic 5S rRNA.
New Approaches
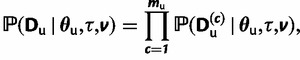
The phylogenetic substitution model presented here allows for both single and double substitutions between pairs of sites. Because the processes of single and double substitution are inherently linked by the underlying mutational process, these rates are explicitly coupled via shared parameters. The relative rate of double to single substitution is controlled by a parameter d. In the absence of epistatic interactions between sites the expectation is d = 0, meaning that the data are well explained by the single substitution process. This will be true as long as epistasis is not present, even if selection acts upon individual loci. A value of  indicates the presence of epistatic interactions, specifically natural selection acting against deleterious combinations of alleles, and the value of d grows with increasing selective strength against intermediates. This provides a means to simultaneously test for the presence of epistatic interactions and assess the relative importance of those interactions. See the Materials and Methods section for additional details of the model and further justification of this parameterization in terms of the population genetic process of compensatory substitution.
Results
Analysis of Simulated Data
Simulated 5S rRNA alignments with different relative double substitution rates were generated to verify that the method is capable of inferring the true value of the double substitution rate d. For each simulated alignment, the joint posterior distribution of all model parameters was estimated using the inference method described. The true topology was assumed to be known and fixed, but the branch lengths were not.
The marginal posterior distributions of d reveal that the method is able to accurately estimate the true value of the relative double substitution rate present in these simulated data sets (fig. 1). Double substitution rates close to zero were also correctly inferred, indicating the model will not detect double substitutions when none are present. Increases above neutrality, both subtle and large, were detected as well, even when using the very limited data of the 5S RNA structure (only 37 paired characters). Consequently, a high degree of confidence can be had in the method’s ability to estimate double substitution rates elevated above neutral, and that truly neutral rates can be estimated as such.
Fig. 1.

Estimated values of the double substitution parameter d on simulated 5S RNA data sets. Shown is the distribution of the posterior means from simulated data sets for each value of the true parameter.
Analysis of 5S rRNA Data
Double Substitution Rate
The 5S rRNA data set was analyzed in two ways: by allowing the topology to be a random variable and by fixing the topology to that of the iML tree. The marginal posterior distributions of the double substitution rate parameter d are shown in figure 2. The posterior mean of d when the tree is free is 9.724, and the 95% highest posterior density interval is (5.261, 14.956). When the topology is constrained to that of the iML tree the posterior mean is 7.591 with 95% highest posterior density interval (4.110, 11.763). Although these two estimates are noticeably different, they are both significantly higher than zero, indicating strong support for the frequent occurrence of double substitutions in this data set and consequently the presence of strong selection acting against deleterious intermediates.
Fig. 2.
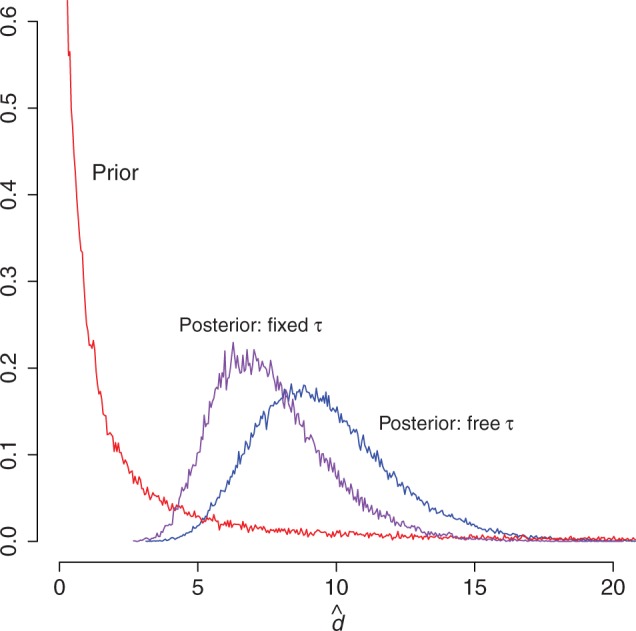
Estimates of the double substitution parameter d on the 5S rRNA data set. Shown are the prior distribution (red), the marginal posterior distribution under the constrained iML topology (purple), and the marginal posterior distribution when the topology is unconstrained (blue).
Although estimates of certain model parameters, such as stationary frequencies, are often insensitive to the topology used, this is not the case for the double substitution rate parameter d (fig. 2). This is neither unexpected nor problematic. Because the iML tree was obtained by maximizing the likelihood under a single-substitution-only model with independent sites, it is plausible that such a tree might rarely be sampled in the posterior distribution of trees under the model allowing double substitutions. To test whether the dependence of estimates of d on the topology is particular to the iML tree or more general, several trees were sampled at random from the posterior distribution of trees resulting from the unconstrained analysis. These topologies were then conditioned upon and all other model parameters re-estimated. The subsequent posterior estimates of d obtained were highly similar to those obtained when also estimating the topology (data not shown). Consequently, the difference in posterior estimates of d when conditioning upon the iML tree (fig. 2) is not expected when the topology used is one likely to be sampled from the posterior of topologies. It is therefore recommended that the tree be considered a random variable during analyses, unless the user is confident of the accuracy of the specified topology. This observation also underscores the important point, made previously by Savill et al. (2001), that inference of topology using RNA is greatly improved by allowing nonzero double substitution rates between Watson–Crick pairings.
Rate Variation among Sites
Estimates of the double substitution rate are positively correlated with estimates of the rate variation shape parameter α for the paired sites, and consequently negatively correlated with the amount of rate variation itself (fig. 3). When the model is constrained to d = 0, thereby disallowing double substitutions, estimates of the α shape parameter are small, implying there is a great deal of rate variation among pairs of sites. When some double substitutions are permitted at a fixed rate (d = 1), the estimates increase, and when d is unconstrained and takes on larger values, α increases yet again, implying a reduction in the rate variation among pairs of sites. While accounting for rate variation among sites is essential in studies of molecular evolution (Yang 1996), approaches to doing so have rarely had biological interpretability. In this case, a substantial portion of the rate variation among sites observed has been implicitly accounted for by employing a more realistic substitution model.
Fig. 3.
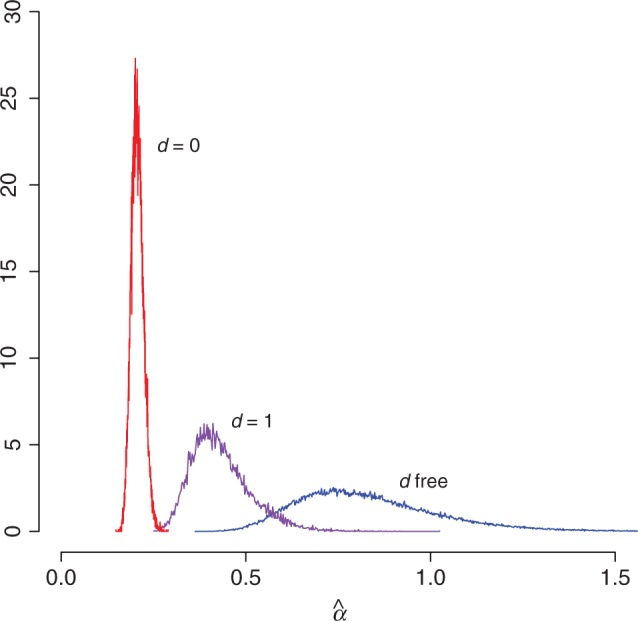
Rate variation among sites decreases when double substitutions are permitted. The marginal posterior distributions of the α-shape parameter of the gamma-distributed rate variation for the paired data partition are shown under different constraints on the double substitution rate: d = 0 (red), d = 1 (purple), and d unconstrained (blue). Small values of α correspond to large amounts of rate variation among sites.
Additional Model Properties
The exchangeability matrix is intended to capture information about the mutation process, whereas the effects of selection are captured by the other model parameters. If this is the case, then the estimates of the exchangeability matrices from paired and unpaired sites (S and  , respectively) should be similar. This is indeed what is observed: the paired and unpaired 95% credible intervals overlap for each of the six exchangeability parameters. This indicates that the model is doing a reasonable job of disentangling the effects of mutation and selection. In future analyses, the exchangeability matrix could be considered a shared parameter between the two partitions.
Allowing for the presence of double substitutions also affects estimates of the doublet stationary frequencies. Typically, the estimated stationary frequencies for canonical Watson–Crick pairs are considerably higher than for noncanonical pairs. The average of marginal posterior means was computed for canonical doublets  and for noncanonical doublets
  , and the ratio of these
  summarizes the disparity between these classes. The estimates of this ratio are 38.99702, 21.4772, and 4.004372 when the double substitution rate parameter d is constrained to be zero, constrained to be one, and unconstrained, respectively. These estimates become 58.65343, 29.01591, and 5.474801, respectively, when GT and TG pairs, which are typically of intermediate frequency, are excluded. When strong evidence for double substitutions exists in the data but double substitutions are disallowed, the stationary frequencies must compensate by estimating extremely low values for noncanonical pairs. Allowing for double substitutions permits the stationary frequencies for noncanonical pairs to remain low, but not be held at such unreasonably low values.
Prior Sensitivity Analysis
Although the choice of a half-Cauchy (0, 1) distribution as a prior on the double substitution rate parameter was well motivated, it is essential to demonstrate that the prior choice does not exert undue influence on the nature of the posterior distribution. The 5S rRNA data set was analyzed using a series of different prior distributions on the double substitution rate. Parameters were estimated on the fixed iML topology to better constrain the parameter space. The marginal posterior distribution of the double substitution rate for each choice of prior distribution is shown in figure 4, with each compared with sampling under the prior itself. An overly informative prior with little density in the plausible ranges of the double substitution rate markedly shifted the posterior estimates (fig. 4d), and such strongly informative priors on unreasonable ranges should clearly be avoided. However, prior distributions with at least some density in the appropriate ranges all performed similarly (fig. 4a–c), even on the short 5S rRNA data, indicating reasonable robustness to prior specification.
Fig. 4.
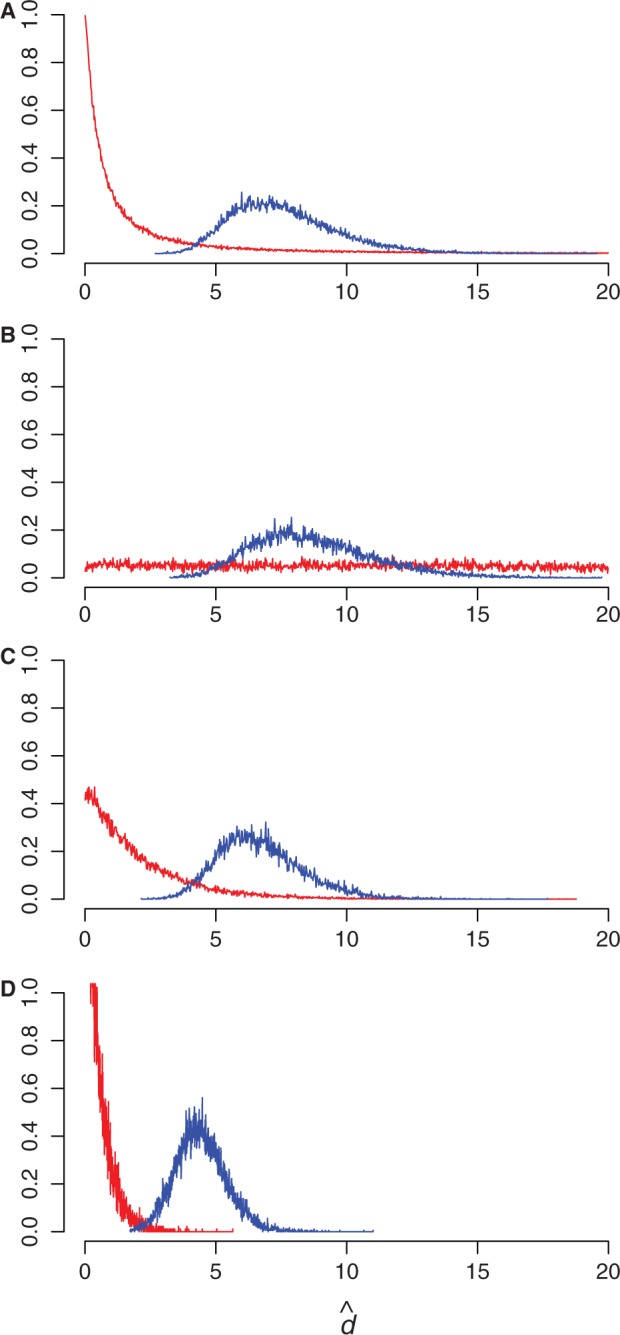
Sensitivity to the prior on double substitution rate parameter. The marginal posterior distribution of d (blue) is shown under different prior distributions on d (red). The posterior does not change unless the prior is overly informative. (A) half-Cauchy (0, 1); (B) uniform (0, 20); (C) exponential  ; (D) exponential (2).
Model Comparison
The general model, in which the double substitution rate d was unconstrained, was compared with the neutral case in which double substitutions are disallowed (d = 0). Bayes factors were calculated by taking the ratio of the prior and the posterior densities, both evaluated at the fixed point of interest (eq. 9). Intuitively, if the prior density is much higher than the posterior evaluated at the point of constraint, then the data have moved the posterior away from the constrained value. Inspection of supplementary figure S2, Supplementary Material online, reveals that the prior density is far greater than the posterior at d = 0. Twice the natural log of the Bayes factors comparing the general model against the cases in which d = 0 is 692.7. Given that a value of  is considered decisive evidence (Jeffreys 1961), there is overwhelming evidence that 5S rRNA are better described by a model that allows double substitutions. Use of alternative prior distributions for d did not change this interpretation.
Permutation Analysis
It is important to know that the model will not infer a rate of double substitution when one is not present. In the case of RNA, this can be tested using permutations of the original alignment with respect to the structure. By randomly altering the pairing assignments amongst the paired columns of the alignment, permuted data sets preserve some properties of the original alignment, such as nucleotide frequencies, while removing the correlated substitution pattern that is indicative of double substitutions. Consequently, inferred values of the double substitution rate using permuted alignments should be markedly less than those inferred using the true alignment.
Several such permuted data sets were analyzed assuming the iML tree (supplementary fig. S1, Supplementary Material online), and the posterior distributions of the double substitution rate parameter are summarized in figure 5. As expected, the posterior distributions inferred for most permuted data sets are very close to 0, and are uniformly much lower than the true data.
Fig. 5.

Estimates of double substitution rate using permuted data sets. The marginal posterior estimates of the double substitution rate parameter d are shown using the original 5S rRNA alignment and 10 permutations of that alignment in which the doublet pairings are randomly assigned.
Random permutations of highly structured data such as RNA stems can produce data sets that retain many characteristics of the original, leading to an inferred rate greater than neutral but still less than the original. This is observed in the fourth permuted alignment (fig. 5), which contains an elevated level of Watson–Crick pairings relative to all other permutations and to that expected by chance (data not shown). These permutation tests are all in concert with expectations of the method, and with the simulation results described earlier provide ample evidence that the method is capable of distinguishing genuine rates of double substitutions and can generally avoid false positives.
Discussion
The unique properties of rRNA, such as the high degree of structural conservation paired with a relatively low degree of sequence conservation, make them well suited for studies of how natural selection affects the evolution of primary sequence. These analyses can only be performed, however, with the appropriate statistical tools. Nielsen and Yang (1998) showed that positive selection could be detected in protein-coding DNA using evolutionary substitution models, leading to numerous studies detecting the effects of selection acting on protein-coding genes. Such tools for the direct detection of natural selection have been lacking for RNA. The model presented here seeks to provide researchers with such a tool with which to investigate the role of natural selection acting on various kinds of RNAs.
The ability of this model to infer the strength of natural selection results from the connection between the compensatory substitution process and the expectations from the underlying population genetic dynamics. As a result, parameters of the model take on real meaning with respect to important biological processes. In the absence of negative epistatic interactions, the rate of double substitution is expected to be zero. In the presence of epistasis, the proportion of double substitutions should increase with selection against deleterious intermediates. The double substitution rate should be a function of both the strength of natural selection and the mutation rates of the individual variants, all scaled by population size. All of these aspects are incorporated into the model presented here. This represents an improvement over existing models of RNA substitution (Schöniger and von Haeseler 1994; Muse 1995; Rzhetsky 1995), including those which allow for double substitutions (Tillier 1994; Tillier and Collins 1995, 1998), by creating a model that is interpretable rather than purely descriptive of the data. This mechanistic and intuitive approach also extends previous models by providing a Bayesian context for analysis and by allowing greater flexibility in single-site substitution rates.
There are several other key benefits of the model described here. A key property of the model is that it implicitly accounts for much of the rate variation among pairs of sites (fig. 3). This is a very exciting result, because while rate variation is often addressed, it is rarely done so mechanistically. Additionally, because epistatic effects have been naturally consolidated into a single interpretable parameter, the present model becomes more readily extensible in various ways (see the following section for further discussion). The current model also extends previous RNA models to allow for more complex underlying single-site substitution models. In this manuscript, the GTR models have been employed, but any single-site exchangeability matrix can be used, whereas previous models had been more constrained.
The presence and extent of natural selection acting on stem sites can therefore be tested directly, marginalized over all other model parameters in the process. When applied to the 5S rRNA data set, there is a clear signature of natural selection acting against intermediates that might disrupt the structure. The ability to use the model itself to draw conclusions about the process of compensatory evolution is appealing, particularly in a Bayesian context, because it allows uncertainty to be incorporated. For example, Meer et al. (2010) examined the fitness landscape of tRNA compensatory substitutions, but did so by conditioning on a fixed topology and estimating ancestral states via maximum likelihood, using only pairs of sites with unambiguous patterns. The sensitivity of estimates about compensatory substitution to topology has been demonstrated (fig. 2), and ancestral states could be integrated over rather than conditioned upon. Both of these, as well as the utilization of all of the data (of varying ambiguity) can be incorporated into a Bayesian analysis such as that presented here.
Model Limitations and Extensions
The inferences made under this model depend critically on several assumptions, with perhaps the most critical being that the RNA secondary structure remains constant over the tree. If the structure is not constant across the tree then the strength of natural selection inferred should be an underestimate, as evidenced by the permutation analyses. The model has also assumed that the only interactions among sites are between the paired sites. This is certainly not the case; stacking interactions between adjacent positions are also important (Walter et al. 1994). Accounting for such neighbor interactions would add a great deal of complexity to the model, requiring a model of the entire sequence as the evolutionary unit to encompass all of the overlapping interactions (Robinson et al. 2003; Yu and Thorne 2006).
Another potential objection to the model presented is that it considers all noncanonical pairings to be equally deleterious. Pairings between guanine and thymine (or uracil) are more stable than other noncanonical pairings, and can at times appear to have been conserved over interspecific timescales (Rousset et al. 1991). The stationary frequencies of G-T doublets are typically inferred to be higher than those of other noncanonical doublets, and that was observed in these analyses as well. These elevated stationary frequencies result in increased rates of compensatory evolution via single substitution through a G-T intermediate. And since the double substitution rates depend upon the single rates, the additional stability of the G-T pairs is indirectly incorporated into the double substitution rates as well. Consequently, the elevated stability of the G-T pairings are implicitly, if never explicitly, considered by the model presented.
The presence or absence of recombination is an important aspect of the compensatory substitution process. Population genetic theory has shown that recombination increases the time required to observe compensatory substitutions, and therefore decreases the rate at which such substitutions occur (Kimura 1985; Stephan 1996). Empirically, there is an inverse relationship between the linear distance separating two paired sites in the sequence and the rate of compensatory substitution (Stephan and Kirby 1993; Piskol and Stephan 2008), supporting the idea that as recombination increases, the rate of compensatory substitution decreases. And linkage alone, even among neutral sites, can have a profound effect on the timing of fixation events, creating a process that is overdispersed (Watterson 1982). Consequently, there may be a great deal still to gain by considering linkage explicitly, both for phylogenetic methods in general and in the specific case of RNA.
The strength of natural selection may not be uniform across all pairs of sites within a particular structure, as assumed here. Certain stem positions, such as those near the ends of stems, have been shown to be more conserved than others (Piskol and Stephan 2008) and have likely experienced stronger selection. Allowing the double substitution parameter d to vary across pairs would allow for hypotheses regarding differential selection on stem pairs to be addressed. A similar problem was addressed by Huelsenbeck et al. (2006), who implemented the model of Nielsen and Yang (1998) for the detection of positive selection among codons under a Dirichlet process prior, allowing the detection of positive selection at individual codon positions. Implementing the model described in this work under a similar nonparametric clustering method would be a natural extension and would allow for such site-specific detection of selection strength at different stem positions.
Although the model presented here captures the dynamics of the underlying population genetic process of compensatory substitution, it remains at its core a phylogenetic substitution model. It might be possible to develop a model of the compensatory substitution process for inference using interspecific data that is parameterized entirely in terms of the relevant population genetic parameters. This would allow for even more direct estimation of the strength of natural selection.
The model presented has been implemented in a fully Bayesian estimation framework, but a maximum likelihood approach would be a viable alternative. However, if the tree topology is unknown, finding the maximum likelihood tree and model parameters is likely to take considerably longer than a Bayesian approach. This is particularly true with a data set such as the one used here, with many taxa and short sequences; such a data set contains a lot of information regarding the substitution parameters but comparatively less regarding the precise topology.
An exciting potential application for the model presented is for use in structure prediction. It was shown that the value of d is high when the data are correctly paired and low when the pairing assignments are shuffled (fig. 5). By treating the pairing assignments as a random variable, it might be possible to use this property of the method to estimate the joint posterior distribution of pairing assignments and model parameters. This would automate explicit considerations of the compensatory substitution process in structure estimation.
Materials and Methods
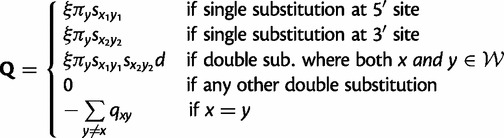
Paired Substitution Model
The evolution of paired sites is modeled as a continuous-time Markov chain, where the state space is the 16 possible two-nucleotide combinations, or doublets. This model therefore considers substitution events between different doublets. Let x and y be doublets, and adopt the convention that the first nucleotide of each doublet  is the
  and the second nucleotide
  the
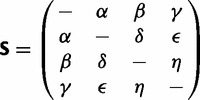
the  position in the sequence. Define the exchangeability matrix S with entries sij between the four different nucleotides as that of the general time-reversible model (GTR) of Tavaré (1986)
 |
(1) |
and the stationary frequencies of the 16 possible doublet states
| (2) |
Now letting  be the set of Watson–Crick pairs, the instantaneous rate matrix Q with entries qxy describing changes from doublet x to doublet y is defined as
 |
(3) |
where ξ is a rate-scaling factor to ensure that branch lengths are interpretable in terms of average number of substitutions per site, and d regulates the relative proportion of double to single substitutions. Gamma-distributed rate variation among pairs of sites is also incorporated, with shape parameter α (Yang 1993). The choice of a gamma distribution to model rate variation among pairs is motivated by consistency with previous phylogenetic models, which use the gamma distribution to model among-site variation. The set of parameters specific to the doublet substitution model are  .
.
Note that although RNA sequences are being discussed, evolution occurs at the level of the DNA in which the RNA is encoded. Consequently, throughout this article, thymine (T) is referenced rather than uracil (U).
Double Substitution Rate
Double substitutions require two changes; mutations that are destined to go to fixation must arise at both sites. The process of mutation is captured in this model by the exchangeability matrix S (eq. 1), encompassing both the overall rate of mutation and the relative propensity of change between different bases. Consequently, the rate of double substitution is a function of the product of two exchangeability parameters: one for each change being made (eq. 3). A similar approach has recently been applied to codon models allowing multiple simultaneous substitutions (Miyazawa 2011). Previous models of RNA evolution allowing double substitutions (Tillier 1994; Tillier and Collins 1995, 1998) did so at a rate independent of all others. By coupling the single and double substitution rates via the exchangeability parameters, this model reflects the fact that the two are united through a common mutational process.
Within a population, there are two pathways by which two substitutions can be made. The first pathway is sequential: the first mutation arises and becomes fixed in the population, followed by the arising and subsequent fixation of the second mutation. In the other pathway, the second mutation arises while the first is still polymorphic; the intermediate haplotype never becomes fixed. In the neutral case, sequential fixations are more common, but the probability of observing two neutral mutations simultaneously segregating is a function of the mutation rate and population size, and when these are large the simultaneous polymorphism pathway can occur as well. However, the fixation probability of a neutral mutation is independent of the presence or absence of any other neutral mutation, even in the case of complete linkage. Similarly, deleterious but otherwise independent mutations are also unaffected by other such mutations with respect to their fixation probabilities. As a result, in the absence of epistasis all substitutions are single substitutions, regardless of their pathway, because the fixation probabilities are unaltered by the interaction. Two simultaneously polymorphic neutral (or independently deleterious) substitutions are simply two single substitutions occurring very close in time.
Double substitutions account for epistatic interactions among loci. When selection is present against deleterious combinations of alleles, the first mutation will often be held at low frequency until the second mutation occurs, at which point the two are more likely to become fixed together. As selection against single mutants increase, it becomes very difficult for single mutations to reach fixation, and the simultaneously polymorphic pathway becomes more likely. The key is that the fixation probability of these mutations depends on the presence or absence of the other. It is this additional probability of fixation due to epistatic interactions that is accounted for by the double substitution rate. It is not sufficient to simply occur near each other in time; a double substitution event implies that the alleles, when together, have fixed when they otherwise might not have independently.
Double substitutions could be equivalently defined by the presence of linkage disequilibrium. Epistatic interactions will create linkage disequilibrium between alleles during the fixation process, with high-fitness combinations more likely to be observed. Neutral alleles or deleterious alleles in the absence of epistasis will not lead to such increased linkage disequilibrium. Under this interpretation, single substitutions account for both the sequential fixation pathway as well as the polymorphic pathway in the absence of linkage disequilibrium, whereas double substitutions represent the simultaneous pathway with linkage disequilibrium created in the process.
The parameter d, representing the relative rate of double to single substitutions between doublets, can be used to draw conclusions about the relative strength of natural selection acting against intermediates. As described earlier, the neutral expectation is d = 0, with single substitution alone explaining the data. A value of  is indicative of a negative epistatic interaction between the loci, with selection having acted against deleterious combinations of alleles. Although an analytical formula for the relative rate d as a function of selection against intermediates, population size, and mutation rate has not yet been derived, it is clear that as selection against intermediates increases so does the relative rate of double substitution. But because the mutational process is accounted for by the exchangeability parameters, the parameter d captures information relating to the strength of natural selection. Consequently, the larger the value of d, the stronger natural selection has acted against deleterious intermediates.
Diversifying positive selection for new doublets can also cause linkage disequilibrium between polymorphic loci. However, in the absence of selection against intermediates, positive selection will primarily result in increased rates of single substitution. This is because simply obtaining a new doublet does not require that those substitutions be made together, as is the case when selection against intermediates is present. Consequently, diversifying positive selection alone is not expected to result in large values of d. However, the combined effects of negative selection against deleterious intermediates and recurrent positive selection for new doublets, should lead to very large estimates of d. Assuming negative selection is already sizable however, it may be difficult to distinguish the presence of diversifying positive selection from an additional increase in negative selection against intermediates. Again the signature may lie in the absolute rate of single substitution; positive selection should act to increase this rate despite election against deleterious intermediates, whereas increased negative selection should reduce single substitution rates further.
Paired Stationary Frequencies
The doublet stationary frequencies play an important role in capturing the properties of the compensatory substitution dynamics. Population genetics theory predicts that the rate of leaving a favorably paired state via single substitution should be low, whereas the rate of entering such a paired state via single substitution should be higher, and these trends will become more pronounced as selection against intermediates increases (Kimura 1962). In this model, the instantaneous rate to a particular doublet depends on the stationary frequency of that doublet (eq. 3). Because the observed frequencies of high-fitness pairs in the data are likely to be very high relative to low-fitness pairs, the doublet stationary frequencies implicitly alter the single substitution rates, mirroring those effects predicted by the population genetics.
The doublet frequencies present an additional opportunity to test for nonindependent interactions among sites. If sites evolved independently, the frequency of doublets would equal the product of the two nucleotide frequencies  . Departure from this indicates that the sites are not evolving independently. It does not however, by itself, indicate that the interaction is epistatic. This is important, because it is possible that doublet positions are not independent for reasons other than selection against intermediates, such as context-dependent mutation. Taken together with the test for epistatic interactions (
 ), there are four possible combinations (table 1). It is possible to detect independence among doublets yet still infer an inflated rate of double substitution indicating epistasis. This makes little sense biologically and would reveal that the model is inadequate in some respect.
Table 1.
Nonindependence versus Epistasis.
 |
 |
|
|---|---|---|
| d = 0 | Independent and nonepistatic | Model inadequacy |
 |
Dependent but nonepistatic | Dependent and epistatic |
Unpaired Substitution Model
As with paired sites, evolution at unpaired sites is modeled as a continuous-time Markov chain, but on the state space of the four possible nucleotides. A GTR model is assumed (Tavaré 1986) with gamma-distributed rate variation among sites (Yang 1993). The unpaired process has a vector of the four nucleotide stationary frequencies  , and an exchangeability matrix
  of the same form as that described in equation (1). The instantaneous rate matrix to describe changes from nucleotide i to j can be defined as
 |
(4) |
where ξ is again a scaling factor such the branch lengths have meaning in terms of the expected number of substitutions per site. The parameters specific to the unpaired model are collectively  where α is the shape parameter of the gamma distributed rate variation for unpaired sites.
Alignment
An  alignment of RNA sequences D is assumed, where n is the number of taxa and m is the number homologous characters. This alignment is treated as observed data rather than as a random variable. The model further assumes a known structure of the RNA that defines the pairing of RNA stem positions. Using this structure, the alignment is partitioned into two subsets: one for paired (
 ) and one for unpaired (
 ) positions. The structure is assumed to be shared among all species and to remain constant over the course of evolution.
Phylogeny
All species are assumed to be related via an unrooted bifurcating phylogenetic tree. Let τ represent the tree topology, and let  represent the vector of
  independent branch lengths of the phylogeny. In some cases, the topology and branch lengths will be assumed to be known, and in others they will be considered as random variables. Both paired and unpaired data partitions share the same tree topology and set of branch lengths.
Statistical Model
Define a character as either an unpaired site or a paired doublet. The likelihood of the alignment for a particular character is the probability of the corresponding alignment column (or columns) given all of the parameters of the model. Calculating the likelihood requires obtaining the transition probability matrix for each branch of the tree. For both the paired and unpaired models, the transition probability matrix between states after some branch length v is obtained via matrix exponentiation
| (5) |
Using these transition matrices, the likelihood for a particular character can be calculated from the tip to the root of the tree using the sum-product algorithm (Gallager 1962, 1963), also known as the pruning algorithm (Felsenstein 1981). If all characters are assumed to evolve independently, then the likelihood for each data partition can be calculated as the product of the individual character likelihoods,
 |
(6) |
for the paired-sites partition, and
 |
(7) |
for the unpaired sites partition, where mp and mu are the number of paired and unpaired characters in each partition. Because all characters, and consequently all partitions on characters, have been assumed to be independent, the likelihood of the full alignment is the product of the individual partition likelihoods given in equations (6) and (7).
A fully Bayesian framework for parameter estimation is adopted, with each parameter considered a random variable with an associated prior and posterior probability density. Letting  be all of the parameters of the model, the joint posterior probability of the model parameters is
| (8) |
where  is the full likelihood of the data,
  is the set of prior probabilities of the model parameters, and
  is the marginal probability of the data.
Prior Distributions
The prior densities chosen for model parameters are shown in table 2. The Dirichlet distribution is the conjugate prior to the multinomial distribution and a sensible prior for stationary frequencies and exchangeability parameters, and a flat Dirichlet distribution is relatively uninformative. For tree topology, either no prior knowledge of the topology is assumed, in which case a uniform prior on all trees is assumed, or it is assumed that the topology is known, which corresponds to a probability of one for the adopted tree, and a corresponding zero probability for all other trees. Branch lengths are drawn from independent, identically distributed exponential distributions, and likewise are the shape parameters of the gamma-distributed rate variation, with exponential rate parameters of 40 and 2, respectively. In general, the prior densities described thus far are standard, relatively uninformative ones.
Table 2.
Prior Distributions on Model Parameters.
| Partition | Parameter | Symbol | Prior |
|---|---|---|---|
| Shared | Tree topology | τ | Uniform over all topologies |
| Branch lengths |  |
Exponential (2) [each branch] | |
| Paired | Doublet frequencies |  |
Dirichlet (1, 1, 1, 1, 1, 1, 1, 1, 1, 1, 1, 1, 1, 1, 1, 1) |
| Base exchangeability | S | Dirichlet (1, 1, 1, 1, 1, 1) | |
| Double substitution factor | d | Half-Cauchy (0, 1) | |
| Rate variation shape | α | Exponential (2) | |
| Unpaired | Base frequencies |  |
Dirichlet (1, 1, 1, 1) |
| Base exchangeability |  |
Dirichlet (1, 1, 1, 1, 1, 1) | |
| Rate variation shape |  |
Exponential (2) |
The Cauchy (0, 1) distribution on the interval (0,  ), also known as a half-Cauchy, was selected as a prior density for the parameter d controlling the relative rate of double to single substitutions. The Cauchy is considered a weakly informative prior density and is a reasonable choice in this situation. Its large density close to zero befits the assumption that the rate should be small (neutral) unless the data show otherwise. However, because the possibility exists that predominantly double substitutions occur in the presence of large amounts of selection against intermediates, the parameter d must in principle be able to take very large values. The heavy-tailed Cauchy allows for this. A second, related justification for this choice is that the half-Cauchy can be derived as the ratio of two independent exponential random variables. This has been used previously as a prior on nonsynonymous–synonymous rate ratios and transition–transversion rate ratios (Huelsenbeck et al. 2006).
MCMC
Markov chain Monte Carlo (MCMC) was used to sample the joint posterior distribution of all model parameters (Metropolis et al. 1953; Hastings 1970). A Markov chain was constructed that has as its state space the model parameters and a stationary distribution that is the joint posterior probability distribution of those parameters. Periodic sampling of this Markov chain at stationarity therefore yields a sample from the posterior distribution, and the frequency with which the chain visits a particular parameter configuration is proportional to the joint posterior probability of the parameter states. A C++ computer program was implemented to perform this MCMC sampling on the model described.
Standard proposal mechanisms are used for each parameter. For stationary frequencies ( ) and exchangeability parameters (S), new configurations are chosen as Dirichlet random variables with weights derived from the current state. New values of branch lengths (
 ), double substitution parameter (d), and rate variation shape parameter (α) are proposed by multiplying the current value by the factor
  , where η is a Uniform (0, 1) random variable and z is a tuning parameter. Proposed changes to the topology are made using nearest-neighbor interchange or subtree pruning and re-grafting with equal probability.
Duplicate chains were run for 4 million update cycles in analyses in which the topology is a random variable, and for 2 million cycles in analyses in which the topology is fixed. The first 10% of the samples from runs were discarded as burn-in, and multiple chains were run for analyses using empirical data. The program tracer (Rambaut and Drummond 2009) was used for assessment of MCMC convergence.
Empirical Data
An alignment of eukaryotic 5S rRNA sequences (113 species: 45 plants and 68 fungi) was downloaded from the 5S Ribosomal Database (Szymanski et al. 2002). The 5S rRNA structure is relatively conserved across the tree of life, and sequences are available for a wide variety of organisms, making it a good choice for assessing the adequacy of the model. The general eukaryotic 5S structure used for analysis is shown in figure 1a of Szymanski et al. (2002), and consists of 37 pairs of sites and the remaining sites are unpaired. Although 5S rRNA sequences are typically around 119 nucleotides in length, the alignment includes gap characters for insertions present in some taxa, increasing the total alignment length to 140 nucleotides. As the focus of this work is not alignment itself, all analyses performed here condition upon the alignment as if it were observed rather than estimated.
Tree Topology
The primary goal of this work is not topological inference, but the inference of the parameters of the evolutionary process, in particular the relative double substitution rate. Furthermore the 5S rRNA described, containing 113 taxa and only 103 characters (paired and unpaired), is not an ideal one for topological inference. For inference using this data, the topology will be considered a random variable to obtain marginal estimates of the parameters of interest. For evaluation of the model, however, it will sometimes be convenient to condition on a particular topology. This is to ensure that the same parameter space is being explored, given finite computation time.
To obtain a tree upon which to condition, the 5S rRNA data set was analyzed using maximum likelihood in the program PAUP* 4.0b10 (Swofford 2003). For this analysis, base pairings were ignored and all sites assumed to be independent. The model of nucleotide substitution assumed was the HKY85 model (Hasegawa et al. 1985), with gamma-distributed rate variation (Yang 1994). The gamma distribution was discretized into four categories and the shape parameter was assumed to be 0.5. Stationary frequencies were estimated using the empirical base frequencies and the transition–transversion rate ratio was assumed to be 2. A heuristic search was performed for 115 hours to optimize the topology and branch lengths, using neighbor-joining (Saitou and Nei 1987) to generate a starting tree and using tree bisection and reconnection as a swap mechanism. One of the 4,174 high-likelihood trees found was selected at random and will be referred to subsequently as “the iML tree” (supplementary fig. S1, Supplementary Material online).
Simulated Data Generation
A computer program was implemented for the generation of simulated data sets under the paired and unpaired substitution models described. Simulation of alignments was done in the following manner. The rate matrices for the paired and unpaired models are specified by equations (3) and (4), respectively. A Gamma (0.5) distribution was discretized into four categories with equal probability. Each character drew randomly from these four categories a scalar by which the branch lengths are multiplied, introducing rate variation among sites. The transition probability matrix for each branch was calculated using equation (5) and the adjusted branch lengths for that character. Root node states were drawn from the appropriate stationary distribution. Remaining internal and terminal node states were determined via a preorder tree traversal, in which the state of the descendent node was drawn stochastically given the state of the ancestral node and the transition probability matrix for that branch.
Simulated alignments were generated of the same dimensions and pairing structure as the empirical 5S rRNA data set using the iML tree (supplementary fig. S1, Supplementary Material online). A range of values of the double substitution rate parameter d were used, and the other model parameters were fixed at values shown in table 3. Seven data sets were created for each value of the double substitution rate. The values chosen are close to the maximum likelihood values inferred using the empirical data, and may be considered as reasonable for RNA data sets.
Table 3.
Alignment Simulation Parameters.
| Parameter | Value |
|---|---|
 |
(0.015, 0.025, 0.011, 0.15, 0.0175, 0.019, 0.175, 0.014, 0.014, 0.22, 0.01, 0.06, 0.14, 0.04, 0.065, 0.0245) |
 |
(0.31, 0.24, 0.23, 0.22) |
 |
(0.1, 0.2, 0.1, 0.1, 0.2, 0.1) |
 |
1.0 |
| d | {0, 1, 2, 3, 4, 5, 10, 20} |
Alignment Permutations
Permuted alignments were obtained by shuffling the original columns of the alignment with respect to the fixed structure. Ten permuted data sets were created from the original 5S rRNA data set. Each was obtained by sampling uniformly without replacement pairs of sites from the set of individual sites that were paired in the original structure. In this manner each column was used only once in each data set and all unpaired sites remain unpaired in the permuted data sets, allowing them to serve as an additional control.
Bayes Factor Calculation
Model comparison was accomplished by the calculation of Bayes factors (Kass and Raftery 1995). The general case in which d is a free parameter was compared against the special case when double substitutions are disallowed (d = 0). Because this represents a nested model comparison, Bayes factors were estimated using the Savage–Dickey ratio (Verdinelli and Wasserman 1995; Suchard et al. 2001). If model M0 is nested within model M1, then the Bayes factor in favor of M1 and against M0 is estimated by the ratio of the prior and marginal posterior densities of d under M1 evaluated at the constrained value,
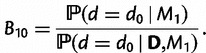 |
(9) |
Approximating the posterior distribution of d was done by first noting that its form resembled that of a Gamma distribution, then finding the values of the shape and rate parameters of the Gamma distribution that maximized the likelihood of the posterior samples of d. This yielded a Gamma (15.25, 1.5995) distribution. It should be noted that the Gamma distribution with shape parameter not equal to 1 has zero density when evaluated at 0. The density evaluated at  is used to approximate the density at d = 0.
Supplementary Material
Supplementary figures S1 and S2 are available at Molecular Biology and Evolution online (http://www.mbe.oxfordjournals.org/).
Acknowledgments
The authors thank Tracy Heath for helpful discussions and Jeff Thorne, Nicolas Galtier, and two anonymous reviewers for comments on the manuscript. This work was supported by National Institutes of Health grant GM-069801 to J.P.H. and National Science Foundation postdoctoral fellowship DBI-1202884 to C.A.N.
References
- Bateson W. Mendel’s principles of heredity. Cambridge: Cambridge University Press; 1909. [Google Scholar]
- Dobzhansky T. Studies on hybrid sterility. II. Localization of sterility factors in Drosophila pseudoobscura hybrids. Genetics. 1936;21:113–135. doi: 10.1093/genetics/21.2.113. [DOI] [PMC free article] [PubMed] [Google Scholar]
- Felsenstein J. Evolutionary trees from DNA sequences: a maximum likelihood approach. J Mol Evol. 1981;17:368–376. doi: 10.1007/BF01734359. [DOI] [PubMed] [Google Scholar]
- Gallager RG. Low-density parity-check codes. IRE Trans Inform Theory. 1962;8:21–28. [Google Scholar]
- Gallager RG. Low-density parity-check codes. Cambridge (MA): MIT Press; 1963. [Google Scholar]
- Gutell RR. Comparative sequence analysis and the structure of 16S and 23S rRNA. In: Dahlberg AE, Zimmermann RA, editors. Ribosomal RNA: structure, evolution, processing and function in protein biosynthesis. Boca Raton (FL): CRC Press; 1996. pp. 111–128. [Google Scholar]
- Hasegawa M, Kishino H, Yano T. Dating the human-ape splitting by a molecular clock of mitochondrial DNA. J Mol Evol. 1985;22:160–174. doi: 10.1007/BF02101694. [DOI] [PubMed] [Google Scholar]
- Hastings WK. Monte Carlo sampling methods using Markov chains and their applications. Biometrika. 1970;57:97–109. [Google Scholar]
- Higgs PG. Compensatory neutral mutations and the evolution of RNA. Genetica. 1998;102/103:91–101. [PubMed] [Google Scholar]
- Huelsenbeck JP, Jain S, Frost SWD, Pond SLK. A Dirichlet process model for detecting positive selection in protein-coding DNA sequences. Proc Natl Acad Sci U S A. 2006;103:6263–6268. doi: 10.1073/pnas.0508279103. [DOI] [PMC free article] [PubMed] [Google Scholar]
- Iizuka M, Takefu M. Average time until fixation of mutants with compensatory fitness interaction. Genes Genet Syst. 1996;71:167–173. [Google Scholar]
- Innan H, Stephan W. Selection intensity against deleterious mutations in RNA secondary structures and rate of compensatory nucleotide substitutions. Genetics. 2001;159:389–399. doi: 10.1093/genetics/159.1.389. [DOI] [PMC free article] [PubMed] [Google Scholar]
- Jeffreys H. Theory of probability. Oxford: Oxford University Press; 1961. [Google Scholar]
- Kass RE, Raftery AE. Bayes factors. J Am Stat Assoc. 1995;90:773–795. [Google Scholar]
- Kimura M. On the probability of fixation of mutant genes in a population. Genetics. 1962;47:713–719. doi: 10.1093/genetics/47.6.713. [DOI] [PMC free article] [PubMed] [Google Scholar]
- Kimura M. The role of compensatory neutral mutations in molecular evolution. J Genet. 1985;64:7–19. [Google Scholar]
- Meer MV, Kondrashov AS, Artzy-Randrup Y, Kondrashov FA. Compensatory evolution in mitochondrial tRNAs navigates valleys of low fitness. Nature. 2010;464:279–282. doi: 10.1038/nature08691. [DOI] [PubMed] [Google Scholar]
- Metropolis N, Rosenbluth AW, Rosenbluth MN, Teller AH, Teller E. Equation of state calculations by fast computing machines. J Chem Phys. 1953;21:1087–1092. [Google Scholar]
- Michalakis Y, Slatkin M. Interaction of selection and recombination in the fixation of negative-epistatic genes. Genet Res. 1996;67:257–269. doi: 10.1017/s0016672300033747. [DOI] [PubMed] [Google Scholar]
- Miyazawa S. Advantages of a mechanistic codon substitution model for evolutionary analysis of protein-coding sequences. PLoS One. 2011;6:e28892. doi: 10.1371/journal.pone.0028892. [DOI] [PMC free article] [PubMed] [Google Scholar]
- Muller HJ. Reversibility in evolution considered from the standpoint of genetics. Biol Rev Camb Philos Soc. 1939;14:261–280. [Google Scholar]
- Muse SV. Evolutionary analyses of DNA sequences subject to constraints on secondary structure. Genetics. 1995;139:1429–1439. doi: 10.1093/genetics/139.3.1429. [DOI] [PMC free article] [PubMed] [Google Scholar]
- Nielsen R, Yang Z. Likelihood models for detecting positively selected amino acid sites and applications to the HIV-1 envelope gene. Genetics. 1998;148:929–993. doi: 10.1093/genetics/148.3.929. [DOI] [PMC free article] [PubMed] [Google Scholar]
- Phillips PC. Waiting for a compensatory mutation: phase zero of the shifting-balance process. Genet Res. 1996;67:271–283. doi: 10.1017/s0016672300033759. [DOI] [PubMed] [Google Scholar]
- Piskol R, Stephan W. Analyzing the evolution of RNA secondary structures in vertebrate introns using Kimura’s model of compensatory fitness interactions. Mol Biol Evol. 2008;25:2483–2492. doi: 10.1093/molbev/msn195. [DOI] [PubMed] [Google Scholar]
- Rambaut A, Drummond AJ. Tracer v1.5. 2009. http://beast.bio.ed.ac.uk/Tracer.
- Robinson DM, Jones DT, Kishino H, Goldman N, Thorne JL. Protein evolution with dependence among codons due to tertiary structure. Mol Biol Evol. 2003;20:1692–1704. doi: 10.1093/molbev/msg184. [DOI] [PubMed] [Google Scholar]
- Rousset F, Pelandakis M, Solignac M. Evolution of compensatory substitutions through G.U intermediate state in Drosophila rRNA. Proc Natl Acad Sci U S A. 1991;88:10032–10036. doi: 10.1073/pnas.88.22.10032. [DOI] [PMC free article] [PubMed] [Google Scholar]
- Rzhetsky A. Estimating substitution rates in ribosomal RNA genes. Genetics. 1995;141:771–783. doi: 10.1093/genetics/141.2.771. [DOI] [PMC free article] [PubMed] [Google Scholar]
- Saitou N, Nei M. The neighbor-joining method: a new method for reconstructing phylogenetic trees. Mol Biol Evol. 1987;4:406–425. doi: 10.1093/oxfordjournals.molbev.a040454. [DOI] [PubMed] [Google Scholar]
- Savill NJ, Hoyle DC, Higgs PG. RNA sequence evolution with secondary structure constraints: comparison of substitution rate models using maximum-likelihood methods. Genetics. 2001;157:399–411. doi: 10.1093/genetics/157.1.399. [DOI] [PMC free article] [PubMed] [Google Scholar]
- Schöniger M, von Haeseler A. A stochastic model and the evolution of autocorrelated DNA sequences. Mol Phylogenet Evol. 1994;3:240–247. doi: 10.1006/mpev.1994.1026. [DOI] [PubMed] [Google Scholar]
- Stephan W. The rate of compensatory evolution. Genetics. 1996;144:419–426. doi: 10.1093/genetics/144.1.419. [DOI] [PMC free article] [PubMed] [Google Scholar]
- Stephan W, Kirby DA. RNA folding in Drosophila shows a distance effect for compensatory fitness interactions. Genetics. 1993;135:97–103. doi: 10.1093/genetics/135.1.97. [DOI] [PMC free article] [PubMed] [Google Scholar]
- Suchard MA, Weiss RE, Sinsheimer JS. Bayesian selection of continuous-time Markov chain evolutionary models. Mol Biol Evol. 2001;18:1001–1013. doi: 10.1093/oxfordjournals.molbev.a003872. [DOI] [PubMed] [Google Scholar]
- Swofford DL. PAUP*: phylogenetic analysis using parsimony and other methods. Version 4. Sunderland (MA): Sinauer Associates, Inc; 2003. [Google Scholar]
- Szymanski M, Barciszewska M, Erdmann V, Barciszewski J. 5S ribosomal RNA database. Nucleic Acids Res. 2002;30:176–178. doi: 10.1093/nar/30.1.176. [DOI] [PMC free article] [PubMed] [Google Scholar]
- Tavaré S. Some probabilistic and statistical problems on the analysis of DNA sequences. In: Miura RM, editor. Lectures in mathematics in the life sciences. Vol. 17. Providence (RI): American Mathematical Society; 1986. pp. 57–86. [Google Scholar]
- Tillier ERM. Maximum likelihood with multiparameter models of substitution. J Mol Evol. 1994;39:409–417. [Google Scholar]
- Tillier ERM, Collins RA. Neighbor joining and maximum likelihood with RNA sequences: addressing the interdependence of sites. Mol Biol Evol. 1995;12:7–15. [Google Scholar]
- Tillier ERM, Collins RA. High apparent rate of simultaneous compensatory base-pair substitutions in ribosomal RNA. Genetics. 1998;148:1993–2002. doi: 10.1093/genetics/148.4.1993. [DOI] [PMC free article] [PubMed] [Google Scholar]
- Verdinelli I, Wasserman L. Computing Bayes factors using a generalization of the SavageDickey density ratio. J Am Statist Assoc. 1995;90:614–618. [Google Scholar]
- Walter AE, Turner DH, Kim J, Lyttle MH, Müller P, Mathews DH, Zuker M. Coaxial stacking of helixes enhances binding of oligoribonucleotides and improves predictions of RNA folding. Proc Natl Acad Sci U S A. 1994;91:9218–9222. doi: 10.1073/pnas.91.20.9218. [DOI] [PMC free article] [PubMed] [Google Scholar]
- Watterson GA. Substitution times for mutant nucleotides. J Appl Prob. 1982;19:59–70. [Google Scholar]
- Woese CR, Pace NR. Probing RNA structure, function, and history by comparative analysis. In: Gesteland RF, Atkins JF, editors. The RNA world. Woodbury (NY): Cold Spring Harbor Laboratory Press; 1993. pp. 91–117. [Google Scholar]
- Wright S. Evolution in Mendelian populations. Genetics. 1931;16:97–159. doi: 10.1093/genetics/16.2.97. [DOI] [PMC free article] [PubMed] [Google Scholar]
- Wright S. The roles of mutation, inbreeding, crossbreeding and selection in evolution. Proceedings of the sixth international congress on genetics. Vol. 1. 1932; Ithaca NY Brooklyn (NY): Brooklyn Botanic Garden; 1932. pp. 356–366. [Google Scholar]
- Yang Z. Maximum likelihood estimation of phylogeny from DNA sequences when substitution rates differ over sites. Mol Biol Evol. 1993;10:1396–1401. doi: 10.1093/oxfordjournals.molbev.a040082. [DOI] [PubMed] [Google Scholar]
- Yang Z. Maximum likelihood phylogenetic estimation from DNA sequences with variable rates over sites: approximate methods. J Mol Evol. 1994;39:306–314. doi: 10.1007/BF00160154. [DOI] [PubMed] [Google Scholar]
- Yang Z. Among-site rate variation and its impact on phylogenetic analyses. Trends Ecol Evol. 1996;11:367–372. doi: 10.1016/0169-5347(96)10041-0. [DOI] [PubMed] [Google Scholar]
- Yu J, Thorne JL. Dependence among sites in RNA evolution. Mol Biol Evol. 2006;23:1525–1537. doi: 10.1093/molbev/msl015. [DOI] [PubMed] [Google Scholar]
Associated Data
This section collects any data citations, data availability statements, or supplementary materials included in this article.