Abstract
We previously reported that the vasoactive peptide 1 (P1, “SSWRRKRKESS”) modulates the tension of pulmonary artery vessels through caveolar endothelial nitric oxide synthase (eNOS) activation in intact lung endothelial cells (ECs). Since PKC-α is a caveolae resident protein and caveolae play a critical role in the peptide internalization process, we determined whether modulation of caveolae and/or caveolar PKC-α phosphorylation regulates internalization of P1 in lung ECs. Cell monolayers were incubated in culture medium containing Rhodamine red-labeled P1 (100 μM) for 0–120 min. Confocal examinations indicate that P1 internalization is time-dependent and reaches a plateau at 60 min. Caveolae disruption by methyl-β-cyclodextrin (CD) and filipin (FIL) inhibited the internalization of P1 in ECs suggesting that P1 internalizes via caveolae. P1-stimulation also enhances phosphorylation of caveolar PKC-α and increases intracellular calcium (Ca2+) release in intact cells suggesting that P1 internalization is regulated by PKC-α in ECs. To confirm the roles of increased phosphorylation of PKC-α and Ca2+ release in internalization of P1, PKC-α modulation by phorbol ester (PMA), PKC-α knockdown, and Ca2+ scavenger BAPTA-AM model systems were used. PMA-stimulated phosphorylation of caveolar PKC-α is associated with significant reduction in P1 internalization. In contrast, PKC-α deficiency and reduced phosphorylation of PKC-α enhanced P1 internalization. P1-mediated increased phosphorylation of PKC-α appears to be associated with increased intracellular calcium (Ca2+) release since the Ca2+ scavenger BAPTA-AM enhanced P1 internalization. These data indicate that caveolar integrity and P1-mediated increased phosphorylation of caveolar PKC-α play crucial roles in the regulation of P1 internalization in lung ECs.
Keywords: Caveolae, PKC-α phosphorylation, Peptide internalization, Lung endothelium, Calcium release
Introduction
Cell-penetrating peptides can regulate signal transduction and form specialized signaling complexes in endothelial cells (ECs) [1, 2]. We previously reported that a vasoactive peptide 1 (P1) modulates the tension of pulmonary artery vessels through caveolar endothelial nitric oxide synthase (eNOS) activation [3, 4]. Caveolae are the dynamic structures defined as flask-shaped invaginations with distinct lipid rafts enriched in cholesterol, sphingomyelin, glycosphingolipids, and phosphoinositides in the plasma membranes of multiple cell types, including vascular ECs [5–7]. A family of three proteins, caveolin (Cav)-1, 2, and 3, serves as a marker of caveolae in various cell types [8]. In vascular ECs, Cav plays a critical role in the regulation of caveolae localized enzyme activity. A number of studies have reported that caveolae localize multiple signaling molecules, including PKC-α [9–12]. Bio-chemicals, enzymes, and detergents have been reported to modulate specific lipid/protein domains of the plasma membrane and its components on the basis of their ionic character and solubility index, which also affect structural and functional integrity [13]. Cholesterol modulators methyl-β-cyclodex-trin (CD) and filipin (FIL) which disrupt caveolae are known to diminish the morphologic characteristics and function of caveolae in ECs [14–17]. PKC-α is a calcium-and diacylglycerol-dependent isozyme of the PKC family that is comprised of roughly 12 different isozymes, characterized as serine/threonine kinases and classified into three major groups on the basis of their calcium and diacylglycerol requirement for activation [18–20]. The lipid compositions of various domains of mammalian plasma membranes are different [21] and perhaps this influences the activity of phosholipases which give rise to calcium and diacylglycerol leading to activation of PKC-α.
Activation of PKC-α is known to modulate caveolae and caveolae resident proteins. For example, agonists such as bradykinin and/or PMA-mediated elevation of Ca2+ and activation of PKC-α result in dissociation of caveolar proteins and/or structural modulation of caveolae by flattening and reducing the number of plasma membrane invaginations and affecting caveolar function [10, 11]. Recent reports suggest that (i) Cav-1 scaffolding domain peptide regulates the activity of PKC-α and the interaction of Cav-1 and phospho PKC-α is critical for internalization [12], and (ii) the recruitment of p-PKC-α to the membrane is necessary for the invasion/internalization of E. coli at the bacterial entry site (caveolae) in human brain microvascular ECs [22].
We previously reported that (i) uptake of fluorescent-labeled P1 increased in EC in culture, isolated pulmonary artery segments, and an intact mouse lung [3], (ii) P1-stimulation enhances phosphorylation and the catalytic activity of PKC-α in intact ECs [3], and (iii) P1-stimulated caveolae modulation enhances compartmentalization of eNOS and activity in EC [4]. The present study was designed to determine whether P1-mediated increased phosphorylation of PKC-α is a caveolae-specific event that plays a critical role in the regulation of P1 internalization. In the present study, we investigated whether caveolae disruption and/or P1-stimulation increases intracellular Ca2+ release in intact EC, enhances caveolae-specific PKC-α phosphorylation, and modulates PKC-α levels associated with the P1 internalization process in intact lung ECs.
Materials and methods
Antibodies and reagents
Primary antibodies for western blotting were commercially obtained as rabbit polyclonal anti-caveolin and mouse anti-PKC-α antibodies (BD Transduction Laboratories, San Jose, CA) and rabbit polyclonal anti-p-PKC-α antibody (Santa Cruz Biotechnology, Santa Cruz, CA). Secondary antibodies (peroxidase-conjugated donkey anti-mouse and donkey anti-rabbit IgG) were obtained from Jackson Immuno Research Laboratories (West Grove, PA), Rhodamine Red labeled P1 peptide was synthesized by the University of Florida Protein Core Laboratory; Western blotting reagent was obtained from Bio-Rad Laboratories (Hercules, CA); Fluo 4AM from Invitrogen (Eugene, OR); PMA and BAPTA AM from Calbiochem (Gibbstown, USA). Caveolae disruptors (CD and FIL); and all other common lab chemicals/reagents/buffers were obtained from Sigma Chemicals (St. Louis, MO), Santa Cruz Bio-technology (Santa Cruz, CA), and Fisher Scientific (Orlando, FL).
Tissue cultures and treatments
Pulmonary artery ECs were obtained by collagenase treatment from the main PA of 6- to 7-month-old pigs. ECs were propagated in monolayer culture as previously described [23]. Cells grown to confluence in 100- and 35-mm clear glass bottom dishes were used for preparation of caveolae-enriched membrane fractions and peptide internalization studies by confocal microscopy, respectively. In each experiment, cells were studied 1 or 2 days after confluence at passages 3–5 and were matched for cell line, passage number, and days after confluence.
To determine the potential effects of P1 on caveolar PKC-α phosphorylation and internalization of P1, the endothelial monolayer was incubated with P1 (100 μM) in RPMI 1640 for 5–120 min at 37°C. Controls were incubated in RPMI 1640 only under identical conditions. In some experiments, PKC-α knockdown ECs or PMA (1 μM for 5–30 min) pretreated, BAPTA-AM (50 μM for 30 min) pretreated, or fluo-4-AM (5 μM for 30 min) pretreated ECs were incubated with P1 at 37°C. In some experiments, cells were pretreated with CD (5 mM) or FIL (0.05 μg/mL) for 60 min at 37°C. After treatments, intact cells were used to (i) isolate caveolae-enriched fractions and perform immunoblot analysis of PKC-α, phospho PKC-α (p-PKC-α), and caveolin, (ii) determine intracellular calcium release, and/or (iii) monitor internalization of Rhodamine Red-labeled P1.
Peptide internalization
To determine the level of peptide internalization, cells with or without PKC-α (i.e., knockdown) and pretreatment with P1, CD, FIL, PMA, or BAPTA-AM were washed and incubated, and then used to monitor internalization of Rhodamine Red-labeled P1 for 0–120 min. The cells were washed with PBS (0.01 M, pH 7.4 containing 0.02% sodium azide), immediately mounted with 90% glycerol on covered slides with glass slips, and examined using the wavelength of 543 nm under Zeiss LSM 510 laser scanning confocal microscope. The images were scanned at 40× (single photon) or 20× (two photon) magnification using confocal microscopy. Internalization of Rhodamine Red-labeled P1 was scored by comparing digitized rainbow palette images of different treatments and their controls on a scale of 01–255 emission spectrum intensities based on VIBGYOR (from minimum value 0 for Violet to maximum value of 255 for intense Red). Control cells were run in parallel without (P1) treatment. Zeiss LSM 510 software was used to convert the data of rainbow palette and intensities of internalized rhodamine red-labeled peptide in cells into graphs showing % absolute frequency for corresponding range of intensities. Basically, data obtained from minimum intensity value 01 to maximum intensity values up to 255 in terms of absolute frequencies for each rainbow palette micrographs (value of zero intensity was not included into data considered as no internalization zone) and grouped into five ranges (01–50, 51–100, 101–150, 151–200, 201–255), the percentage distribution of each range was calculated from total absolute frequency values of all intensities in a given micrograph. The micrographs and corresponding graphs obtained are the representation of four randomly picked microscopic fields from at least three separate experiments for each set.
Assessments of calcium levels in ECs
To determine whether P1-stimulation enhances intracellular Ca2+ release, cell monolayers with fluo-4 AM (5 μM for 30 min) pretreatment were stimulated with P1 (100 μM) in calcium-free RPMI and simultaneously monitored for intracellular Ca2+ release in randomly focused fields under confocal microscopy with appropriate wavelength settings (excitation at 485 nm, emission at 520 nm). Images were captured before and after 60 min treatment, or fluorescence intensities were measured and recorded automatically every 3 s by pre-programmed LSM 510 Zeiss software, until the end of each experiment.
Preparation of caveolar-enriched membrane fractions
The caveolar-enriched membrane fractions were isolated by a slightly modified detergent-free method and by a conventional detergent method (TritonX-100) used by Song et al. [24] and Sprenger et al. [25], respectively. The modifications were made to keep the association of caveolae and other detergent-sensitive proteins/components intact by eliminating TritonX-100 as used by Sprenger et al. [25] and by removing NaHCO3 in cell lysates to avoid changes in physiological pH, as described in the detergent-free method used by Song et al. [24]. The cells were gently disrupted by nitrogen cavitation instead of sonication. In brief, control or pre-treated cells were washed twice with ice-cold MBS Buffered saline (MBS; 25 mM MES, pH 6.5, 150 mM NaCl) and scraped off the dishes in 5 mL MBS containing protease inhibitor cocktails (source: Calbio-chem). The cells were homogenized using a Dounce homogenizer with a tight fitting glass pestle at 4°C with 10 strokes of 10 s each. The homogenized cell suspensions were disrupted by Parr Bomb (Parr Instrument Company IL. USA) nitrogen cavitation using nitrogen pressure of 650 psi with an equilibration period of 15 min. Lysed cell suspensions (1.5 mL) were mixed with equal volumes of 80% sucrose in MBS and placed at the bottom of an ultracentrifuge tube. Five milliliter of 30% sucrose/MBS was layered on the top of the lysate followed by 4 ml of 5% sucrose/MBS layer on the top of the 30% sucrose/MBS solution. The sucrose gradient was centrifuged at 38,000 rpm for 16 h in a SW-40 rotor (Beckman Coulter Optima, L-70 K ultracentrifuge) at 4°C. Twelve fractions (1 ml each) from the top to the bottom of the centrifuge tube were collected separately in centrifuge tubes and diluted with three volumes of MBS, and centrifuged at 38,000 rpm for 1 h in a Ti-70 rotor (Beckman Coulter Optima, L-70 K ultracentrifuge) at 4°C. The resulting pellets were analyzed by Western blots using 50 μg of protein to determine the level of the caveolae marker protein Cav-1. Protein contents were measured with Bicinchoninic acid (BCA) using commercial kits supplied by Pierce in keeping with the manufacturer’s instructions. After Cav-1 marker protein analysis of twelve fractions, the caveolae-enriched fraction #5 and representative non-caveolar-enriched fraction #9 were identified and used in the study.
Western blot analysis
The caveolar-enriched and non-caveolar-enriched fractions, i.e., fraction numbers 5 and 9, respectively, obtained after subcellular fractionation were mixed with equal volumes of PBS pH 7.4 and four volumes of each fraction mixed with one volume of 5X loading buffer (Fermentas #R0891), vortexed, and boiled for 10 min. The equal volumes of protein fractions were loaded on gradient Gel 4–20%, and resolved in Criterion cell BIORAD at 200 volts for 50 min, followed by electroblotting in Criterion blotter BIORAD and transferring resolved protein onto nitrocellulose (NC) membranes at 100 volts for 60 min. The NC membranes were washed three times in Tris–Tween buffered saline, 0.1% Tween 20 (TTBS) and blocked by 5% non-fat dry milk (NFDM) in TBS for 1 h. The NC membranes were washed three times with TTBS for 30 min, and the washed membranes were incubated overnight with primary antibody [rabbit polyclonal anti-caveolin; dilution 1:5000, mouse anti-PKC-α; dilution 1:1000, rabbit polyclonal anti-p-PKC-α(Ser657); dilution 1:2500] and diluted in 1% NFDM–TBS as prescribed by suppliers. Prior to incubation with secondary antibody, the NC membranes were washed three times for 30 min in TTBS and incubated with desired horseradish peroxidase-conjugated secondary antibody diluted in 1% NFDM–TBS as prescribed by suppliers for 2 h. Proteins reactive with primary antibody were visualized with chemiluminescence technique using luminol reagents.
Recombinant adenovirus-mediated inhibition of PKC-α
ECs on the bottom of a 35-mm dish were cultured in 2 ml of RPMI 1640. To enhance the transfection, the recombinant adenovirus containing the dominant negative (DN) form of PKC-α (Ad-PKCα-DN, ADV-410, Cell Biolabs) or the GFP (Ad-GFP, ADV-004) gene was mixed with the Antennapedia (Antp) peptides. The Ad-PKCα-DN/Ad-GFP and Antp mixture was added to the dishes containing ECs (90–95% confluence). The adenovirus-infected cells were incubated for 24–48 h. The levels of GFP fluorescent intensities were assessed using fluorescent confocal microscopy to confirm the expression of the delivered genes. The infected cells were incubated with P1 and assessed for P1 internalization using confocal microscopy.
Statistical analysis
Significance for the effect of P1 on internalization, phosphorylation of PKC-α, calcium elevation, and the difference between optical densities of immunoblots of PAEC fractions was determined by ANOVA and Student’s paired t test. A value of P < 0.05 was considered statistically significant [26].
Results
P1 internalization is time dependent
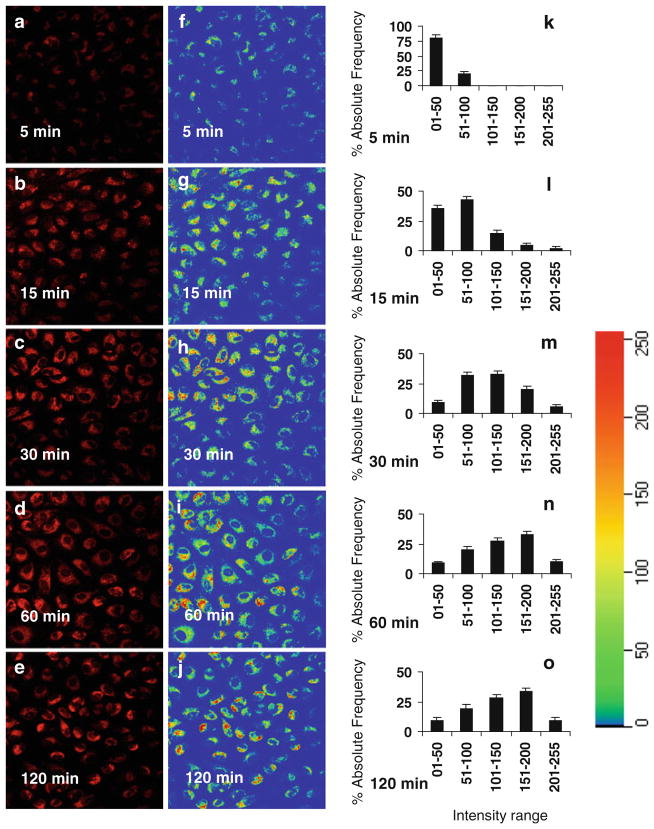
Rhodamine Red-labeled P1 was used to monitor the process of P1 internalization. The levels of fluorescent intensities in the cells that were incubated with the labeled P1 for 5–30 min were constantly increased (Fig. 1). Longer (60–120 min) incubations of ECs with P1 did not further increase the levels of internalized P1 (Fig. 1). These results suggest that P1 internalization reaches its peak between 30 and 60 min. Rainbow palette micrographs (Fig. 1f–j) and corresponding graphs (Fig. 1k–o) shows rhodamine red intensities (measured at 543 nm) of internalized peptide in cells, plotted on the scale of 01–255 for % absolute frequency distribution of each intensity range using four randomly selected microscopic fields in each micrograph were used to compare the intensities of internalized P1 in ECs incubated for different time period.
Fig. 1.
Assessments of P1 internalization. ECs were incubated in the medium containing Rhodamine Red-labeled P1 at 37°C for 5, 15, 30, 60, and 120 min, respectively. After the cells were washed to remove free P1, the fluorescence micrographs (40×) of live cells were obtained using confocal microscopy (a–e). The rainbow palette micrographs (f–j) were generated on the same sets of data and corresponding graphs (k–o), respectively shows rhodamine red intensities of internalized peptide in cells, plotted on the scale of 01–255 for % absolute frequencies distribution of each intensity range using four randomly selected microscopic fields in each panel measured by the Zeiss LSM software
Pre-incubation of ECs with caveolae disruptors CD or FIL prevents P1 internalization
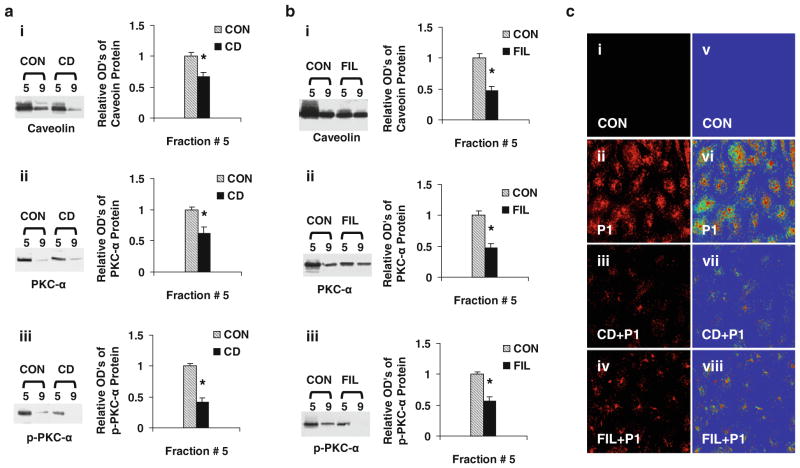
To determine whether P1 is internalized via caveolae, ECs were pre-incubated with or without medium containing CD (5 mM) or FIL (0.05 μg/ml) for 60 min. The pre-treated cells were incubated in fresh medium with or without the presence of Rhodamine red-labeled P1 for 60 min, and the levels of fluorescent intensities were assessed. The levels of fluorescence intensities of P1 internalization with or without CD/FIL treated are shown in Fig. 2c. Pre-incubation of ECs with CD or FIL for 60 min markedly blocked P1 internalization (Fig. 2c-iii, iv), whereas in caveolae-intact (control; Fig. 2c-ii) cells, P1 internalization was markedly increased. The caveolae disruption by CD or FIL confirms that P1 internalizes via caveolae. Rainbow palette micrographs were used to compare the intensities of internalized P1 in control and caveolae-disrupted cells (Fig. 2c-v–viii), confirming the inhibition of P1 internalization by caveolae disruptors in ECs. To determine whether reduced internalization of P1 by caveolae disruption is associated with reduced caveolar PKC-α phosphorylation, the effects of CD/FIL treatment of EC on Cav-1, PKC-α, and p-PKC-α levels in fraction 5 and # 9 were monitored. As shown in Fig. 2a, b, the levels of Cav-1, PKC-α, and p-PKC-α were significantly reduced in caveolae-enriched fractions #5.
Fig. 2.
Caveolae disruptors (CD/FIL) reduces caveolar PKC-α phosphorylation and P1 internalization. ECs were pre-incubated with or without medium containing CD (5 mM) or FIL (0.05 μg/ml) for 60 min. After treatment, cells were washed and incubated with or without Rhodamine Red-labeled or non labeled P1 at 37°C for 60 min and used for confocal microscopy and isolation of caveolar-enriched fractions (#5) and a non-caveolar-enriched fraction (#9) as described in methods. The levels of caveolin, PKC-α, and p-PKC-α proteins in the fractions isolated from CD (a) and FIL (b) were assessed using Western blot analysis as described in methods. a, b Data are means ± SE; n = 4 for control and CD/FIL treatment group fraction #5. *P < 0.05 versus control. c The fluorescent micrographs (40×) of live cells pre-incubated with CD/FIL, treated with and without rhodamine red-labeled P1 were obtained using confocal microscopy (images i, ii, iii, iv). The rainbow palette micrographs (images v, vi, vii, viii) are generated on the same sets of data using the Zeiss LSM software
P1-stimulation increases intracellular Ca2+ release in intact EC
We reported that P1-stimulation increased catalytic activity of PKC-α in intact lung EC [3]. Since PKC-α activation and/ or phosphorylation are calcium-dependent, we determined whether P1-stimulation increases intracellular calcium release in intact EC. Confluent ECs were incubated with fluo-4 AM to monitor the levels of intracellular Ca2+ with or without (control) P1-stmulation. The ratios of final fluorescence intensities (F) to the initial fluorescence intensities (F0) were monitored every 3 s for up to 60 min in the same microscopic field by confocal microscopy. P1-stimulation increased intracellular Ca2+ release in a time-dependent manner (Fig. 3a). Representative confocal images show changes in intracellular Ca2+ release in 0 min and after 60 min incubation in control (Fig. 3b) and P1-stimulated cells (Fig. 3c). In P1-stimulated cells, 0 time represent simultaneous addition of P1 or RPMI followed by immediate capture of images by confocal microscopy with approximately 10 s delay. Rainbow palette micrographs were used to compare the intensities of Ca2+ released in control and P1-stimulated cells (Fig. 3b-iii, iv, c-iii, iv), showing that P1 stimulation increases intracellular Ca2+ release in intact EC.
Fig. 3.

Assessments of calcium release in intact EC. Cell monolayers were pre-incubated in medium containing fluo-4 AM for 30 min. The cells were treated with the vehicle (control) or labeled P1 for 60 min and examined under the confocal microscope. The ratios of final fluorescence intensities (F) to the initial fluorescence intensities (F0) measured at every 3 s of the same microscopic field were assessed for up to 60 min. P1-stimulation resulted in time-dependent elevation of intracellular Ca2+ release (a). Representative confocal images at 0 min and after 60 min incubation in control (b) and P1-stimulated cells (c) show levels of intracellular Ca2+ release in intact ECs. In P1-stimulated cells, the 0 time represent simultaneous addition of P1 followed by immediate capture of image by confocal microscopy that required about 10 s delay. Rainbow palette micrographs were used to compare the intensities of Ca2+ released in control and P1-stimulated cells (b iii and iv, c iii and iv), showing that P1 stimulation increases intracellular Ca2+ release in intact EC
P1 enhances phosphorylation of caveolar PKC-α at Ser-657
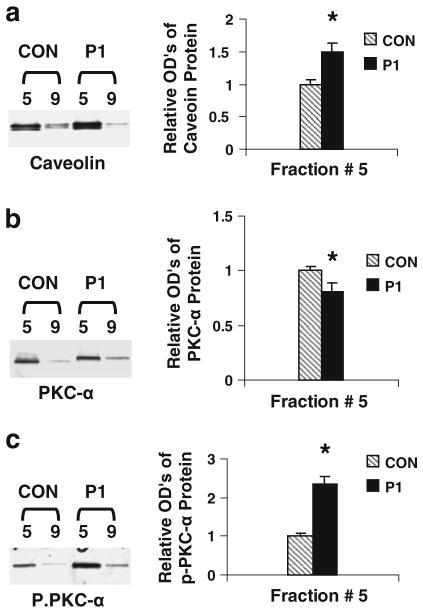
To determine whether the effects of P1-mediated increased PKC-α activation/phosphorylation are caveolae-specific events, the levels of the total and phosphorylated PKC-α in caveolar-enriched fraction were assessed using Western blot analysis. The levels of Cav-1 in subcellular fraction #5 are higher than those in fraction #9 (Fig. 4a). This indicates that fraction #5 is enriched in the caveolar membranes. Next, the levels of PKC-α in fractions #5 and #9 (the control) were assessed. The level of total PKC-α in fraction #5 separated from P1-treated cells is lower than that from control cells (Fig. 4b). Furthermore, the level of phosphorylated PKC-α at Ser-657 in the caveolar fraction of P1-treated ECs is higher than that in the fraction derived from control cells (Fig. 4c). The observations demonstrate that P1 induces PKC-α activation in cultured ECs since Ser-657 phosphorylation is required for PKC-α activity.
Fig. 4.
Assessments of caveolin, phosphorylated PKC-α, and total p-PKC-α protein levels. PAECs were incubated in medium containing P1 (100 μM) or vehicle at 37°C for 1 h. Differential sucrose density gradient centrifugation was used to separate caveolar-enriched fractions (#5) and a non-caveolar-enriched fraction (#9). The levels of caveolin, PKC-α, and p-PKC-α proteins in the fractions were assessed using Western blot analysis (insets). The band intensities were determined and shown as ODu’s (Optical Density Units/mm2). a The levels of caveolin in the caveolar-enriched and non-caveolar fractions derived from P1- or vehicle-treated cells. b PKC-α levels in the P1-treated or untreated fractions. c the effects of P1 on PKC-α phosphorylation (p-PKC-α). Data are means ± SE; n = 4 for control and P1 treatment group fraction #5. *P < 0.05 versus control for P1-treated samples
PMA-mimicked P1 modulation of caveolar PKC-α activity
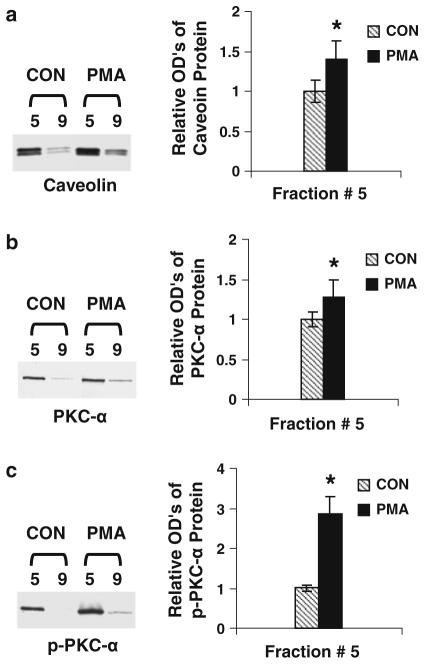
PMA induces PKC-α activation. As shown in Fig. 4, the enrichment of caveolar membranes is confirmed since the levels of caveolin in fraction #5 are higher than those in fraction 9 (Fig. 5a). The levels of total and phosphorylated PKC-α in PMA-treated cells are higher than those in vehicle-treated cells (Fig. 5b, c). However, PMA-increased levels of phosphorylation are higher than those of PKC-α protein mass, indicating that PMA induces PKC-α activation mainly through Ser-657 phosphorylation. The data suggest that P1-induced PKC-α activation may be similar to PMA activation of PKC-α.
Fig. 5.
The effects of a PKC activator on the levels of caveolin and PKC-α. ECs were treated with PMA (1 μM) for 45 min at 37°C and subjected to caveolar-enriched fraction preparation and Western blot analysis. a The levels of caveolin in the caveolar-enriched and non-caveolar fractions derived from PMA- or vehicle-treated cells. b PKC-α levels in the PMA-treated or untreated fractions. c the effects of PMA on PKC-α phosphorylation. Data are means ± SE; n = 4 for control and PMA treatment group fraction #5. *P < 0.05 versus control for PMA-treated samples
Time-dependent activation of PKC-α by P1 and PMA
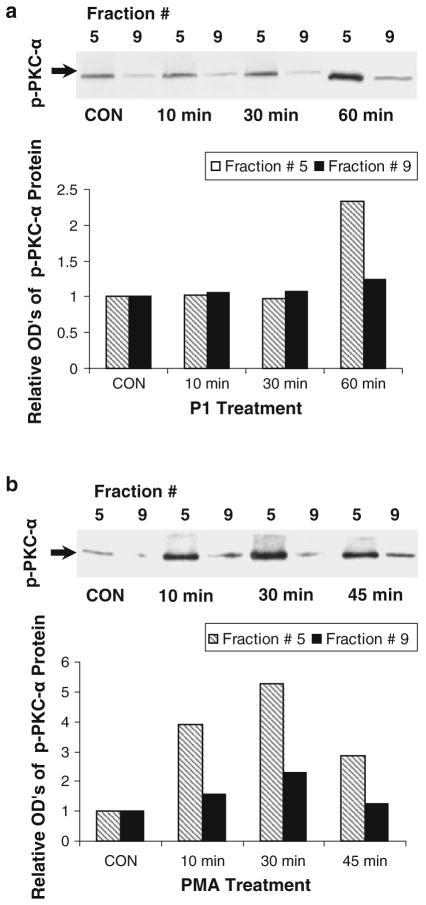
To determine the effects of P1 and PMA on PKC-α activation, lung ECs were incubated in culture medium containing P1 or PMA for 0–60 min. The levels of phosphorylated PKC-α in the cells treated by P1 are comparable for 0–30 min, but dramatically increased in the fraction derived from 60 min-treated cells (Fig. 6a). In parallel, PMA increases the level of phosphorylated PKC-α in a time-dependent manner (0–30 min), which peaked in the 30 min-treated cells (Fig. 6b). These results indicate that it takes a longer time for P1 (60 min) than for PMA (30 min) to activate PKC-α to its peak in ECs. The pattern of P1 internalization is correlated with that of PKC-α activation, suggesting a negative role of PKC-α modulation of P1 entering ECs.
Fig. 6.
Time courses of P1 and PMA-induced PKC-α activation. ECs were treated with P1 for 0–60 min or PMA for 0–45 min and assessed for the levels of p-PKC-α. Western blot analysis was performed (insets). The relative levels of phosphor (p)-PKC-α in the cells treated with P1 (a) and PMA (b) were assessed. Western blots are representative of two separate experiments. Relative optical densities are an average of corresponding two separate blots
Pre-incubation of ECs with P1/PMA prevents P1 internalization
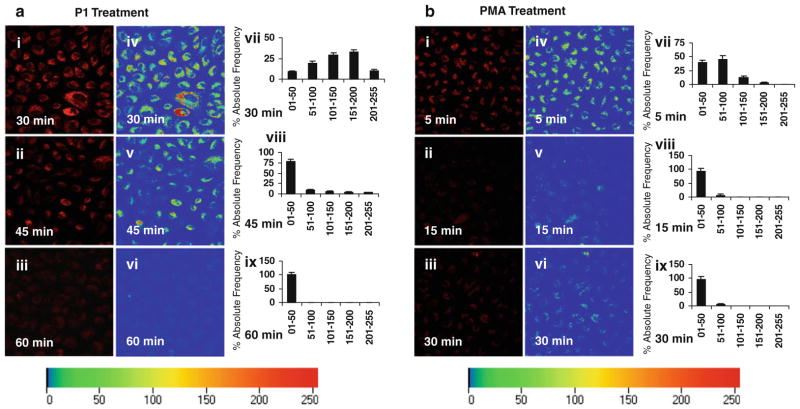
To determine whether P1/PMA activation of PKC-α blocks P1 internalization, ECs were pre-incubated in medium containing P1 for 30–60 min or PMA for 5–30 min. The times of pre-incubations were selected since P1- and PMA-induced PKC-α activity peaked between 30 and 60 min for P1 and 5–30 min for PMA. The pre-treated cells were incubated in fresh medium containing labeled P1, and the levels of fluorescent intensities were assessed by monitoring rhodamine red intensities (measured at 543 nm) of internalized peptide in cells and plotted on the scale of 01–255 for % absolute frequencies distribution of each intensity range by using Zeiss LSM software. P1/PMA pre-incubation-prevented P1 internalization in a time-dependent manner (Fig. 7a, b). Pre-incubation of ECs with P1 for 60 min or PMA for 30 min completely blocked P1 entering the cells (Fig. 7a, b). The inhibition of P1 internalization is correlated with PKC-α phosphorylation/activation. These observations support the notion that PKC-α negatively modulates P1 internalization.
Fig. 7.
The effects of P1/PMA pre-incubation on P1 internalization. ECs were pre-incubated in medium containing P1 for 30–60 min or PMA for 5–30 min. After they were washed, the pre-incubated ECs were incubated with Rhodamine Red-labeled P1 at 37°C for 60 min. The representative fluorescent micrographs (40×) of live cells from three separate experiments were obtained using confocal microscopy (images i–iii in a and b). The representative rainbow palette micrographs (images iv–vi in a and b) are generated on the corresponding graphs (vii–ix in a and b), respectively, and shows rhodamine red intensities of internalized peptide in cells, plotted on the scale of 01–255 for % absolute frequencies distribution of each intensity range by using the same Zeiss LSM software. Fluorescence intensities were determined using four randomly selected microscopic fields in each panel
Specific inhibition of PKC-α enhances P1 entering into ECs
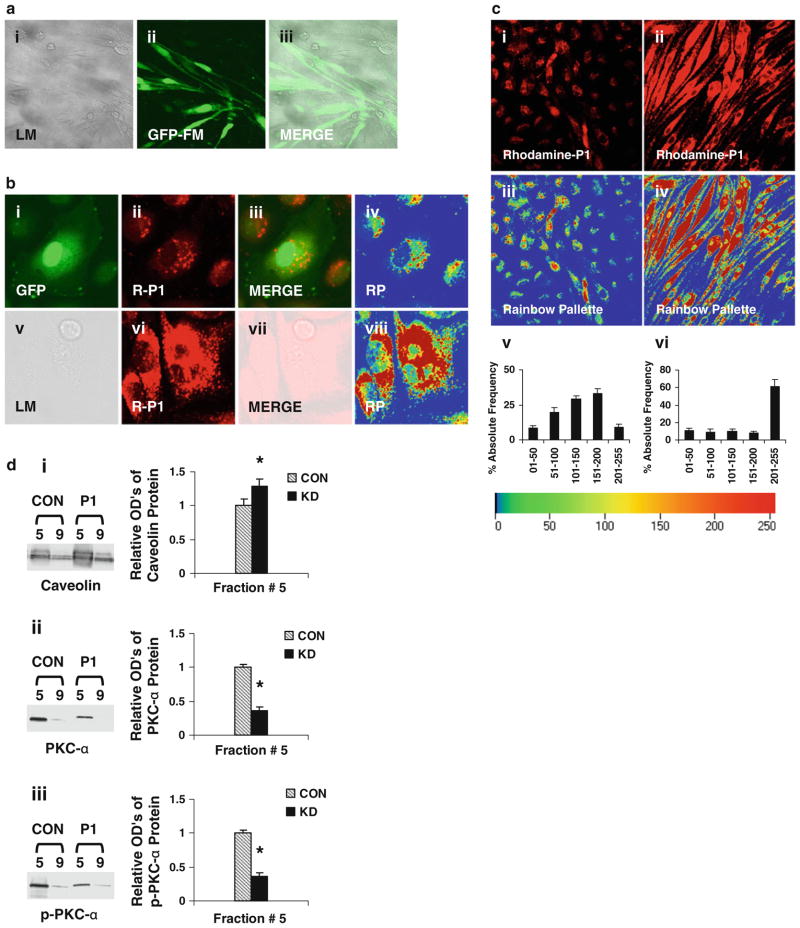
To define the role of PKC-α in modulation of P1 internalization, recombinant adenovirus containing the DN PKC-α or GFP gene was used to knockdown PKC-α expression in ECs. The fluorescent intensities of GFP in the adenovirus-infected cells were assessed to monitor the efficiency of the gene delivery. Up to 90% of ECs show GFP fluorescence (Fig. 8a), indicating the expression of the delivered genes. The levels of P1 (red) fluorescent intensities in the cells with inhibited PKC-α (images v–viii, Fig. 8b) are higher than those in control cells infected with the sham adenoviruses containing the GFP gene (images i–iv, Fig. 8b). Furthermore, the levels of P1 fluorescent intensities in the PKC-α deficient ECs are much higher than those in the control cells under a low magnification view (Fig. 8c). Rainbow palette micrographs (images iii, iv, Fig. 8c), and corresponding graphs (Fig. 8c-v, vi) shows rhodamine red intensities (measured at 543 nm) of internalized peptide in cells, plotted on the scale of 01–255 for % absolute frequency distribution of each intensity range were used to compare the intensities of internalized P1 in control and PKC-α deficient cells, confirming the negative modulation of P1 internalization by PKC-α. This observation is also supported by the fact that the diminished levels of caveolar PKC-α and p-PKC-α (Fig. 8d) in PKC-α deficient cells considerably enhanced the internalization of P1 in ECs.
Fig. 8.
PKC-α deficiency-enhanced P1 internalization. a ECs were infected with the recombinant adenoviruses containing the DN PKC-α or GFP gene. To monitor the efficiency of the gene delivery, the fluorescence intensities of GFP were examined under a confocal microscope. LM light microscopy, GFP-FM fluorescent microscopy, and MERGE the merged images of LM and GFP-FM. b ECs were infected with the recombinant adenoviruses expressing GFP or DN PKC-α. The control (images i–iv) and PKC-α deficient (images v–viii) cells were incubated in medium containing P1, and then examined under the confocal microscope. GFP the fluorescent image of GFP, R-P1 the fluorescent image of P1, and RP the rainbow palette image. c ECs were infected with recombinant adenoviruses, incubated in medium containing P1, and then examined under the confocal microscope. Image i control cells treated with labeled P1, image ii PKC-α deficient cells treated with labeled P1, images iii and iv rainbow palette of images i and ii. Quantitative analysis of corresponding intensities of images iii and iv are shown in v and vi, respectively. The intensities of internalized peptide are plotted on the scale of 01–255 for % absolute frequencies distribution of each intensity range as described in methods. d The diminished levels of PKC-α and p-PKC-α in caveolae-enriched (#5) and non-caveolae-enriched (#9) fractions from PKC-α deficient cells with or without (CON) P1-stimulation. The levels of caveolin, PKC-α, and p-PKC-α proteins in the fractions #5 and 9 were assessed using Western blot analysis (insets). The band intensities of corresponding blots were determined and shown as ODu’s (Optical Density Units/mm2). d i–iii show the levels of caveolin, PKC-α, and p-PKC-α, respectively, in the caveolar-enriched and non-caveolar fractions. Data are means ± SE; n = 4, *P < 0.05 versus control
Depletion of Ca2+ release enhances P1 internalization
The calcium chelator, BAPTA AM, was used to deplete/ scavenge to determine its effect on P1 internalization. Cells pretreated with or without (Control) BAPTA-AM in calcium-free RPMI 1640 were then incubated with Rhodamine Red-labeled P1 and fluorescence intensities were monitored by confocal microscopy. Figure 9 shows the level of P1 internalization in RPMI (Control) (a) and BAPTA-AM (b) pre-treated cells Rainbow palette micrographs of corresponding panels (c, d). The level of internalized P1 in BAPTA-AM-treated cells is several folds greater than in control.
Fig. 9.
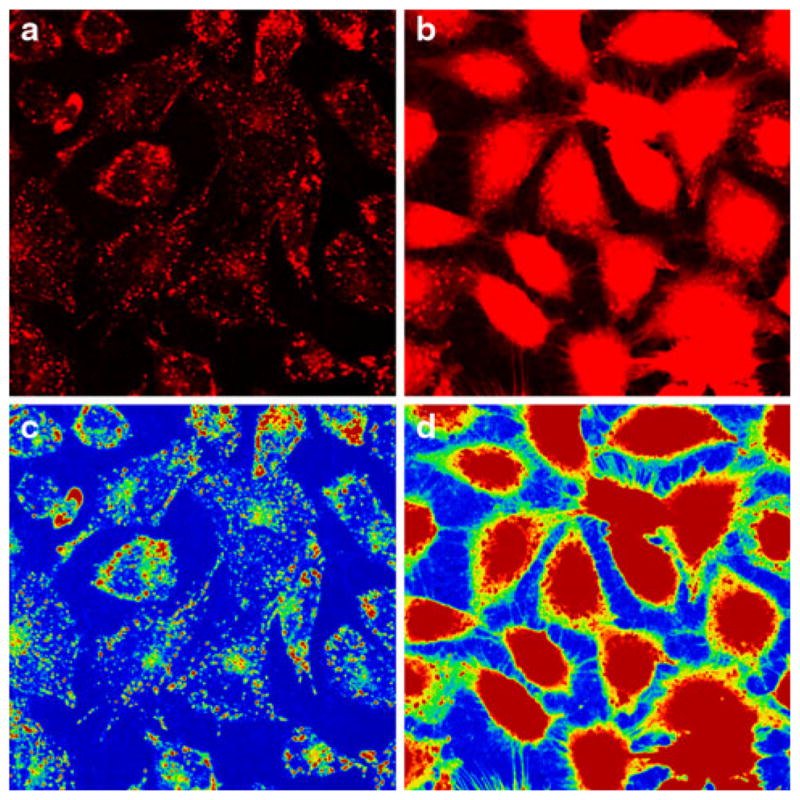
Depletion of calcium release enhanced Rhodamine Red-labeled P1 internalization. ECs were pretreated with vehicle (calcium-free RPMI 1640) or BAPTA-AM in calcium-free RPMI 1640 for 30 min, cells were then incubated in the presence of Rhodamine Red-labeled P1 or RPMI 1640 only (Control) for 60 min and examined under the confocal microscope. The representative fluorescence micrographs of two separate experiments show the level of P1 internalization in control (a) and BAPTA-AM (b) pre-treated cells. c, d Corresponding rainbow palette images
Discussion
Synthetic peptide P1 but not scrambled P1 is known to: (i) internalize in intact EC and lung tissue, (ii) activate PKC-α in intact EC, and (iii) stimulate pulmonary artery vasorelaxation through translocation and activation of eNOS [3, 4]. Since P1 internalization is critical for its functional response, the present study demonstrates that the internalization of P1 is a time-dependent process that reaches a plateau between 30 and 60 min incubation with ECs. Internalization of P1 is a caveolae-mediated event as CD/FIL, known caveolae disrupting agents [17–20], markedly abolished the process. P1-stimulation enhances phosphorylation of caveolae-specific PKC-α and intracellular Ca2+ release in intact EC. The limited internalization of P1 is regulated by both the modulation of intracellular Ca2+ release and the level of caveolar PKC-α phosphorylation in lung EC.
Caveolae are dynamic structures defined as flask-shaped invaginations of plasma membranes with diverse functions including signal transduction and endocytosis [8–10]. The existence of morphologically distinct caveolae is critical to maintain its functional integrity in EC [27, 28]. This is consistent with our results that demonstrate near total diminished internalization of P1 when cells were pretreated with caveolae disrupting agents. A number of studies have reported cavelolar localization of PKC-α in EC [11, 12, 18]. Our results demonstrate that P1 internalization is negatively associated with increased PKC-α activation/ phosphorylation. For instance, the incubation of ECs with P1 for 60 min leads to the plateau of P1 entering into the cell with a parallel increase of caveolar PKC-α phosphorylation implying that increased levels of PKC-α phosphorylation limit P1 internalization. Pre-incubation with PMA, an activator of Ca2+-dependent PKCs, mimics P1-induced PKC-α activation and inhibition of P1 internalization. Furthermore, the specific inhibition of PKC-α expression results in elevated P1 internalization. These observations demonstrate a vital role of PKC-α in modulation of P1 internalization in ECs. Based on correlative effects of the increased or decreased PKC-α phosphorylation and reduced or enhanced internalization of P1, respectively, indicate that change in internalized P1 levels may not be associated with rate of intracellular metabolism of P1. However, the precise mechanism of activation of caveolar PKC-α and its impact on the internalization process and/or potential metabolism of P1 remains to be determined.
An agonist-stimulated Ca2+ wave in ECs has been shown to originate in the caveolin-rich region and to propagate throughout the cell [29]. This is particularly important for P1-mediated regulation of Ca2+ release and increased phosphorylation of caveolar PKC-α. Our results also demonstrate that P-1 mediated Ca2+ release plays a critical role in the internalization process since calcium chelator BAPTA-AM pre-treatment enhanced P1-internalization in EC. The results of the present study are consistent with the role of Ca2+ release, activation of PKC-α, and their roles in enhancing or attenuating P1 internalization, respectively. Although it has been reported that PKC-α activation and its subsequent displacement from caveolae inhibits the internalization process of many receptors, small molecules, peptides, proteins, and viruses [10–12, 30, 31], our results indicate that P1 selectively increases phosphorylation but not displacement of caveolar PKC-α. Since modulation of caveolae structure and/or cholesterol content is known to alter caveolar function [32], it is possible that P1-stimulated activation of caveolar signaling components including enhanced phosphorylation of PKC-α can cause structural and/or conformational change in caveolae/cholerestol dynamics leading to altered transmembrane transport processes.
In summary, our findings suggest that the structural integrity of caveolae and caveolar signaling play critical roles in the regulation of the P1 transport process in ECs. The physiologic implications of the regulation of P1 transport and metabolism in ECs remains to be determined since P1 is known to enhance vasorelaxation in the pulmonary circulation. The caveolae microdomains are highly ordered structures involving cholesterol and glycosphingolipids. As such potential alterations of these microdomains under pathophysiologic conditions can be a critical factor for modulation of caveolar signaling and/or transport functions. The impact of increased phosphorylation of caveolar PKC-α on caveolae-based transport of multiple external agents also has broad implications for their physiologic responses in the pulmonary circulation.
Acknowledgments
The authors thank Mr. Humberto Herrera and Mrs. Lin Ai for their excellent technical assistance. This study was supported in part by the National Heart, lung, and Blood Institute grant HL085133 and the Department of Veterans Affairs Merit Review (JMP).
Contributor Information
Tarun E. Hutchinson, Department of Medicine, University of Florida College of Medicine, Gainesville, FL 32608-1197, USA
Jianliang Zhang, Department of Medicine, University of Florida College of Medicine, Gainesville, FL 32608-1197, USA.
Shen-Ling Xia, Department of Medicine, University of Florida College of Medicine, Gainesville, FL 32608-1197, USA. Research Service (151), Malcom Randall Department of Veterans Affairs Medical Center, 1601 S.W. Archer Road, Gainesville, FL 32608-1197, USA.
Sudeep Kuchibhotla, Department of Medicine, University of Florida College of Medicine, Gainesville, FL 32608-1197, USA.
Edward R. Block, Department of Medicine, University of Florida College of Medicine, Gainesville, FL 32608-1197, USA. Research Service (151), Malcom Randall Department of Veterans Affairs Medical Center, 1601 S.W. Archer Road, Gainesville, FL 32608-1197, USA
Jawaharlal M. Patel, Email: Pateljm@medicine.ufl.edu, Department of Medicine, University of Florida College of Medicine, Gainesville, FL 32608-1197, USA. Research Service (151), Malcom Randall Department of Veterans Affairs Medical Center, 1601 S.W. Archer Road, Gainesville, FL 32608-1197, USA
References
- 1.Joliot A, Prochiantz A. Transduction peptides: from technology to physiology. Nat Cell Biol. 2004;6:189–196. doi: 10.1038/ncb0304-189. [DOI] [PubMed] [Google Scholar]
- 2.Poon GM, Gariépy J. Cell-surface proteoglycans as molecular portals for cationic peptide and polymer entry into cells. Biochem Soc Trans. 2007;35:788–793. doi: 10.1042/BST0350788. [DOI] [PubMed] [Google Scholar]
- 3.Hu H, Xin M, Belayev LL, Zhang J, Block ER, Patel JM. Autoinhibitory domain fragment of endothelial NOS enhances pulmonary artery vasorelaxation by the NO-cGMP pathway. Am J Physiol Lung Cell Mol Physiol. 2004;286:L1066–L1074. doi: 10.1152/ajplung.00378.2003. [DOI] [PubMed] [Google Scholar]
- 4.Hutchinson TE, Kuchibhotla S, Block ER, Patel JM. Peptide-stimulation enhances compartmentalization and the catalytic activity of lung endothelial NOS. Cell Physiol Biochem. 2009;24:471–482. doi: 10.1159/000257487. [DOI] [PMC free article] [PubMed] [Google Scholar]
- 5.Yamada E. The fine structure of the gall bladder epithelium of the mouse. J Biophys Biochem Cytol. 1955;1:445–458. doi: 10.1083/jcb.1.5.445. [DOI] [PMC free article] [PubMed] [Google Scholar]
- 6.Palade GE. Fine structure of blood capillaries. J Appl Phys. 1953;24:1424–1436. [Google Scholar]
- 7.Thorn H, Stenkula KG, Karlsson M, Ortegren U, Nystrom FH, Gustavsson J, Stralfors P. Cell surface orifices of caveolae and localization of caveolin to the necks of caveolae in adipocytes. Mol Biol Cell. 2003;14:3967–3976. doi: 10.1091/mbc.E03-01-0050. [DOI] [PMC free article] [PubMed] [Google Scholar]
- 8.Rothberg KG, Heuser JE, Donzell WC, Ying YS, Glenney JR, Anderson RG. Caveolin, a protein component of caveolae membrane coats. Cell. 1992;68:673–682. doi: 10.1016/0092-8674(92)90143-z. [DOI] [PubMed] [Google Scholar]
- 9.Lisanti MP, Scherer PE, Vidugiriene J, Tang Z, Hermanowski-Vosatka A, Tu YH, Cook RF, Sargiacomo M. Characterization of caveolin-rich membrane domains isolated from an endothelial-rich source: implications for human disease. J Cell Biol. 1994;126:111–126. doi: 10.1083/jcb.126.1.111. [DOI] [PMC free article] [PubMed] [Google Scholar]
- 10.Smart EJ, Ying YS, Anderson RG. Hormonal regulation of caveolae internalization. J Cell Biol. 1995;131:929–938. doi: 10.1083/jcb.131.4.929. [DOI] [PMC free article] [PubMed] [Google Scholar]
- 11.Smart EJ, Foster DC, Ying YS, Kamen BA, Anderson RG. Protein kinase C activators inhibit receptor-mediated potocytosis by preventing internalization of caveolae. J Cell Biol. 1994;124:307–313. doi: 10.1083/jcb.124.3.307. [DOI] [PMC free article] [PubMed] [Google Scholar]
- 12.Oka N, Yamamoto M, Schwencke C, Kawabe J, Ebina T, Ohno S, Couet J, Lisanti MP, Ishikawa Y. Caveolin interaction with protein kinase C. Isoenzyme-dependent regulation of kinase activity by the caveolin scaffolding domain peptide. J Biol Chem. 1997;272:33416–33421. doi: 10.1074/jbc.272.52.33416. [DOI] [PubMed] [Google Scholar]
- 13.Hutchinson T, Dwivedi K, Rastogi A, Prasad R, Pereira BM. N-acetyl beta-D-glucosaminidase is not attached to human sperm membranes through the glycosylphosphatidyl inositol (GPI)-anchor. Asian J Androl. 2002;4:27–33. [PubMed] [Google Scholar]
- 14.Lobie PE, Sadir R, Graichen R, Mertani HC, Morel G. Caveolar internalization of growth hormone. Exp Cell Res. 1999;246:47–55. doi: 10.1006/excr.1998.4288. [DOI] [PubMed] [Google Scholar]
- 15.Schnitzer JE, Oh P, Pinney E, Allard J. Filipin-sensitive caveolae-mediated transport in endothelium: reduced transcytosis, scavenger endocytosis, and capillary permeability of select macromolecules. J Cell Biol. 1994;127:1217–1232. doi: 10.1083/jcb.127.5.1217. [DOI] [PMC free article] [PubMed] [Google Scholar]
- 16.Sathish V, Yang B, Meuchel LW, Vanoosten SK, Ryu AJ, Thompson MA, Prakash YS, Pabelick CM. Caveolin-1 and force regulation in porcine airway smooth muscle. Am J Physiol Lung Cell Mol Physiol. 2011;300:L920–L929. doi: 10.1152/ajplung.00322.2010. [DOI] [PMC free article] [PubMed] [Google Scholar]
- 17.Kozera L, White E, Calaghan S. Caveolae act as membrane reserves which limit mechanosensitive I(Cl, swell) channel activation during swelling in the rat ventricular myocyte. PLoS One. 2009;4:e8312. doi: 10.1371/journal.pone.0008312. [DOI] [PMC free article] [PubMed] [Google Scholar]
- 18.Webb BL, Hirst SJ, Giembycz MA. Protein kinase C isoenzymes: a review of their structure, regulation and role in regulating airways smooth muscle tone and mitogenesis. Br J Pharmacol. 2000;130:1433–1452. doi: 10.1038/sj.bjp.0703452. [DOI] [PMC free article] [PubMed] [Google Scholar]
- 19.Partovian C, Zhuang Z, Moodie K, Lin M, Ouchi N, Sessa W, Walsh K, Simons M. PKCalpha activates eNOS and increases arterial blood flow in vivo. Circ Res. 2005;97:482–487. doi: 10.1161/01.RES.0000179775.04114.45. [DOI] [PubMed] [Google Scholar]
- 20.Koivunen J, Aaltonen V, Koskela S, Lehenkari P, Laato M, Peltonen J. Protein kinase C alpha/beta inhibitor Go6976 promotes formation of cell junctions and inhibits invasion of urinary bladder carcinoma cells. Cancer Res. 2004;64:5693–5701. doi: 10.1158/0008-5472.CAN-03-3511. [DOI] [PubMed] [Google Scholar]
- 21.Hutchinson TE, Rastogi A, Prasad R, Pereira BM. Phospholipase-C sensitive GPI-anchored proteins of goat sperm: possible role in sperm protection. Anim Reprod Sci. 2005;88:271–286. doi: 10.1016/j.anireprosci.2004.12.012. [DOI] [PubMed] [Google Scholar]
- 22.Sukumaran SK, Quon MJ, Prasadarao NV. Escherichia coli K1 internalization via caveolae requires caveolin-1 and protein kinase Calpha interaction in human brain microvascular endothelial cells. J Biol Chem. 2002;277:50716–50724. doi: 10.1074/jbc.M208830200. [DOI] [PubMed] [Google Scholar]
- 23.Patel JM, Edwards DA, Block ER, Raizada MK. Effect of nitrogen dioxide on surface membrane fluidity and insulin receptor binding of pulmonary endothelial cells. Biochem Pharmacol. 1988;37:1497–1507. doi: 10.1016/0006-2952(88)90011-1. [DOI] [PubMed] [Google Scholar]
- 24.Song KS, Shengwen Li, Okamoto T, Quilliam LA, Sargiacomo M, Lisanti MP. Co-purification and direct interaction of Ras with caveolin, an integral membrane protein of caveolae microdomains. Detergent-free purification of caveolae microdomains. J Biol Chem. 1996;271:9690–9697. doi: 10.1074/jbc.271.16.9690. [DOI] [PubMed] [Google Scholar]
- 25.Sprenger RR, Speijer D, Back JW, De Koster CG, Pannekoek H, Horrevoets AJ. Comparative proteomics of human endothelial cell caveolae and rafts using two-dimensional gel electrophoresis and mass spectrometry. Electrophoresis. 2004;25:156–172. doi: 10.1002/elps.200305675. [DOI] [PubMed] [Google Scholar]
- 26.Winer BJ. Statistical principles in experimental design. McGraw-Hill; New York: 1991. pp. 210–219. [Google Scholar]
- 27.Drab M, Verkade P, Elger M, Kasper M, Lohn M, Lauterbach B, Menne J, Lindschau C, Mende F, Luft FC, Schedl A, Haller H, Kurzchalia TV. Loss of caveolae, vascular dysfunction, and pulmonary defects in caveolin-1 gene-disrupted mice. Science. 2001;293:2449–2452. doi: 10.1126/science.1062688. [DOI] [PubMed] [Google Scholar]
- 28.Zhao YY, Liu Y, Stan RV, Fan L, Gu Y, Dalton N, Chu PH, Peterson K, Ross J, Jr, Chien KR. Defects in caveolin-1 cause dilated cardiomyopathy and pulmonary hypertension in knockout mice. Proc Natl Acad Sci. 2002;99:11375–11380. doi: 10.1073/pnas.172360799. [DOI] [PMC free article] [PubMed] [Google Scholar]
- 29.Isshiki M, Ando J, Korenaga R, Kogo H, Fujimoto T, Fujita T, Kamiya A. Endothelial Ca2+ waves preferentially originate at specific loci in caveolin-rich cell edges. Proc Natl Acad Sci. 1998;95:5009–5014. doi: 10.1073/pnas.95.9.5009. [DOI] [PMC free article] [PubMed] [Google Scholar]
- 30.Hoover RK, Toews ML. Activation of protein kinase C inhibits internalization and downregulation of muscarinic receptors in 1321N1 human astrocytoma cells. J Pharmacol Exp Ther. 1990;253:185–191. [PubMed] [Google Scholar]
- 31.Cha SK, Wu T, Huang CL. Protein kinase C inhibits caveolae-mediated endocytosis of TRPV5. Am J Physiol Renal Physiol. 2008;294:F1212–F1221. doi: 10.1152/ajprenal.00007.2008. [DOI] [PubMed] [Google Scholar]
- 32.Liu J, Oh P, Horner T, Rogers RA, Schnitzer JE. Organized endothelial cell surface signal transduction in caveolae distinct from glycosylphosphatidylinositol-anchored protein microdomains. J Biol Chem. 1997;272:7211–7222. doi: 10.1074/jbc.272.11.7211. [DOI] [PubMed] [Google Scholar]


