Abstract
Electrochemical measurement of transmitter or hormone release from individual cells on microchips has applications both in basic science and drug screening. High-resolution measurement of quantal exocytosis requires the working electrode to be small (cell-sized) and located in immediate proximity to the cell. We examined the ability of candidate electrode materials to promote the attachment of two hormone-secreting cell types as a mechanism for targeting cells for to recording electrodes with high precision. We found that nitrogen-doped diamond-like carbon (DLC:N) promoted cell attachment relative to other materials tested in the rank order of DLC:N > In2O3/SnO2 (ITO), Pt > Au. In addition, we found that treating candidate electrode materials with polylysine did not increase attachment of chromaffin cells to DLC:N, but promoted cell attachment to the other tested materials. We found that hormone-secreting cells did not attach readily to Teflon AF as a potential insulating material, and demonstrated that patterning of Teflon AF leads to selective cell targeting to DLC:N “docking sites”. These results will guide the design of the next generation of biochips for automated and high-throughput measurement of quantal exocytosis.
Keywords: INS-1 cells, Cell adhesion, Contact angle, Diamond-like carbon, BioMEMS, Chromaffin cells
1. Introduction
The development of high-throughput assays for probing the function of individual cells is an important research priority. Single-cell assays are particularly informative because they can capture the stimulus–response relationship much more precisely than assays from cell populations where cells often respond in an heterogeneous and asynchronous manner (see Ref. [1] for a review). A popular single-cell assay of transmitter release is carbon-fiber amperometry, whereby a carbon-fiber electrochemical electrode measures the current that accompanies oxidation of electroactive substances released from the cell (reviewed in Ref. [2]). Cells release transmitter in discrete packets, a process called “quantal exocytosis”, as intracellular vesicles fuse with the cell membrane and release their contents. If the electrode is placed immediately adjacent to a cell, then spikes of current resulting from release from individual vesicles can be detected. The time course of these spikes in current gives detailed information about the process of quantal exocytosis, this has contributed greatly to our understanding of this important biological process [3]. Carbon-fiber amperometry is fairly labor-intensive, however, because it requires manually positioning microelectrodes to cells under a microscope.
Our group and others are developing microchip devices to assay quantal exocytosis that offer the potential for high throughput in order to increase the pace of basic research and enable screening of drugs that affect exocytosis [4–9]. In order to resolve quantal exocytosis, the size of the working area of the electrode must be small (~cell sized) and the cells must be positioned immediately adjacent to the working electrochemical electrode. Various approaches based on microfluidics have been used to target cells to specified regions on a microchip ([8,10–12] and our own unpublished results), but this form of positioning may introduce forces on the cell membrane that can affect exocytosis. Approaches based on micropatterning cell-attachment molecules have also been used to pattern cells on microchips, but these methods are not always appropriate for aligning cells in registry with electrodes (e.g., “microcontact printing” [13]) or may passivate electrodes (e.g., self-assembled monolayers on gold [14]).
We are pursuing a material-based “self alignment” approach with the goal that cells attach to electrochemical electrodes following some time in culture, yet adhere much less readily to the material used to insulate inactive areas of the chip. Cell attachment to artificial substrates has been extensively studied (see Ref. [15] for a review), but there are significant differences in cell-attachment properties among different cell types and culture conditions. Therefore, it is essential to study cell attachment with the neuroendocrine cell types and culture conditions that are specific for our exocytosis application. We studied attachment of primary bovine adrenal chromaffin cells as the most widely used cell type for electrochemical studies of quantal exocytosis as well as the murine INS-1 insulin-secreting cell line. The cell types were chosen to be complementary in their origin (primary versus propagated cell line), source animal (cattle versus mouse) and secreted hormones (catecholamines versus insulin). We chose nitrogen-doped diamond-like carbon (DLC:N), In2O3/SnO2 (ITO), platinum and gold, as potential electrochemical electrode materials, since each of these materials have recently been used to measure quantal exocytosis [4,5,16,17]. We also studied cell attachment to Teflon AF as an excellent insulating material to prevent cell attachment to inactive areas of the chip so that electrochemical signals only originate from the individual cell bound to each of the electrode “docking sites”.
2. Materials and methods
2.1. Deposition of potential electrode materials
All conductive materials were deposited using a magnetron sputtering system (ATC2000, AJA International Inc., North Scituate, MA, USA). Microscope glass slides (25 mm × 75 mm), purchased from Fisher Scientific (Waltham, MA, USA) were used as substrates for all depositions. The slides were cleaned by soaking in a 3:1 mixture of sulphuric acid and hydrogen peroxide (piranha solution) for 10 min at room temperature followed by rinsing in purified water (Millipore, Billerica, MA) and then dried with a nitrogen stream. The slides were then taped onto a silicon wafer for deposition by magnetron sputtering. Prior to film deposition, the substrates were also sputter cleaned by biasing the substrate holder for about 1–2 min at a pressure of 4 mTorr and a RF power of 40 W. The chamber base pressure was about 5 × 10⁻⁷ Torr. Gas flow was regulated by mass-flow controllers.
ITO was deposited using an ITO target (In2O3/SnO2, with 10% SnO2 by weight, 75 mm diameter, 3 mm thick, 99.99% purity, Williams Advanced Materials Inc.). An RF power supply was used at a radio frequency of 13.56 MHz and a power of 180 W. The 20 sccm argon gas flow was regulated by a mass-flow controller and maintained at a working pressure of 4 mTorr. The substrate temperature was maintained at 50 °C and the deposition time was 20 min to result in a 100 nm-thick ITO film.
DLC:N films were deposited on top of ITO films to obtain the surface properties of DLC:N together with the high conductivity and transparency of the underlying ITO. The nitrogen is incorporated in DLC to reduce the ohmic resistance and increase its suitability for use as an electrochemical electrode. A graphite sputter target (Williams Advanced Materials Inc., Buffalo, NY, USA) with 99.99% purity, 75 mm in diameter and 3 mm thick was the carbon source. Sputtering of the two films was sequential without breaking the vacuum using a multi-target source with independent power supplies. For depositing DLC, the power supply was switched to a DC source of 400 W while maintaining the same temperature of 50 °C. Gas flow rates were 15 sccm for Ar and 5 sccm for N2 and a pressure of 2 mTorr was maintained for the deposition of DLC:N. Deposition time of 15 min resulted in a 25 nm-thick DLC:N film. The thickness of the films was measured using a profiler (Alpha step 200, Tencor, San Jose, CA, USA).
In order to test the nitrogen content of our DLC:N films we deposited films of 100 nm thickness both on glass and Si substrates to ensure that the measurement was independent of the substrate used. The nitrogen and carbon contents were measured using SEM–EDS (scanning electron microscope–energy dispersive spectroscopy). Measurements were compared with standards with predetermined elemental content. The measurements were repeated three or more times on each substrate. The nitrogen content of the film was found to be 30 At.%.
Platinum of thickness 100 nm was deposited by supplying an RF power of 90 W to a platinum target. The argon flow rate was 20 sccm under chamber pressure of 4 mTorr and the deposition was carried out at ambient temperature. Gold deposition requires an adhesion layer of titanium. This base layer of 50 nm was deposited by supplying RF power of 100 W to a titanium target, with an argon flow rate of 30 sccm, a chamber pressure of 4 mTorr and the deposition was carried out at ambient temperature. Gold deposition was done without breaking the vacuum at the same chamber pressure, substrate temperature and argon flow rate by switching the RF power supply of 100 W to the gold target. The thickness of the gold film was 100 nm.
2.2. Deposition and patterning of Teflon AF films
Substrates were prepared by spin coating 5% FSM 660 (3M, St. Paul, MN, USA) as an adhesion layer at 3500 rpm for 30 s on glass slides followed by baking at 100 °C for 10 min. 2% Teflon AF (DuPont, Wilmington, DE, USA) in FC-75 (3 m) solution was then spun on it at 3000 rpm for 30 s followed by baking in three steps: 115 °C for 15 min, 230 °C for 15 min and 300 °C for 1 h.
For patterning Teflon AF, coated substrates were spin coated at 3000 rpm with S 1813 (Rohm and Haas, USA) photoresist for 30 s followed by a bake of 1 min. This process was repeated another time to cover any pinholes that remained on the substrate after the first coat of photoresist. Transparency masks (Output City, OR, USA) were used to pattern the Teflon-coated substrate using mask alligner (OAI Model 200 IR) with UV exposure of 14 s. The photoresist was developed with MF 321 (Rohm and Haas, USA) developer for 1 min 40 s, washed with DI water and blow dried with air to remove the moisture. The openings on this patterned substrate were created using PECVD (Precision 5000 mark II Applied materials) etch. It was etched using a flow rate of 40 sccm for CF4 and 30 sccm for CHF3 and creating a plasma at 1000 W and 250 mTorr. The etching time depended on the thickness of the Teflon AF film. For a 2% film the average thickness was 250 nm. The final step was to perform lift-off of S1813 photoresist using acetone during sonication for ~1 min. The device obtained was washed with ethanol and DI water and blow dried.
2.3. Substrate and gasket processing
All substrates were taken out of a storage desiccator and cut into 4 pieces (25 mm × 18 mm) using a diamond knife. Each sample was rinsed meticulously in steps of acetone, 90% ethanol and 18.2 MΩ Millipore water, and then blown dry. For polylysine coating, 5 mg poly-d-lysine hydrobromide (Sigma, St. Louis, MO, USA) was dissolved in 25 ml of purified water. Substrates to be coated were dipped in poly-d-lysine (PDL) solution for 20–30 min before being washed with purified water on a rocking shaker set at 100 rocks/min for 5 min. Further washing was done on a 3D-rotator set at 60 rpm for 2 min. The substrates were left to dry in the laminar flow hood.
Gaskets were made of poly(dimethyl siloxane) (PDMS, Dow Corning Corp., Midland, MI, USA). The curing agent was mixed with the monomer in a ratio of 1:3, degassed in a vacuum to remove bubbles, and poured onto a Petri dish. The mixture was then baked in an oven at 60 °C for 45 min to make a ~3 mm–thick slab. The slab was cut into gaskets or wells by using a pair of hollow punches with diameters of 5 and 12 mm to yield several gaskets with an opening diameter of 5 mm. Samples and PDMS gaskets were sterilized with UV light for 1 h. Two gaskets are sealed to each sample using vacuum grease (Dow Corning) applied with a cotton swab.
2.4. Contact angle measurements
The sessile drop method was used for contact angle analysis using deionized water. The sample was mounted on an X–Y stage illuminated by a lamp. A droplet of deionized water (5 µl, measured using a pipette) was formed at the end of the pipette tip and lowered onto the surface of the sample, and the pipette withdrawn when the drop detached. Images were recorded by a digital video camera (Sony DFW SX-900). The images were analyzed using NIH ImageJ software. Three different areas were measured for each sample. All measurements were performed at ambient temperature.
2.5. Cell isolation and culture
2.5.1. Bovine chromaffin cell culture
Chromaffin cells were harvested from bovine adrenal glands as recently described [18]. Following purification, the cell density was measured using a hemocytometer and the cell suspension was then diluted to a final concentration of 106 cells/ml in culture medium (Dulbecco’s modified eagles medium supplemented with 10% (v/v) fetal bovine serum and 1% penicillin/streptomycin). The cell suspension was maintained in a plastic centrifuge tube on an ice bath until the substrates were ready for plating. Cells were mixed with a pipette before plating onto the substrates within several hours after completing the isolation.
2.5.2. INS-1 cell line culture
The INS-1 cell line was established from cells isolated from an X-ray-induced rat transplantable insulinoma. These cells were a kind gift from C. Wollheim, University of Geneva, Switzerland, and were maintained as described in Ref. [19]. In short, these cells were maintained in culture media consisting of RPMI 1640 medium supplemented with 50 µm 2-mercaptoethanol (Acros Organics), 2 mm l-glutamine, 10 mm HEPES, 100 units/ml penicillin, 100 g/ml streptomycin, 1 mm sodium pyruvate and 10% fetal bovine serum. The cells were cultured in 25 cm2 tissue culture flasks and incubated at 37 °C in 5% CO2, 95% air. The medium was replaced every other day and cells were subcultured once per week when they reached the 90–95% confluence level. INS-1 cells used for cell-attachment studies were procured during subculture. During subculture, the medium was aspirated and 1 ml of trypsin/EDTA (0.05% trypsin with EDTA 4Na,1×; University of Missouri Cell Core)was added to the flask. After cells had detached, serum-containing medium was added to inactivate the trypsin. Additional cells were detached by triturating several times. The cell suspension was then centrifuged at 2000 rpm for 7 min followed by aspiration of medium and resuspension of pellet into fresh medium. The cell density was measured with a hemocytometer and diluted to a final concentration of 106 cells/ml and preserved in a plastic centrifuge tube on an ice bath until the cells were plated onto the test substrates within several hours.
2.6. Adhesion assay
The cell suspension was triturated with the pipette to ensure a uniform cell concentration immediately before pipetting 50 µl of cell suspension into each well. In experiments using bovine chromaffin cells, the samples were incubated overnight (18–20 h) in a humidified incubator at a temperature of 37 °C in 5% CO2 before cell counting. In experiments using INS-1 cells the samples were left in the incubator for 2 h before cell counting.
2.7. Cell viability assay
The samples were taken out of the incubator after the prescribed time and then the medium was aspirated with a pipette and the samples rinsed with fresh warm medium twice to wash off any unattached or loosely bound cells. Attached cells were subjected to a trypan blue assay of cell viability by adding a mixture of 3:2 chromaffin medium with trypan blue in each well and then allowing the mixture to stand for 5 min at ambient temperature. After staining, the trypan blue mixture was replaced with fresh medium and the cells were examined under an inverted microscope (IX71, Olympus, Tokyo, Japan). Healthy appearing cells not stained with trypan blue were considered to be viable, whereas trypan blue stained cells were assumed to have a compromised plasma membrane and thus be non-viable. Images were acquired with a digital camera (DCM130, Nanjing Jiangnan Novel Optics Co., Ltd.) inserted into the eyepiece tube of the microscope. Images of dimensions 440 µm × 330 µm were captured. A series of 9–11 continuous images along the complete equatorial line of the gasket were acquired as a representative sample of attached cells.
2.8. Cell evaluation and statistical analysis
The total number of adherent cells categorized as alive and dead (stained blue) were manually counted using the Adobe Photoshop CS3 count tool (Redwood City, California) from each of the images that were captured. The sample data are presented as the average of images obtained and the error bars represent the standard error of the mean (SE). Sample results were analyzed using student’s two-sample t-test. In the figures a single asterisk indicates p < 0.05 whereas a double asterisk indicates p < 0.01. Statistical analysis was performed using OriginPro 8.0 (OriginLab Corporation, Northampton, MA).
3. Results
3.1. Cell attachment
Cell attachment was determined on all substrates with and without poly-d-lysine because polylysines are commonly used to promote attachment of cultured endocrine cells and neurons to glass substrates and we have previously observed that a polylysine film does not passivate electrochemical electrodes [16]. We added a 50 µl drop of cell suspension containing 50,000 cells on each substrate and then placed the assembly in an incubator for either 2 h (INS-1 cells) or 18–20 h (chromaffin cells) to allow time for the cells to attach to the substrate. Following rinse of the media and trypan blue staining for cell viability, adherent cells falling along the equatorial line of the drop were imaged and counted.
3.1.1. Attachment of INS-1 cells to test substrates
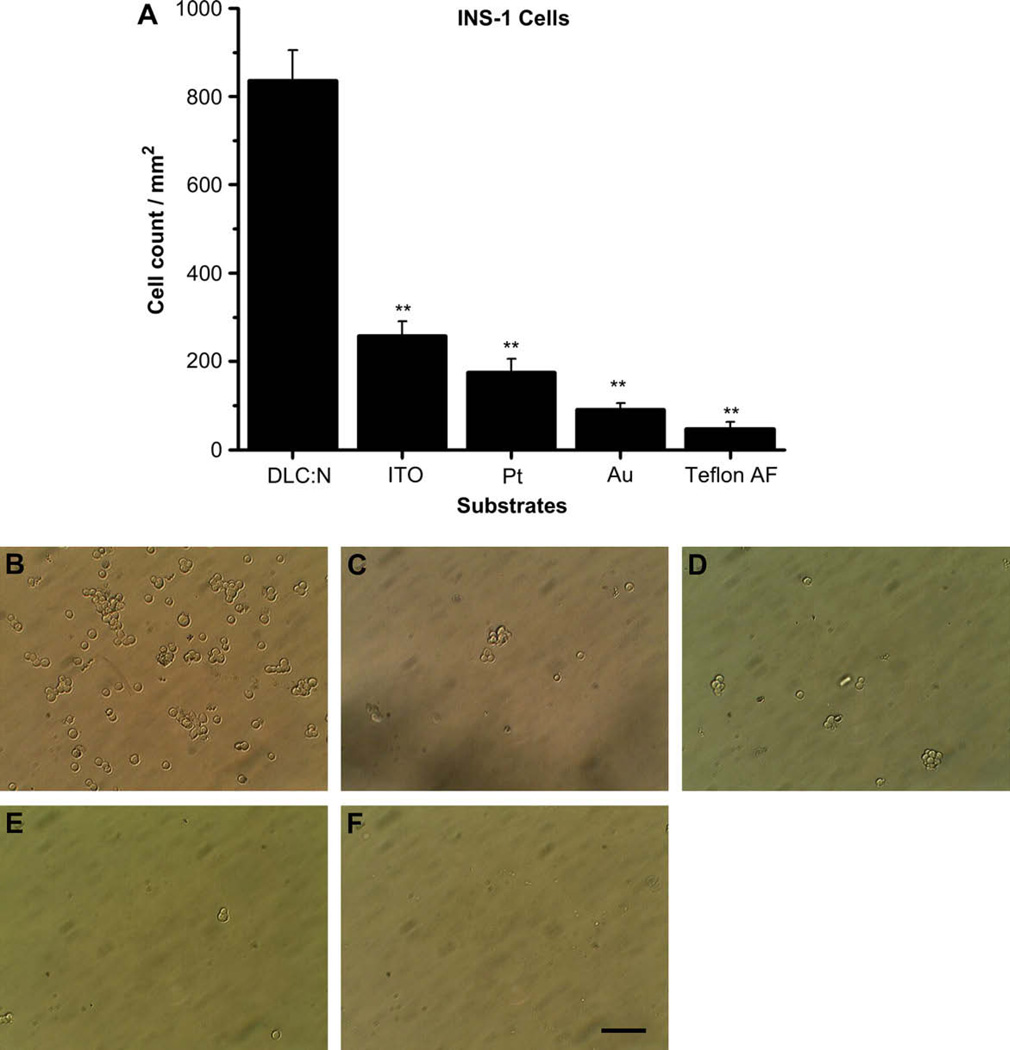
The insulin-secreting INS-1 cell line was originally derived from a mouse tumor and has been widely used to study insulin secretion (e.g., [19,20]). We found that the number of dead cells identified with trypan blue staining was negligible under our culture conditions for all substrates tested; therefore, we did not quantify the density of dead adherent cells. The density of adherent cells to each tested substrate is summarized in Fig. 1A whereas sample images are presented in Fig. 1B–E and F. The density of adherent cells was significantly greater for DLC:N than all other tested candidate electrode materials (p < 0.01) whereas the attachment of cells to the Teflon AF insulating material was essentially negligible. We noted that DLC:N not only had the highest density of adherent cells but also the cells appeared to spread out and elongate more compared to the other substrates (Fig. 1B). Cell spreading and elongation are normally seen when culturing INS-1 cells on polylysine-coated glass or in tissue culture flasks.
Fig. 1.
INS-1 cells adhere more readily to DLC:N than to the other tested electrode or insulating materials. (A) Cell density (cells/mm2) is presented as the mean ± SE from at least 40 images taken from 4 samples of each substrate in two different cell passages. ** Indicates the sample differs from DLC:N with p < 0.01. Images represent micrographs of INS-1 cells adherent to (B) DLC:N, (C) ITO, (D) Pt, (E) Au, (F) Teflon AF. Scale Bar represents 50 µm.
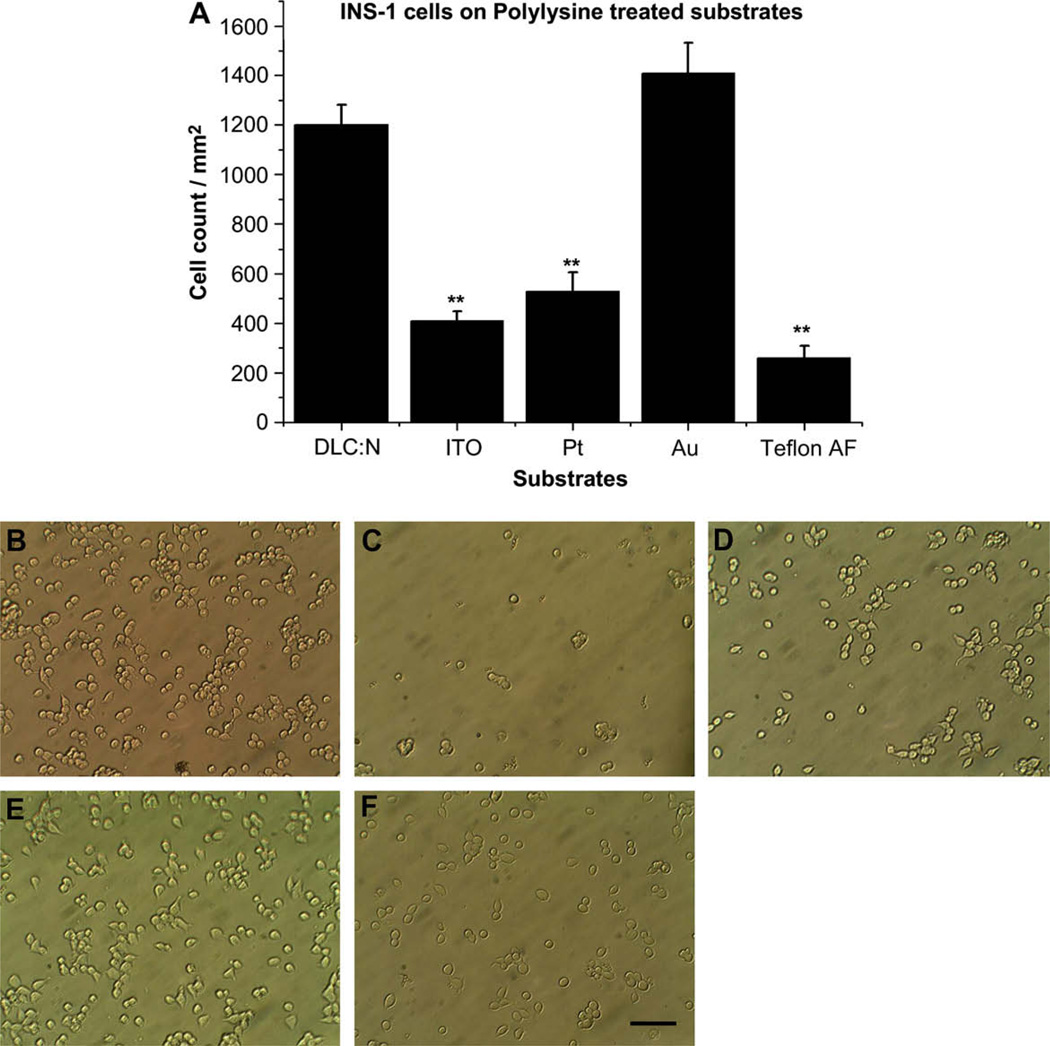
Fig. 2A presents cell adhesion density following treatment of each substrate with poly-d-lysine whereas Fig. 2B–E, and F presents sample images. Polylysine increased the average density of adherent cells for all test substrates, but the effect was most dramatic for Au (15-fold increase) and Teflon AF (fivefold increase), whereas the mean increase for DLC:N was only 40%. The difference in adherent cell density was not significantly different between DLC:N and Au following polylysine treatment (p = 0.16) whereas these two substrates supported cell attachment better than the other three substrates (p < 0.01).
Fig. 2.
Poly-d-lysine promotes attachment of INS-1 cells to Au and other tested materials. Each substrate was treated with poly-d-lysine as described in Section 2. (A) Cell density (cells/mm2) is presented as the mean ± SE from at least 40 images taken from 4 samples of each substrate in two different cell passages. ** Indicates the sample differs from DLC:N with p < 0.01. Micrographs of INS-1 cells adherent to polylysine-treated (B) DLC:N, (C) ITO, (D) Pt, (E) Au, (F) Teflon AF. Scale Bar represents 50 µm.
3.1.2. Attachment of chromaffin cells
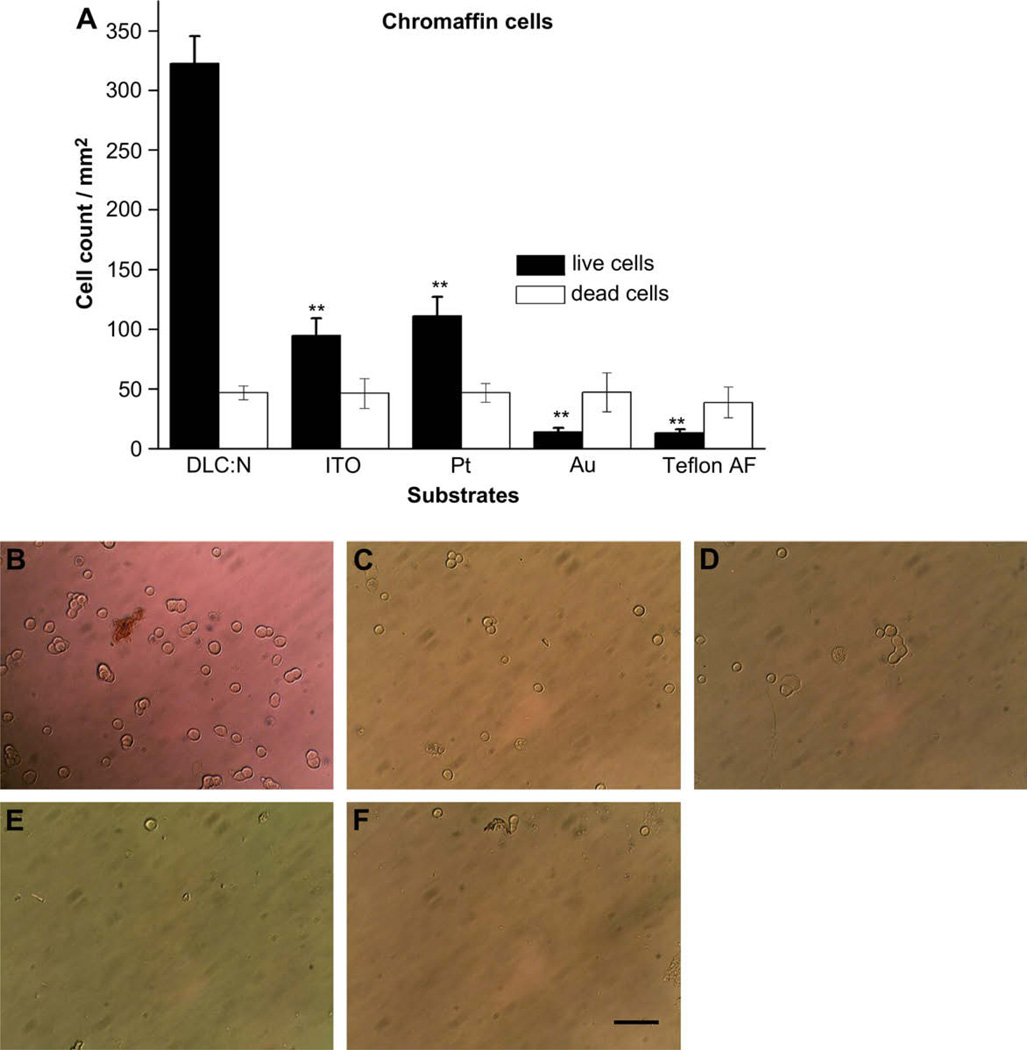
Chromaffin cells from the adrenal medulla secrete catecholamines in response to membrane depolarization and secretion from these cells is readily detected using electrochemical microelectrodes. We isolated chromaffin cells from cattle in order to have a plentiful source of this widely used cell model. Viable cells are enriched following centrifugation on a percoll gradient during the isolation procedure [18], nevertheless, a small number of dead cells are inevitably contained in the final cell suspension. We used trypan blue staining to identify dead cells that take up the dye and quantified both viable (non-stained) and dead (stained) cells following overnight culture on the test substrates. Fig. 3 summarizes adherent cell densities for both live and dead chromaffin cells on the four test substrates. As was the case with INS-1 cells, chromaffin cells adhere to DLC:N much better than to ITO and Pt, whereas adhesion of viable cells to Au and Teflon AF is negligible (p < 0.01 for all test substrates compared to DLC:N). Note that the number of adherent dead cells does not differ greatly between the substrates tested.
Fig. 3.
Viable adrenal chromaffin cells adhere more readily to DLC:N than to the other tested electrode or insulating materials. (A) Cell density (cells/mm2) is presented as the mean ± SE from at least 40 images taken from 4 samples of each substrate in two different cell preparations. Trypan blue staining was used to quantify adherent dead cells as described in Section 2. ** Indicates the sample differs from DLC:N with p < 0.01. Micrographs of chromaffin cells adherent to (B) DLC:N, (C) ITO, (D) Pt, (E) Au, (F) Teflon AF. Scale Bar represents 50 µm.
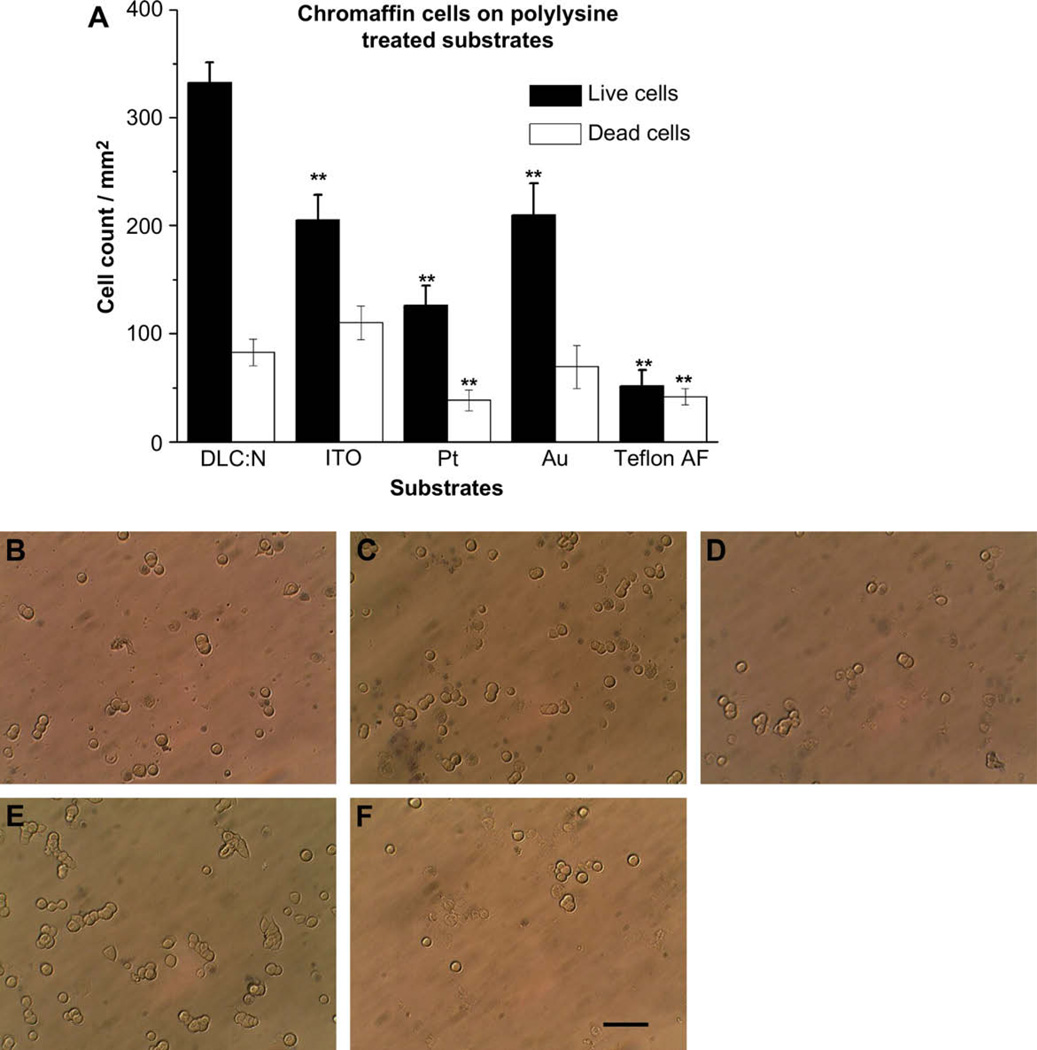
Fig. 4 presents chromaffin cell adhesion data obtained following treatment of substrates with poly-d-lysine. Similar to the case with INS-1 cells, the most dramatic improvement in cell attachment introduced by the polylysine film was for the case of the Au and Teflon AF substrates. On the other hand, polylysine treatment did not significantly increase the number of viable adherent chromaffin cells for the DLC:N substrate (p = 0.76). Despite the increase in chromaffin cell attachment to Au following polylysine treatment, the adherent cell density was less than that of DLC:N (p < 0.01). In fact, viable chromaffin cell attachment to DLC:N was significantly greater than attachment to all four of the other tested substrates regardless of whether they were treated with polylysine or not (p < 0.01).
Fig. 4.
Poly-d-lysine promotes attachment of viable chromaffin cells to metals and Teflon AF Au, but not to DLC:N. Each substrate was treated with poly-d-lysine as described in Section 2. (A) Cell density (cells/mm2) is presented as the mean ± SE from at least 40 images taken from 4 samples of each substrate in two different cell preparations. ** Indicates the sample differs from DLC:N with p < 0.01. Micrographs of chromaffin cells adherent to polylysine-treated (B) DLC:N, (C) ITO, (D) Pt, (E) Au, (F) Teflon AF. Scale Bar represents 50 µm.
3.2. Contact angle measurements
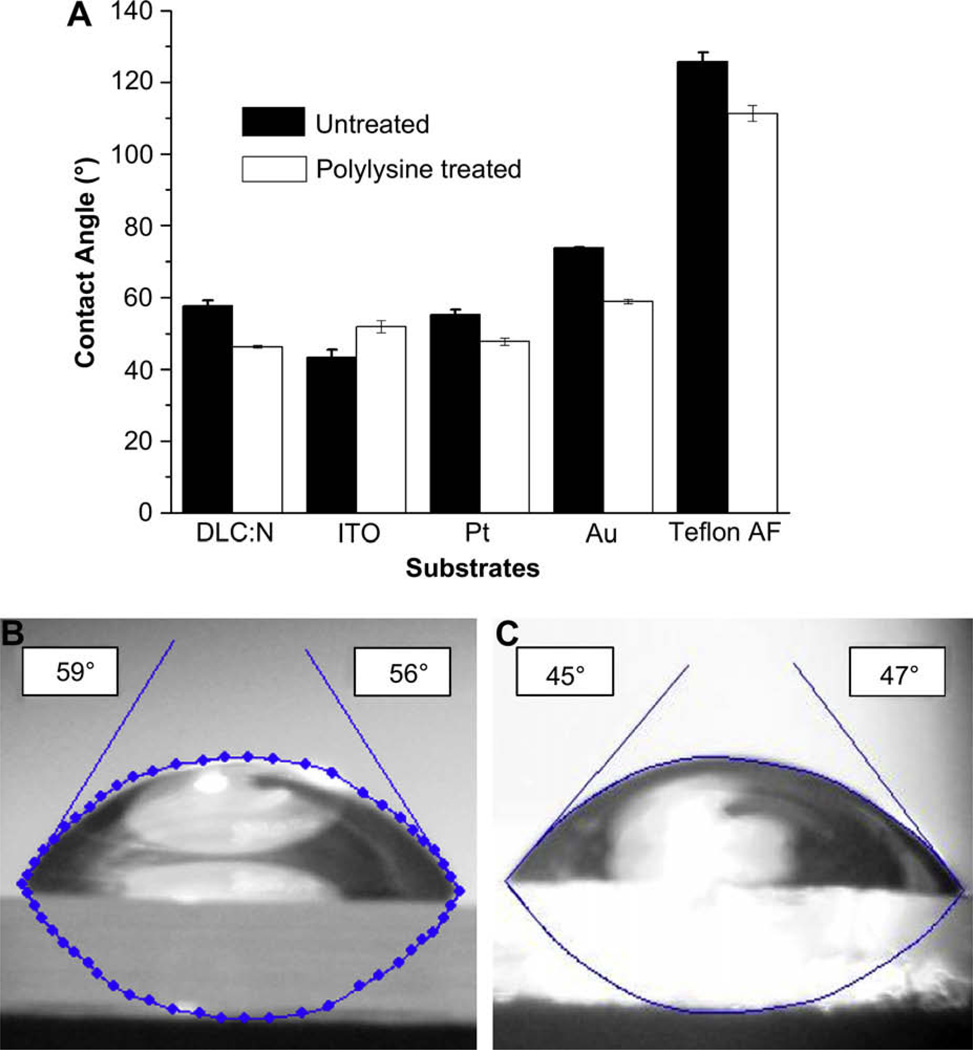
The ability of substrates to promote adhesion of cells likely depends on how well they adsorb proteins from the culture medium that interact with receptors on the cell surface (see Ref. [21] for a review). Adsorption of proteins in an active conformation, in turn, is likely to be affected by the contact angle of the substrate. We measured the contact angle of a water droplet on each of the five test substrates with and without polylysine treatment (Fig. 5). As expected, Teflon AF, as the most hydrophobic substrate, had the highest contact angle (126°), whereas ITO was the most hydrophilic of the substrates (43°). Polylysine treatment produces a polycationic film and thus tended to make the substrates slightly more hydrophilic, e.g., the contact angle for DLC:N droped from 58° to 46° with polylysine. A notable exception is for ITO, where the contact angle actually increased from 43° to 52° with polylysine treatment. These data are suggestive that an intermediate level of hydrophobicity, such as the case with DLC:N, is most conducive to promote cell adhesion (also see Ref. [15]). However, the correlation between contact angle and cell adhesion was not strong in that, for example, Pt supported substantially less adhesion than DLC:N yet had a similar contact angle (55° versus 58°, respectively).
Fig. 5.
Materials with intermediate hydrophobicity promote attachment of endocrine cells. (A). Contact angle measurements of water on tested materials with and without polylysine treatment. Images of water droplets with measured contact angles on (B) DLC:N (C) Polylysine-coated DLC:N.
3.3. Patterning cells over electrodes using DLC:N with Teflon AF insulation
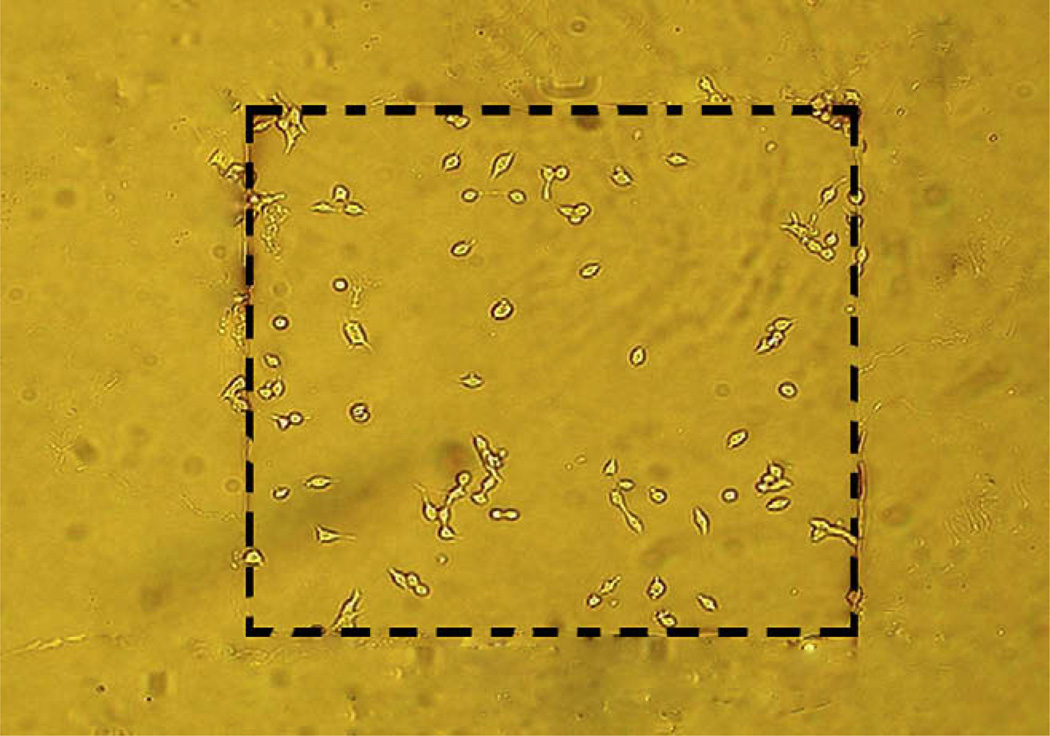
Our goal is to selectively target cells to “docking sites” on electrochemical electrodes by selecting appropriate electrode and insulation materials. Our data suggest that a good choice would be to use DLC:N as the electrode material with Teflon AF used to insulate inactive areas of the chip. We deposited a Teflon AF film on top of DLC:N and then used a reactive ion etching process to make a 0.4 mm square opening to define a working electrode area. We then cultured INS-1 cells on the device overnight and then washed off non-adherent cells. Fig. 6 presents a sample image demonstrating that the cells do, in fact, selectively adhere to the target region with the DLC:N surface.
Fig. 6.
Photolithographic patterning of Teflon AF on DLC:N leads to selective attachment of INS-1 cells to a prototype electrode. Teflon AF was deposited on top of DLC:N and etched in the region delineated by the dashed lines to expose the underlying DLC:N. INS-1 cells were then cultured on top of the device followed by wash of unattached cells. The width of the etched rectangle is 0.4 mm.
4. Discussion
We found that adhesion of both INS-1 and bovine chromaffin cells was greater to a DLC:N film compared to ITO, Pt, or Au as candidate electrochemical electrode materials. DLC has other desirable material properties including being chemically inert, hard and thus wear-resistant, and has good general biocompatibility (see Ref. [22] for a review). DLC:N also has desirable electrochemical properties [17,23]. DLC is an amorphous film with both sp2- and sp3-hybridized carbon atoms and thus has intermediate properties between graphite and diamond. It is hard like diamond, but, unlike diamond, can be deposited with standard microfabrication equipment at low enough temperatures to allow use of a glass substrate. Non-ideal properties of DLC for our application are that it is not highly transparent or conductive. Transparent electrodes are desirable because it allows imaging of cells on top of the material using conventional inverted microscopes whereas the resistance must also be low to prevent significant voltage drops when the electrode passes a current. We deposited a thin film of DLC on top of ITO in order to make a transparent device with ITO serving as both a conductive and transparent underlying material. We further increased the conductivity of DLC by doping it with nitrogen, making it suitable for use as an electrochemical electrode [17]. We did not test if nitrogen doping affected the ability of DLC:N to promote cell attachment because doping is essential for our application, but it is noteworthy that a very recent report demonstrates that cultured neurons adhere well to phosphorus-doped DLC, but not un-doped DLC [24].
Polylysine is a commonly used coating to promote attachment of neuronal and endocrine cells to glass substrates. We found that polylysine treatment promotes much greater attachment of both cell types to all materials we tested with the notable exception of DLC:N. We believe that polylysine formed a film on DLC:N because it changed the surface contact angle, however, the addition of the film did not significantly affect the number of adherent chromaffin cells (p = 0.76), and the effect on adhesion of INS-1 cells was modest. The most dramatic effect of polylysine was on promoting cell attachment to Au. The increase in cell attachment upon treatment of Teflon AF with polylysine is undesirable because we wish to use this material to block cell attachment to inactive portions of the chip so that electrodes only respond to “docked”, i.e., directly adjacent cells. This suggests that an approach must be developed to pattern polylysine over electrodes if this surface modification is to be used (but see Ref. [24]). On the other hand, if DLC:N is used as the electrode material, then polylysine treatment confers no advantage when using chromaffin cells, and one can use Teflon AF insulation to pattern cell attachment to active sites of electrodes (Fig. 6). We are currently developing devices to extend this approach to make functional electrochemical devices with single-cell-sized docking sites.
In the mechanism for differences in cell attachment to the films we tested likely results from differences in how well, and in what conformation, extracellular matrix (ECM) proteins are adsorbed from the serum-containing culture medium. Cell attachment takes place by binding of integrin receptors on the cell membrane with active sites or motifs on ECM proteins [25]. Adsorption of protein on the surface leads to denaturation of the protein which may lead to exposure of active motifs for integrin binding [21]. This process is likely affected by the hydrophobicity of the material. In general, proteins in the medium adsorb more readily to hydrophobic surfaces with contact angles greater than ~60–65° [26] yet highly hydrophobic surfaces may adsorb albumin more readily than integrin-binding ECM proteins such as fibronectin and thus be less supportive of cell attachment [15,27]. DLC:N, with a contact angle of 58°, may be close to the optimal level of hydrophobicity, whereas ITO is perhaps too hydrophilic with a contact angle of 43° and Au may be too hydrophobic with a contact angle of 73°. Treatment with polylysine increases the contact angle of ITO (to 52°) and decreases the contact angle of Au (to 59°) and increases adhesion of cells to both surfaces. Nevertheless, our data are not consistent with the view that surface hydrophobicity is the only determinant of cell adhesion. For example, Pt has a contact angle similar to that of DLC:N (55°), but does not support cell adhesion as well as DLC:N, and treatment of DLC:N with polylysine decreases the contact angle to 48° yet still supports a similar level of cell adhesion. Clearly the attachment of cells to surfaces involves a complex interplay between surface chemistry, surface charge and surface energy that likely varies between cell types and culture conditions.
5. Conclusions
Here we demonstrate that DLC:N is better than several other commonly used electrochemical electrode materials for promoting cell attachment of endocrine cells. Teflon AF is an insulating material with excellent dielectric properties that blocks cell attachment so that cells can be confined to the active areas of electrochemical electrodes for measurement of quantal exocytosis.
Acknowledgements
We thank Dr. Xin Liu for participating in the preparation and maintenance of cells and Jennings Premium Meat Co., New Franklin, MO for their kind gift of bovine adrenal glands each week. This study was supported by NIH NS048826.
Footnotes
Appendix
Figures with essential colour discrimination. Certain parts of the majority of figures in this article are difficult to interpret in black and white. The full colour images can be found in the on-line version, at doi:10.1016/j.biomaterials.2008.11.039.
Contributor Information
Luis Polo-Parada, Email: poloparadal@missouri.edu.
Kevin D. Gillis, Email: gillisk@missouri.edu.
Shubhra Gangopadhyay, Email: gangopadhyays@missouri.edu.
References
- 1.Di Carlo D, Lee LP. Dynamic single-cell analysis for quantitative biology. Anal Chem. 2006;78(23):7918–7925. doi: 10.1021/ac069490p. [DOI] [PubMed] [Google Scholar]
- 2.Travis ER, Wightman RM. Spatio-temporal resolution of exocytosis from individual cells. Annu Rev Biophys Biomol Struct. 1998;27:77–103. doi: 10.1146/annurev.biophys.27.1.77. [DOI] [PubMed] [Google Scholar]
- 3.Borges R, Camacho M, Gillis KD. Measuring secretion in chromaffin cells using electrophysiological and electrochemical methods. Acta Physiol (Oxf) 2008;192(2):173–184. doi: 10.1111/j.1748-1716.2007.01814.x. [DOI] [PubMed] [Google Scholar]
- 4.Dias AF, Dernick G, Valero V, Yong MG, James CD, Craighead HG, et al. An electrochemical detector array to study cell biology on the nanoscale. Nanotechnology. 2002;13:285–289. [Google Scholar]
- 5.Chen P, Xu B, Tokranova N, Feng X, Castracane J, Gillis KD. Amperometric detection of quantal catecholamine secretion from individual cells on micromachined silicon chips. Anal Chem. 2003;75(3):518–524. doi: 10.1021/ac025802m. [DOI] [PubMed] [Google Scholar]
- 6.Hafez I, Kisler K, Berberian K, Dernick G, Valero V, Yong MG, et al. Electrochemical imaging of fusion pore openings by electrochemical detector arrays. Proc Natl Acad Sci U S A. 2005;102(39):13879–13884. doi: 10.1073/pnas.0504098102. [DOI] [PMC free article] [PubMed] [Google Scholar]
- 7.Chen X, Gao Y, Hossain M, Gangopadhyay S, Gillis KD. Controlled on-chip stimulation of quantal catecholamine release from chromaffin cells using photolysis of caged Ca2+ on transparent indium-tin-oxide microchip electrodes. Lab Chip. 2008;8(1):161–169. doi: 10.1039/b715308m. [DOI] [PMC free article] [PubMed] [Google Scholar]
- 8.Spegel C, Heiskanen A, Pedersen S, Emneus J, Ruzgas T, Taboryski R. Fully automated microchip system for the detection of quantal exocytosis from single and small ensembles of cells. Lab Chip. 2008;8(2):323–329. doi: 10.1039/b715107a. [DOI] [PubMed] [Google Scholar]
- 9.Amatore C, Arbault S, Chen Y, Crozatier C, Lemaitre F, Verchier Y. Coupling of electrochemistry and fluorescence microscopy at indium tin oxide microelectrodes for the analysis of single exocytotic events. Angew Chem Int Ed Engl. 2006;45(24):4000–4003. doi: 10.1002/anie.200600510. [DOI] [PubMed] [Google Scholar]
- 10.Yang M, Li CW, Yang J. Cell docking and on-chip monitoring of cellular reactions with a controlled concentration gradient on a microfluidic device. Anal Chem. 2002;74(16):3991–4001. doi: 10.1021/ac025536c. [DOI] [PubMed] [Google Scholar]
- 11.Lau AY, Hung PJ, Wu AR, Lee LP. Open-access microfluidic patch-clamp array with raised lateral cell trapping sites. Lab Chip. 2006;12:1510–1515. doi: 10.1039/b608439g. [DOI] [PubMed] [Google Scholar]
- 12.Di Carlo D, Wu LY, Lee LP. Dynamic single cell culture array. Lab Chip. 2006;11:1445–1449. doi: 10.1039/b605937f. [DOI] [PubMed] [Google Scholar]
- 13.Kane RS, Takayama S, Ostuni E, Ingber DE, Whitesides GM. Patterning proteins and cells using soft lithography. Biomaterials. 1999;23–24:2363–2376. doi: 10.1016/s0142-9612(99)00165-9. [DOI] [PubMed] [Google Scholar]
- 14.Mrksich M, Whitesides GM. Using self-assembled monolayers to understand the interactions of man-made surfaces with proteins and cells. Annu Rev Biophys Biomol Struct. 1996;25:55–78. doi: 10.1146/annurev.bb.25.060196.000415. [DOI] [PubMed] [Google Scholar]
- 15.Sniadecki NJ, Desai RA, Ruiz SA, Chen CS. Nanotechnology for cell–substrate interactions. Ann Biomed Eng. 2006;34(1):59–74. doi: 10.1007/s10439-005-9006-3. [DOI] [PubMed] [Google Scholar]
- 16.Sun X, Gillis KD. On-chip amperometric measurement of quantal catecholamine release using transparent indium tin oxide electrodes. Anal Chem. 2006;78(8):2521–2525. doi: 10.1021/ac052037d. [DOI] [PubMed] [Google Scholar]
- 17.Gao Y, Chen X, Gupta S, Gillis KD, Gangopadhyay S. Magnetron sputtered diamond-like carbon microelectrodes for on-chip measurement of quantal catecholamine release from cells. Biomed Microdevices. 2008;10:623–629. doi: 10.1007/s10544-008-9173-8. [DOI] [PMC free article] [PubMed] [Google Scholar]
- 18.Yang Y, Craig TJ, Chen X, Ciufo LF, Takahashi M, Morgan A, et al. Phosphomimetic mutation of Ser-187 of SNAP-25 increases both syntaxin binding and highly Ca2+-sensitive exocytosis. J Gen Physiol. 2007;129(3):233–244. doi: 10.1085/jgp.200609685. [DOI] [PMC free article] [PubMed] [Google Scholar]
- 19.Asfari M, Janjic D, Meda P, Li G, Halban PA, Wollheim CB. Establishment of 2-mercaptoethanol-dependent differentiated insulin-secreting cell lines. Endocrinology. 1992;130(1):167–178. doi: 10.1210/endo.130.1.1370150. [DOI] [PubMed] [Google Scholar]
- 20.Yang Y, Gillis KD. A highly Ca2+-sensitive pool of granules is regulated by glucose and protein kinases in insulin-secreting INS-1 cells. J Gen Physiol. 2004;124(6):641–651. doi: 10.1085/jgp.200409081. [DOI] [PMC free article] [PubMed] [Google Scholar]
- 21.Horbett TA. The role of adsorbed proteins in animal cell adhesion. Colloids Surf B Biointerfaces. 1994;2:225–240. [Google Scholar]
- 22.Roy RK, Lee KR. Biomedical applications of diamond-like carbon coatings: a review. J Biomed Mater Res B Appl Biomater. 2007;83(1):72–84. doi: 10.1002/jbm.b.30768. [DOI] [PubMed] [Google Scholar]
- 23.Zeng A, Liu E, Tan SN, Zhang S, Gao J. Cyclic voltammetry studies of sputtered nitrogen doped diamond like carbon film electrodes. Electroanalysis. 2002;14(15–16) [Google Scholar]
- 24.Kelly S, Regan EM, Uney JB, Dick AD, McGeehan JP, Mayer EJ, et al. Patterned growth of neuronal cells on modified diamond-like carbon substrates. Biomaterials. 2008;29(17):2573–2580. doi: 10.1016/j.biomaterials.2008.03.001. [DOI] [PubMed] [Google Scholar]
- 25.Hynes RO. Integrins: bidirectional, allosteric signaling machines. Cell. 2002;110(6):673–687. doi: 10.1016/s0092-8674(02)00971-6. [DOI] [PubMed] [Google Scholar]
- 26.Xu LC, Siedlecki CA. Effects of surface wettability and contact time on protein adhesion to biomaterial surfaces. Biomaterials. 2007;22:3273–3283. doi: 10.1016/j.biomaterials.2007.03.032. [DOI] [PMC free article] [PubMed] [Google Scholar]
- 27.Klebe RJ, Bentley KL, Schoen RC. Adhesive substrates for fibronectin. J Cell Physiol. 1981;109(3):481–488. doi: 10.1002/jcp.1041090314. [DOI] [PubMed] [Google Scholar]


