

Abstract
Patients with 22q11.2 deletion syndrome have heterogeneous clinical presentations including immunodeficiency, cardiac anomalies, and hypocalcemia. The syndrome arises from hemizygous deletions of up to 3 Mb on chromosome 22q11.2, a region that contains 60 genes and 4 microRNAs. MicroRNAs are important post-transcriptional regulators of gene expression, with mutations in several microRNAs causal to specific human diseases. We characterized the microRNA expression patterns in the peripheral blood of patients with 22q11.2 deletion syndrome (n=31) compared to normal controls (n=22). Eighteen microRNAs had a statistically significant differential expression (p<0.05), with miR-185 expressed at 0.4× normal levels. The 22q11.2 deletion syndrome cohort exhibited microRNA expression hyper-variability and group dysregulation. Selected microRNAs distinguished patients with cardiac anomalies, hypocalcemia, and/or low circulating T cell counts. In summary, microRNA profiling of chromosome 22q11.2 deletion syndrome/DiGeorge patients revealed a signature microRNA expression pattern distinct from normal controls with clinical relevance.
Keywords: 22q11.2 deletion syndrome, microRNA profiling, miR-185, DiGeorge syndrome, Primary immunodeficiency disease
1. Introduction
Chromosome 22q11.2 deletion syndrome is one of the most common human genetic deletion disorders with a frequency of 1 in every 4000 births [1]. The syndrome develops following aberrant interchromosomal exchanges involving 8 large, paralogous low copy repeats of DNA (LCRs A-H) that span chromosome 22q11.2 [2–4]. These LCRs, long nucleotide stretches with extremely high sequence-homology, mispair during meiosis, which causes hemizygous chromosomal deletions of variable lengths. Most patients (90%) have a 3 million base pair (Mb) deletion between LCR-A and D (~60 genes), while 5–8% have a 1.5 Mb loss spanning LCR A and B (~30 genes) [5]. There are infrequent deletions between LCR D and E and/or the more distal LCRs [6,7]. The deletions contribute to variable clinical presentations including immunodeficiency, cardiac anomalies, hypocalcemia, feeding difficulties, facial dysmorphology, skeletal and renal anomalies, developmental and speech delay, learning disabilities, and/or schizophrenia [1,8,9]. The T cell immunodeficiency results from inadequate development of the thymus [10]. Up to 60% of patients with confirmed deletions on 22q11.2 have some degree of T cell lymphopenia. The peripheral T cells in these patients can undergo an unusual homeostatic expansion, resulting in an age-dependent T helper cell 2 (Th2) bias [9,11]. The cardiovascular defects primarily stem from the haploinsufficiency of the T-box1 transcription factor (Tbx1), which is required for formation of the pharyngeal apparatus during mammalian embryogenesis [12–16]. The 4th pharyngeal arch and the 3rd pharyngeal pouch give rise to the aortic arteries, the thymus and parathyroid organs, respectively. Point mutations in Tbx1 have been reported in several patients, and these are causal to the cardiac anomalies [15]. Yet, the thymic hypoplasia is only seen in a subset of such patients, suggesting that additional genetic components contribute to the thymic defects and ensuing T cell lymphopenia [17].
DiGeorge Syndrome Critical Region 8 (DGCR8), another gene deleted on chromosome 22q11.2, is known to be a pri-microRNA-binding protein required for microRNA (miR) biogenesis [18]. MiRs are a family of small, non-coding RNAs (18-22 nucleotides) that modulate gene expression by targeting specific messenger RNAs for degradation, translational repression, or both [19,20]. MiRs affect a wide range of biological responses including proliferation, differentiation, apoptosis, and/or stress responses [21]. In 22q11.2-deletion mouse models, a deficiency of DGCR8 causes a 20–70% reduction in a subset of miRs in the brain [22,23]. These miR changes contribute to a cognitive impairment, with altered short-term plasticity in the prefrontal cortex [23].
How the hemizygous deletions of 60 genes and 4 miRs encoded on chromosome 22q11.2 influence the complex clinical symptoms presented by 22q11.2 deletion syndrome patients is not well understood. We profiled the miRs in the peripheral blood of 31 patients with 22q11.2 deletion syndrome along with 22 normal controls. Statistically significant differences in the expression of 18 miRs were identified. MiR-185 was expressed at 0.4× normal levels, consistent with its hemizygous deletion on chromosome 22q11.2. This was the only miR of the 4 encoded within the locus detected in the peripheral blood. Mosaic cluster analyses revealed groups of miRs with both positive and negative correlation coefficients that were dramatically altered and/or absent in the patients [24–26]. Putative targets of these clusters were linked to various biological responses. The changes in particular groups of miRs matched selected clinical conditions including low numbers of circulating T cells, hypocalcemia, and cardiac anomalies. MiR differences were not related to changes in the cell populations of the peripheral blood, as expression profiling with 177 genes that define selected cell-based modules revealed similar patterns between the patient cohort and normal groups. These findings indicate that miR profiling of 22q11.2 deletion syndrome patients can uncover a clinically informative miR pattern significantly distinct from normal individuals.
2. Materials and methods
2.1. Patient cohort
Our study was a prospective and retrospective analysis of clinical and laboratory data of a total of thirty-one patients with 22q11.2 deletion syndrome. For this study, DiGeorge syndrome was defined as patients with low CD3 counts (<10% percentile for age and <1500 cells/μl), hypocalcemia and congenital heart disease. All patients were referred to the outpatient Immunology Clinic and/or admitted to Children’s Medical Center in Dallas, TX between May 2009 and April 2011. The Institutional Review Board at UT Southwestern Medical Center approved this study (IRB # 072010-003). Informed consent was obtained from all patients and control subjects (or parents, when necessary).
2.2. Patient characteristics
A total of 31 subjects, 64% females (20/31), mean age 5.34± 4.81 years, participated in the study (Supplemental Tables 1–3). Ethnic distributions were as follows: 48% Hispanic, 45% Caucasian, and 6% African-American. All 31 patients had fluorescent in-situ hybridization (FISH) evidence for the 22q11 deletion. One patient had documented autoimmunity (thrombocytopenia, MRNAP060), 1 had low IgG (MRNAP040) as compared to age-matched controls, and 1 had IgA deficiency (MRNAP058). Immunological testing was performed as part of standard of care. Lymphocyte subpopulations were collected at the same time as the miR analysis for 22 of the 31 patients. If patients were greater than three years of age, values reported are those within 3 years of collection, otherwise they were accepted if collected within three to six months of blood draws for the miR profiling. Twenty-two normal control samples ages newborn to >10 years were included. Twelve were male; 7 were<3 years of age; 4 between ages 3 and 10 years, and 8 from 10 to 18 years of age (Supplemental Table 1). In addition, three adult control samples were utilized.
2.3. Peripheral blood RNA preparation and microRNA arrays
For RNA preparations, 2.0–2.5 ml of peripheral blood was drawn directly into PAXgene Blood RNA Tubes (BD, Franklin Lakes, NJ). PAXgene tubes were stored at room temperature for 2 h and subsequently processed or frozen at −20 °C overnight followed by −70 °C for up to 2 weeks. RNA was isolated using the PAXgene Blood miRNA Kit following the protocol specified by the manufacturer (Qiagen, Valencia, CA). RNA was quantitated on a NanoDrop 2000 Spectrophotometer. Between 1 and 5 μg RNA was sent to LC Sciences for MicroRNA Array Expression Profiling (LC Sciences, Houston, TX). The same batch of Cyanine 3 (Cy3) was used for all RNA labeling reactions to diminish sample-to-sample variability. The microRNA arrays were upgraded each time a new human miR dataset was released (Sanger Releases, MRA-1001, LC Sciences). The array used for most of the profiling was based on miRBase Versions 12.0–14.0, which comprised a minimum of 600 human miR probes. For a subset of patients and controls with sufficient amounts of remaining RNA after the miR profiling, gene expression profiling was undertaken. A custom gene expression nCounter Plex2 for GEx Assay consisting of 177 genes representing 44 gene modules spanning blood cell populations was purchased from NanoString Technologies [27,28]. A total of 100 ng of RNA was targeted for hybridization. Subsequent purification of bound reporter/capture probe and RNA target was carried out using the nCounter Prep Station. Target detection was carried out using the nCounter Digital Analyzer. Raw data were both processed and analyzed using Excel. Visualization and further analysis was done using GeneSpring GX 7.3.1 analysis software.
2.4. Statistical analyses
LC Sciences provided the initial statistical analyses, involving standard t-tailed tests, with the data sets. Subsequent statistical analyses were done with associative tests, a more recent method for assessing and comparing gene expression data sets [29]. The patient and control data sets were analyzed and normalized using internal standards, as previously performed for gene arrays (Supplemental Table 4, excel spreadsheet) [24,29]. The internal standards were constructed from miRs that behaved similarly in the data sets. An iterative procedure was used to define the background parameters (average and standard deviation). The data in each array was transformed to make these parameters equal to 0 and 1, correspondingly. The miR expression data are presented in units of standard deviation of the background distribution, with 3 SD above the mean distinguishing the expressed from non-expressed genes. Linear regression is then used to adjust the normalized profiles to each other. Following these normalization processes, an associative analysis is undertaken that consists of several steps. First, the Reference group (an internal standard of equity of expression) is established using miRs that are expressed above background and have low variability within normal control samples. Second, the differentially expressed miRs are selected in paired comparison (normal controls versus patient samples) with a Student t-test using a significance threshold of p<0.05. Since this contributes a significant number of false positives, an Associative T-test is introduced in the next step, with the replicates from the samples compared to the entire set of the stably expressed miRs from the Reference group. The null, Ho, hypothesis is checked if miR expressions in the patient group (replicated residuals that deviate from the average control group profile), are associated with a normally distributed set of residual miRs in the control group. The significance threshold for this associative analysis is adjusted for multiple testing to minimize false positives: p<0.0001. Additional restrictions included minimal fold changes >1.5, and minimal level of expression of up regulated miRs >20 (in normalized units equal to SD of background noise). MiRs passing both tests were presented in the results tables. A web-based computational tool (DIANA-miRPath v2.0) was used for enrichment analysis of multiple miR target genes predicted by DIANA-microT-CDS, comparing each set of miR targets to all known KEGG (Kyoto Encyclopedia of genes and genomes) pathways [30,31]. Union of targeted genes by miR clusters was used for the over-representation statistical analyses, identifying the pathways significantly enriched with the targeted genes in the union. During analysis, false discovery rate correction was enabled. Pathways with few targeted miR nodes were penalized. Thresholds for p-value and MicroT parameters were set as >0.01 and 0.8, respectively. Statistically over-represented KEGG pathways are listed in the Tables, and this includes p-values of their components.
3. Results
3.1. MicroRNA profiling reveals significant microRNA expression differences between 22q11.2 deletion syndrome patients and normal controls
Greater than 90% of 22q11.2 deletion syndrome patients have a hemizygous deletion of over 60 genes, including dgcr8, and four miRs on chromosome 22q11.2. It is not known how this hemizygous deletion, which affects a miR-processing protein (dgcr8), impacts miR expression patterns. To address this, we performed a miR profiling of peripheral blood samples from a cohort of 31 22q11.2 deletion syndrome patients along with 22 normal controls (Table 1, Supplemental Table 1). The RNA was hybridized to human microRNA arrays that contained over 600 human miR probes. Standard statistical analyses were used to compare the miR array data sets (Supplemental Table 2). Eighteen miRs were differentially expressed in a statistically significant manner (T-test, p<0.05) (Supplemental Table 2). Scatter plots of those miRs with the highest associative p values illustrated the differences between the normal controls and the patient group (Fig. 1). MiR-185 was expressed at 0.4× normal control levels in all the patients with confirmed deletions on 22q11.2 (Fig. 1, associative p value<10−12). MiR-150 was also reduced and miR-15b-3p, miR-194, miR-324-5p, miR-363, miR-23b, and miR-361-5p were elevated in a statistically significantly manner (Fig. 1). Since miR differences could have arisen from changes in the cellular composition of the peripheral blood, gene expression analyses were undertaken for a subset of 177 genes that define the cellular constituents of the blood. An unbiased hierarchical cluster analysis failed to reveal any statistically significant clustering of the 22q11.2 deletion syndrome samples compared to normal controls (Supplemental Figs. 1–2). Neutrophil, eosinophil, plasmablast, erythrocyte, monocyte–macrophage, and NK/cytotoxic T cell subsets were similar in the 22q11.2 deletion syndrome cohort and the normal controls (Supplemental Fig. 1).
Table 1.
Clinical characteristics of patients with 22q11.2 deletion syndrome.
| Demographics
|
Clinical Features
|
Laboratory Results
|
|||||||||||
|---|---|---|---|---|---|---|---|---|---|---|---|---|---|
| Patient ID | Gender | Race | Age (yrs) | Congenital heart diseasea | Hypocalcemia | G-tube | Developmental delay speech delay/learning disabilities | Cleft palate/skeletal anomalies | CD3% | CD3 # (cells/μL) | Low CD3c | Age normalc | Age normalc CD3 # cells/μL |
| MRNAP003.1 | Female | Hispanic | 4 | TA | Yes | Yes | Dev delay, ADHDb | No | 36 | 1016 | Yes | 56–75 | 1400–3700 |
| MRNAP004.1 | Male | Hispanic | 4 | TOF | Yes | No | Dev delay/Speech Delay | No | 40 | 3403 | No | 56–76 | 1400–3701 |
| MRNAP008.1 | Male | Caucasian | 9 | TOF | Yes | Yes | ADHD | Cleft palate, metatarsus adductus | 55 | 719 | Yes | 60–76 | 1200–2600 |
| MRNAP011.1 | Female | Hispanic | 2 | TOF | Yes | No | Dev Delay | No | 66 | 3404 | No | 56–75 | 1400–3700 |
| MRNAP013.1 | Female | Hispanic | 9 | VSD/TA | No | Yes | Dev Delay | Scoliosis | 53 | 1342 | No | 60–76 | 1200–2600 |
| MRNAP014.1 | Male | Hispanic | 2 | TOF | Yes | Yes | Dev delaycxu/Speech Delay | No | 22 | 993 | Yes | 56–75 | 1400–3700 |
| MRNAP017.1 | Male | African American | 4 | TOF | No | No | Speech Delay | Laryngeal web, cricoid split, polydactyly | 40 | 1179 | Yes | 56–76 | 1400–3701 |
| MRNAP018.1 | Female | African American | 10 | IAA | No | No | Dev delay | No | 59 | 1369 | No | 60–76 | 1200–2600 |
| MRNAP021.1 | Female | Hispanic | 1 | VSD/PA | Yes | No | None | Cleft palate, bifid uvula | 39 | 2018 | Yes | 53–75 | 2100–6200 |
| MRNAP022.1 | Male | Caucasian | 3 | TOF | No | No | Speech delay, behavior concerns | No | 54 | 1701 | No | 56–75 | 1400–3700 |
| MRNAP027.1 | Male | Hispanic | 2 | TOF | Yes | No | Dev Delay/Speech Delay | No | 50 | 2723 | No | 56–76 | 1400–3701 |
| MRNAP028.1 | Male | Caucasian | 10 | TOF | Yes | Yes | Dev Delay/non-verbal/non-ambulatory | Scoliosis | 28 | 331 | Yes | 60–76 | 1200–2600 |
| MRNAP029.1 | Male | Hispanic | 1 | IAA | Yes | No | Speech Delay | No | 63 | 2242 | No | 53–75 | 2100–6200 |
| MRNAP030.1 | Female | Caucasian | 6 | BAV | No | No | Dev Delay/Hearing impaired | No | 47 | 931 | Yes | 56–75 | 1400–3700 |
| MRNAP034.1 | Female | Hispanic | 1 | TA | No | Yes | Dev Delay | Plagiocephaly, hyperextensible joints | 19 | 1042 | Yes | 53–75 | 2100–6200 |
| MRNAP035.1 | Female | Caucasian | 1 | TOF | Yes | No | Speech/Motor Delay | No | 22 | 1423 | Yes | 53–76 | 2100–6201 |
| MRNAP039.1 | Female | Hispanic | 4 | TOF | Yes | No | None | No | 43 | 1162 | Yes | 56–75 | 1400–3700 |
| MRNAP040.1 | Male | Hispanic | 10 | IAA | Yes | No | Dev delay | No | 11 | 85 | Yes | 60–76 | 1200–2600 |
| MRNAP041.1 | Female | Caucasian | 15 | TAPVR | Yes | No | None | Cleft palate | 48 | 1230 | No | 56–84 | 1000–2200 |
| MRNAP042.1 | Female | Hispanic | 0.75 | ASD/PDA | Yes | Yes | Hearing impairment | No | 33 | 1355 | Yes | 49–76 | 1900–5900 |
| MRNAP043.1 | Female | Caucasian | 5 | None | No | No | Dev delay/Speech Delay | Body asymmetry | 59 | 2625 | No | 56–75 | 1400–3700 |
| MRNAP044.1 | Female | Caucasian | 9 | None | No | No | Speech Delay | Cleft palate | 64 | 1049 | Yes | 60–76 | 1200–2600 |
| MRNAP046.1 | Male | Caucasian | 7 | VSD/ASD/PDA/CVR | No | Yes | Autism, Compulsive behavior | Short stature, cleft palate | 60 | 1334 | No | 60–77 | 1200–2601 |
| MRNAP047.1 | Female | Hispanic | 0.25 | ASD | Yes | No | NAd | No | 38 | 1972 | Yes | 51–77 | 2500–5600 |
| MRNAP048.1 | Female | Caucasian | 0.25 | TA | Yes | No | NA | No | 33 | 1333 | Yes | 51–78 | 2500–5601 |
| MRNAP052.1 | Female | Hispanic | 0.25 | TA | Yes | No | NA | T4 and T6 Buterfly vertebra | 61 | 1454 | Yes | 51–79 | 2500–5602 |
| MRNAP053.1 | Female | Caucasian | 4 | PDA | Yes | No | Speech delay | No | 49 | 1350 | Yes | 56–75 | 1400–3700 |
| MRNAP058.1 | Female | Caucasian | 0.08 | IAA/ASD/TA | Yes | No | NA | Cleft palate | 35 | 1115 | Yes | 53–84 | 2500–5600 |
| MRNAP059.1 | Male | Hispanic | 9 | RAA | No | No | Speech Delay/Learning disabilities | Absence of right angularis oris muscle | 53 | 1875 | No | 60–76 | 1200–2600 |
| MRNAP060.1 | Female | Caucasian | 17 | TOF | No | No | Speech Delay | Club Feet | 80 | 668 | Yes | 56–84 | 1000–2200 |
| MRNAP069.1 | Female | Caucasian | 15 | TOF | No | Yes | Non-verbal/Developmental delay | Scoliosis/kyphosis non-ambulatory | 58 | 1079 | No | 56–84 | 1000–2201 |
TA = Tricuspide Atresia; TOF = Tetralogy of Fallot; VSD = Ventricular Septal Defect; IAA = Interrupted Aortic Arch; PA = Pulmonary Atresia; BAV = Bicuspide Aortic Valve; TAPVR = Total Anomalous Pulmonary Venous Return; ASD = Atrial Septal Defect; PDA = Patent Ductus Arteriosus; CVR = Complete Vascular Ring; RAA = Right Aortic Arch.
ADHD: Attention Deficit with Hyperactivity Disorder.
CD3 was defined as low if the absolute CD3 cell number was <10th percentile for age as referenced by Shearer et al. J Allergy and Clinical Immunology 112 (5):973–80, 2003.
NA = not applicable.
Figure 1.

Altered miR expression levels in patients with 22q11.2 deletion syndrome compared to normal controls. MiRs were profiled from peripheral blood samples of 22 normal controls and 31 patients using microRNA arrays. Scatter plots are provided for the normalized expression values for selected miRs including miR-185, miR-150, miR-15b-3p, miR-194, miR-324-5p, miR-363, miR-23b, and miR-361-5p. The data is assembled from 53 independently acquired samples. Associative p values: *p<10−3, **p<10−4, ***p<10−8, ****p<10−12.
3.2. Patients with 22q11.2 deletion syndrome have a unique miR and gene expression hyper-variability
We next used an established multistep associative-statistical analysis to compare the miR expression patterns [24,29]. The normalized expression values for the miRs were plotted for 16 of the normal controls, followed by the 22q11.2 deletion syndrome samples (Fig. 2A). We were unable to include all the samples originally used for the miR analysis because insufficient quantities of RNA remained that were necessary for the gene expression comparisons. A high level of miR expression variability was detected among 128 distinct miRs in the samples from the 22q11.2 deletion syndrome patients (−2 to 30) compared to the normal group (−1 to 5 range) (Fig. 2A). Was there also evidence of elevated expression values for genes? A similar analysis was undertaken for the 177 genes profiled in the peripheral blood. The 22q11.2 deletion syndrome patient population also had a significant increase in the relative expression values for many genes (Fig. 2B). This was consistent when comparing individual patients, indicating that the miR and gene expression hyper-variability were linked. To evaluate whether this hypervariability could be seen in single gene defects causing immunodeficiency, 6 patients with x-linked hyper-IgM syndrome were profiled. The miR variability was only present in the 22q11.2 deletion syndrome cohort (Supplemental Fig. 3).
Figure 2.
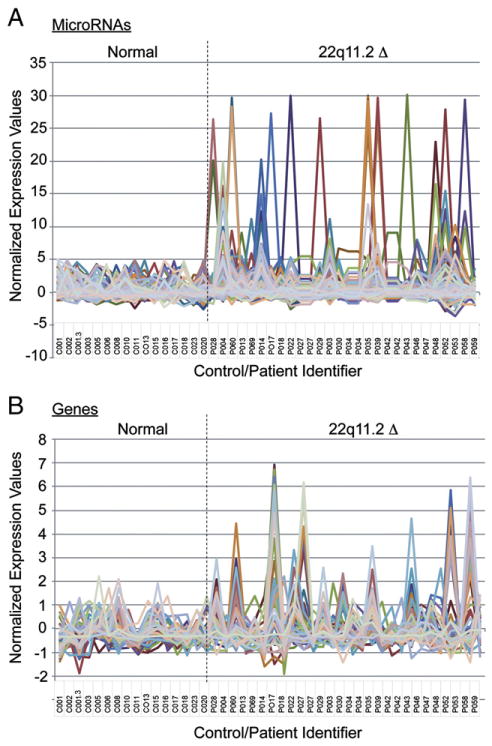
Selected miRs and genes exhibit an extreme expression range in patients with 22q11.2 deletion syndrome. (A) The normalized expression values for a subset of miRs are plotted for the normal controls (samples 1–16), followed by the 22q11.2 deletion syndrome patients (samples 17–44). Normalized miRs analyzed included: miR-15b-3p, miR-30c, miR-602, miR-486-5p, miR-302d-5p, miR-223, miR-92a, miR-193a-5p, miR-23b, miR-340-3p, miR-23a, miR-484, miR-128, miR-432, miR-142-5p, miR-1208, miR-30e-3p, miR-145, miR-25, miR-1825, miR-920, miR-610, miR-296-5p, miR-625-3p, miR-151-3p, miR-320d, miR-361-5p, miR-1246, miR-18a-3p, miR-675, miR-320c, miR-30a, miR-320b, miR-181a, miR-151-5p, miR-1913, miR-335, miR-191-3p, miR-219-1-3miR-503, miR-425, miR-127-5p, miR-1914-3p, miR-485-3p, miR-324-5p, miR-574-5p, miR-1237, miR-1908, miR-22, miR-98, miR-92b, miR-1976, miR-423-5p, and miR-1469. (B) The normalized expression values for a subset of 177 genes used in the transcriptional profiling of the peripheral blood was plotted for the normal controls (samples 1–16), followed by the 22q11.2 deletion syndrome patients (samples 17–44). Genes profiled include: HUWE1, NDUFB3, RBM38, SIAH2, CMPK2, LMOD3, ANKRD57, GALM, KCNMB1, NAT9, GOPC, RPP40, GOT1, C18ORF32, GPSM3, CHPT1, LANCL1, ROGDI, IGF2BP2, NT5C3, TAF7, CEBPA, ELP3, C5ORF62, SAMD9, SNW1, NDUFA11, IFITM3, SERF2ISG15, SCNN1D, OLIG2, OLIG1, IFI44, TNFRSF17, TRAK2, TEX261, SH3BGRL2, ANAPC4, CEACAM6, C1ORF35, UBL3, DDEF2, CDC34, IL5RA, NDUFA8, PI4K2A, XAF1, CTDSPL, RAD23A, LY6E, PTPLAD2, NUBPL, ZNF248, CEACAM8, PNMA, and IFI27.
3.3. Abnormal miR group behavior in 22q11.2 deletion syndrome patients
The miR expression changes in the 22q11.2 deletion syndrome patients suggested a complex dysregulation. To better define this behavior, correlative mosaic analysis was used [26]. This analysis compares the coordinated expression of groups of miRs in the normal controls versus the patients. The results were presented in graphical form as positively (red) and negatively (blue) correlated clusters of miRs. Four distinct clusters (Normal CL1-CL4) of miRs were identified in the normal controls based on their tight, co-regulated expression (Fig. 3A, red regions). In the patient samples, CL1 was only partly linked, CL2 was very similar, but CL3 and CL4 were either uncoupled or negatively (blue) correlated in their expression (Fig. 3B). To understand the biological significance of these changes, a web-based computational tool (DIANA-miRPath v2.0) was used to identify potentially affected molecular KEGG pathways by the miR clusters [30,31]. The miRs in CL1-CL2 were involved in the regulation of extracellular matrix assembly, MAPK-, neurotrophin-, TGF-, and mTOR signaling (Table 2). The CL3 cluster regulates genes involved in additional pathways including circadian rhythms and cytokine pathways. The latter two, along with pathways described in certain malignancies (CML, renal cell cancer, AML and melanoma), mTOR signaling, and biotin and lysine metabolism were clustered uniquely in control subjects but not identified in patients (Tables 2 and 3).
Figure 3.
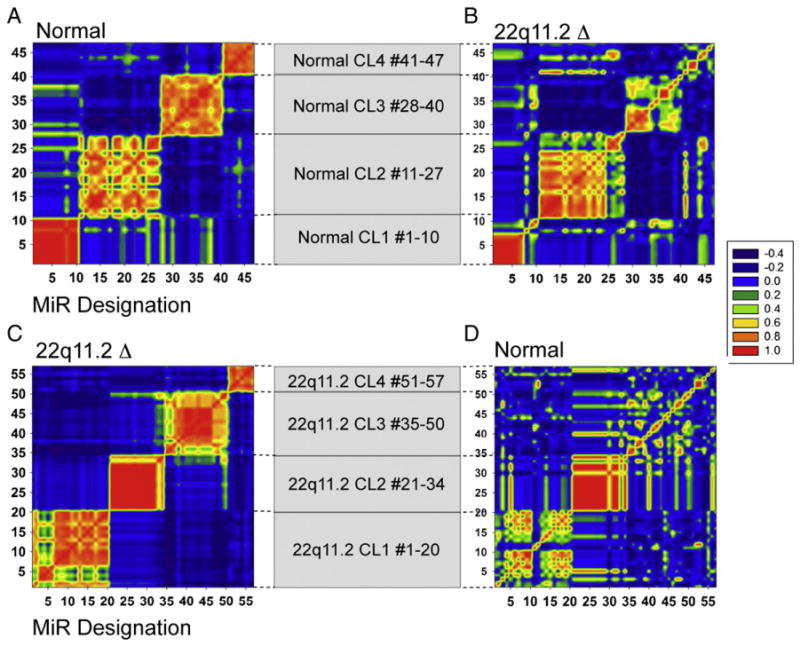
Selected miR clusters exhibit distinct correlation patterns when comparing normal controls and patients with 22q11.2 deletion syndrome. (A) Mosaic of correlation coefficients for 4 clusters of miRs that were highly correlated (yellow-red) in samples from normal controls. These clusters, designated as CL1, CL2, CL3, and CL4, comprise 10, 17, 13, and 7 miRs, respectively. (B) The same clusters were presented for the 22q11.2 deletion syndrome cohort, which revealed a negatively (blue) or marginally correlated (blue-yellow) pattern, particularly for CL3 and CL4. (C) Mosaic of 4 independently derived clusters in the patient cohort was designated as 22q11.2 CL1–22q11.2 CL4. There are 20, 14, 16, and 7 miRs in each, respectively. (D) Control groups (22q11.2 CL1–CL4) were either negatively (blue), weakly (yellow) or strongly correlated in expression in the control groups (red). All the data are presented as heat maps of clusters of miRs, using a scale from −0.4 (blue) to highly correlative at 1.0 (red), as indicated. Statistical analyses were performed using associative studies, as described in the Materials and methods.
Table 2.
Putative KEGG pathways affected by miR clusters in normal controls.a
| Cluster
| |
|---|---|
| Pathway name | p-Value |
| Normal CL1 #1-10b | |
| Glycosaminoglycan biosynthesis — heparan sulfate | 6.20E−11 |
| ECM–receptor interaction | 2.75E−08 |
| Mucin type O-glycan biosynthesis | 1.10E−07 |
| Adherens junction | 2.67E−05 |
| Biotin metabolism | 6.47E−04 |
| TGF-beta signaling pathway | 1.26E−03 |
| Chronic myeloid leukemia | 4.20E−03 |
| Axon guidance | 7.28E−03 |
| Neurotrophin signaling pathway | 7.28E−03 |
| Endocytosis | 7.28E−03 |
| Normal CL2 #11-27c | |
| Glycosaminoglycan biosynthesis — heparan sulfate | 7.87E−27 |
| ECM–receptor interaction | 6.51E−19 |
| Prion diseases | 4.43E−07 |
| Glioma | 4.43E−07 |
| Pathways in cancer | 9.23E−07 |
| TGF-beta signaling pathway | 1.29E−05 |
| Focal adhesion | 1.37E−05 |
| Fatty acid biosynthesis | 5.32E−05 |
| Neurotrophin signaling pathway | 5.32E−05 |
| Mucin type O-glycan biosynthesis | 1.01E−04 |
| Prostate cancer | 1.04E−04 |
| Non-small cell lung cancer | 1.07E−04 |
| MAPK signaling pathway | 1.75E−04 |
| Renal cell carcinoma | 2.54E−04 |
| Pancreatic cancer | 1.24E−03 |
| Glycosaminoglycan biosynthesis—keratan sulfate | 1.53E−03 |
| ErbB signaling pathway | 1.53E−03 |
| Lysine degradation | 1.95E−03 |
| mTOR signaling pathway | 2.15E−03 |
| Acute myeloid leukemia | 2.15E−03 |
| Gap junction | 2.23E−03 |
| Small cell lung cancer | 3.26E−03 |
| Axon guidance | 3.53E−03 |
| Colorectal cancer | 6.92E−03 |
| Wnt signaling pathway | 9.50E−03 |
| Melanoma | 9.67E−03 |
| Normal CL3 #28-40d | |
| Fatty acid biosynthesis | 8.63E−14 |
| Glycosaminoglycan biosynthesis—heparan sulfate | 1.06E−04 |
| Adherens junction | 1.06E−04 |
| Pathways in cancer | 1.06E−04 |
| TGF-beta signaling pathway | 1.79E−04 |
| Circadian rhythm — mammal | 3.28E−04 |
| Axon guidance | 7.88E−04 |
| Glioma | 2.42E−03 |
| Endocytosis | 4.05E−03 |
| Renal cell carcinoma | 5.55E−03 |
| Lysine degradation | 6.64E−03 |
| Cytokine–cytokine receptor interaction | 8.97E−03 |
| Normal CL4 #41-47e | |
| ECM–receptor interaction | 2.91E−14 |
| MAPK signaling pathway | 2.28E−03 |
| Glycosaminoglycan biosynthesis — heparan sulfate | 6.07E−03 |
We used publicly available DIANA miRPath v2.0 to identify affected molecular pathways by miR clusters as detailed in the methods section.
miR-940, miR-1238, miR-1913, miR-1237, miR-1825, miR-1228, miR-423-3p, mIR-19a, miR-1229, miR-636.
miR-374b, miR-148a, miR-29b, miR-21, miR-144-5p, miR-335, miR-29c, miR-30e, miR-340-3p, miR-27b, miR-628-3p, miR-374a, miR-7, miR-424, miR-142-5p, miR-98, miR-576-5p.
miR-142-3p, miR-550a-3p, miR-425, miR-324-5p, miR-103a-2-5p, miR-222, miR-1181, miR-1973, miR-107, miR-103, miR-484, miR-151-5p, miR-93.
miR-183, miR-505-5p, miR-584, miR-let-7e, miR-874, miR-let-7b, miR-342-5p.
Table 3.
Putative KEGG pathways affected by miR clusters in 22q11.2 deletion syndrome patients.a
| Cluster
| |
|---|---|
| Pathway name | p-Value |
| 22q11.2 CL1 #1-20b | |
| ECM–receptor interaction | 1.09E−18 |
| Glycosaminoglycan biosynthesis — heparan sulfate | 1.07E−16 |
| Prion diseases | 1.25E−11 |
| TGF-beta signaling pathway | 2.85E−09 |
| Glioma | 6.26E−07 |
| Pathways in cancer | 7.63E−06 |
| Fatty acid biosynthesis | 1.13E−05 |
| Focal adhesion | 9.89E−05 |
| Endocytosis | 9.89E−05 |
| Neurotrophin signaling pathway | 9.89E−05 |
| Gap junction | 2.18E−04 |
| Pancreatic cancer | 2.18E−04 |
| Lysine degradation | 3.40E−04 |
| Small cell lung cancer | 3.40E−04 |
| Prostate cancer | 3.97E−04 |
| MAPK signaling pathway | 7.82E−04 |
| Non-small cell lung cancer | 8.95E−04 |
| Axon guidance | 1.36E−03 |
| ErbB signaling pathway | 2.13E−03 |
| Melanogenesis | 3.02E−03 |
| Wnt signaling pathway | 3.29E−03 |
| Amoebiasis | 3.93E−03 |
| 22q11.2 CL2 #21-34c | |
| ECM–receptor interaction | 2.93E−12 |
| Glycosaminoglycan biosynthesis — heparan sulfate | 1.03E−09 |
| Mucin type O-glycan biosynthesis | 1.71E−05 |
| TGF-beta signaling pathway | 1.83E−04 |
| Adherens junction | 3.29E−04 |
| Axon guidance | 5.08E−04 |
| Endocytosis | 5.23E−04 |
| 22q11.2 CL3 #35-50d | |
| Glycosaminoglycan biosynthesis — heparan sulfate | 1.68E−33 |
| Prion diseases | 6.51E−14 |
| TGF-beta signaling pathway | 9.14E−05 |
| ErbB signaling pathway | 9.14E−05 |
| Long-term depression | 1.78E−04 |
| Arrhythmogenic right ventricular cardiomyopathy (ARVC) | 3.54E−04 |
| Pathways in cancer | 2.07E−03 |
| Adherens junction | 2.95E−03 |
| Colorectal cancer | 3.10E−03 |
| Endocytosis | 4.00E−03 |
| 22q11.2 CL4 #51-57e | |
| Fatty acid biosynthesis | 1.26E−28 |
| Glycosaminoglycan biosynthesis - heparan sulfate | 2.89E−21 |
We used publicly available DIANA miRPath v2.0 to identify affected molecular pathways by miR clusters as detailed in the methods section.
miR-155, miR-28-5p, miR-142-3p, miR-335, miR-19a, miR-7, miR-374b, miR-148a, miR-29b, miR-21, miR-182, miR-183, miR-215, miR-29a, miR-146b-5p, miR-29c, miR-30e-3p, miR-27b, miR-374a, miR-424.
miR-940, miR-1238, miR-1913, miR-625-3p, miR-1237, miR-1249, miR-1281, miR-1825, miR-1234, miR-296-5p, miR-425-3p, miR-1228, miR-409-3p, miR-423-3p.
miR-324-5p, miR-222, miR-140-3p, miR-424-3p, miR-550a-3p, miR-1914-3p, miR-548 h, miR-486-3p, miR-331-3p, miR-610, miR-432, miR-148a-5p, miR-425, miR-103a-2-5p, miR-1307, miR-33b-3p.
miR-663, miR-505-5p, miR-584, miR-1180, miR-503, miR-18b-3p, miR-210.
The same clustering strategy was independently applied to miRs profiled in the 22q11.2 deletion syndrome patients (Fig. 3C). Again, 4 independent clusters were identified, and designated as 22q11.2 CL1–22q11.2 CL4. Of these 4 clusters, the miRs in the 3rd and 4th 22q11.2 cluster were significantly different in the control group, exhibiting only a partial link or negative correlation (blue) (Fig. 3C versus D). This unexpected difference suggests that the patients with deletions on 22q11.2 have compensatory biological responses that cause a coordinated expression of miRs not normally seen in controls. The pathways include those involved in cerebellar long-term depression, arrthymogenic right ventricular cardiomyopathy, and fatty acid biosynthesis (Tables 2 and 3). It is important to note that miR deregulation did not apply to all clusters, as Normal CL2 and 22q11.2 CL2 were coordinately expressed in both control and 22q11.2 groups (Fig. 3). Taken together, our data revealed three critical features of miR expression profiling applicable to clinical pathologies. First, changes in the absolute expression of certain miRs are markers for hemizygous chromosomal deletions (miR-185). Second, significant variability in miR expression levels could reflect pathological conditions such as 22q11.2 deletion syndrome. Third, mosaic cluster analyses can reveal positively or negatively linked miRs that distinguish control from patient groups with biological relevance.
3.4. Correlation of miR expression profiles with clinical phenotypes in those patients defined as DiGeorge syndrome
Patients with 22q11.2 deletion syndrome represent a classic contiguous gene defect syndrome with resultant clinical heterogeneity (Supplemental Table 3). For the purposes of this study, we defined patients with DiGeorge syndrome if patients had a 22q11.2 deletion; CD3+ T cell counts below <10% percentile of normal for age and <1500 cells/μl, congenital heart disease, and hypocalcemia. Comparative miR analyses were used to determine whether specific miR patterns could define particular clinical pathologies. Selected miRs distinguished patients with congenital heart disease, hypocalcemia, and low CD3+ T cell counts (Table 4). In fact, several individual miRs were able to differentiate patients with low CD3 numbers (miR-29a), those with low CD3 and hypocalcemia (miR-21), and hypocalcemia with congenital heart disease (let-7i). Overlapping miRs were illustrated with Venn diagrams (Fig. 4A). The DiGeorge patients with all three clinical phenotypes had 4 miRs that were up- (miR-15b-3p, miR-194, miR-324-5p, miR-361-5p) and 4 that were down-regulated (miR-185, miR-150, let-7b, miR-720). We also used discriminant functional analyses to determine whether the normal controls, the patients with low CD3 levels, and 22q11.2 deletion syndrome patients with normal CD3 levels could be classified separately. A set of miRs, whose collective, combinatorial up- and/or down-regulation, clearly demarcated the groups (Fig. 4B).
Table 4.
Human miR expression differences between normal controls and 22q11.2 deletion syndrome patients with cardiac anomalies, hypocalcemia and low CD3+ T cell counts.
| MicroRNAa | Normal
|
22q11.2 Δ
|
Associative p-valueb | Ratiod | MiR regulatory functions | |||
|---|---|---|---|---|---|---|---|---|
| Average | SD | Average | SD | |||||
| Congenital heart disease | miR-185 | 7655 | 2810 | 2841 | 1309 | 0.00E+00c | 0.37 | Mammalian organogenesis |
| miR-15b-3p | 35 | 33 | 119 | 100 | 0.00E+00c | 3.41 | Cardiomyocyte mitotic arrest | |
| miR-150 | 12,808 | 11,015 | 5494 | 3006 | 2.48E−10 | 0.43 | Cardiomyocyte cell growth | |
| miR-720 | 851 | 993 | 342 | 210 | 2.19E−09 | 0.40 | Epithelial cell development | |
| miR-194 | 134 | 102 | 262 | 182 | 8.13E−08 | 1.96 | Epithelial cell differentiation | |
| miR-324-5p | 182 | 65 | 342 | 290 | 1.22E−07 | 1.88 | Hedgehog signaling | |
| let-7b | 3722 | 4770 | 1334 | 803 | 3.51E−07 | 0.36 | Cell survival | |
| miR-363 | 650 | 364 | 1044 | 563 | 2.75E−05 | 1.61 | Cardiomyocyte apoptosis | |
| let-7 g | 3122 | 2486 | 1849 | 896 | 3.25E−04 | 0.59 | Heart development | |
| let-7i | 3368 | 2217 | 2088 | 1248 | 5.54E−04 | 0.62 | Heart development | |
| miR-23b | 1039 | 490 | 1583 | 712 | 7.52E−04 | 1.52 | Morphogenesis | |
| miR-361-5p | 188 | 87 | 297 | 208 | 3.90E−03 | 1.58 | Chronic heart failure marker | |
| Hypocalcemia | miR-185 | 7655 | 2810 | 2889 | 1380 | 0.00E+00b | 0.38 | Cell cycle and DNA methylation |
| miR-150 | 12,808 | 11,015 | 5061 | 2793 | 1.09E−12 | 0.40 | Cell cycle signaling | |
| miR-15b-3p | 35 | 33 | 124 | 114 | 6.91E−11 | 3.54 | Cellular ATP levels | |
| miR-21 | 41 | 53 | 169 | 286 | 1.16E−09 | 4.09 | Cell proliferation | |
| miR-324-5p | 182 | 65 | 343 | 246 | 2.01E−09 | 1.88 | As above | |
| let-7b | 3722 | 4770 | 1467 | 730 | 1.64E−04 | 0.39 | As above | |
| miR-720 | 851 | 993 | 326 | 233 | 4.29E−07 | 0.38 | As above | |
| miR-194 | 134 | 102 | 268 | 193 | 1.85E−06 | 2.01 | As above | |
| let-7i | 3368 | 2217 | 2098 | 1032 | 3.50E−03 | 0.62 | As above | |
| miR-145 | 55 | 33 | 35 | 17 | 3.44E−03 | 0.63 | Smooth muscle cell function | |
| Low CD3+ T cell counte | miR-185 | 7655 | 2810 | 2981 | 1317 | 0.00E+00b | 0.39 | B cell autoantibody production |
| miR-15b-3p | 35 | 33 | 119 | 107 | 1.07E−11 | 3.41 | Cell survival | |
| miR-324-5p | 182 | 65 | 365 | 260 | 6.46E−11 | 2.00 | As above | |
| miR-21 | 41 | 53 | 181 | 292 | 1.90E−09 | 4.36 | Immune activation and tolerance | |
| miR-150 | 12,808 | 11,015 | 6336 | 3198 | 3.66E−08 | 0.49 | T and B cell development | |
| miR-720 | 851 | 993 | 320 | 236 | 7.19E−07 | 0.38 | As above | |
| miR-194 | 134 | 102 | 254 | 179 | 7.00E−06 | 1.90 | Follicular lymphoma cell growth | |
| let-7b | 3722 | 4770 | 1347 | 804 | 3.76E−05 | 0.36 | IFN-beta production | |
| miR-29a | 17 | 11 | 36 | 38 | 5.89E−05 | 2.06 | IFN-gamma production | |
| miR-361-5p | 188 | 87 | 317 | 235 | 4.58E−04 | 1.69 | Deregulated in blood cells | |
MicroRNA refers to human microRNAs and let represents an early miR designation.
Associative p values.
Associative p-value is less than 10−12.
Ratio is the normal miR level divided by the 22q11.2 deletion syndrome miR levels.
Low CD3 levels are defined to be less than 2 SD compared with age-matched controls.
Figure 4.
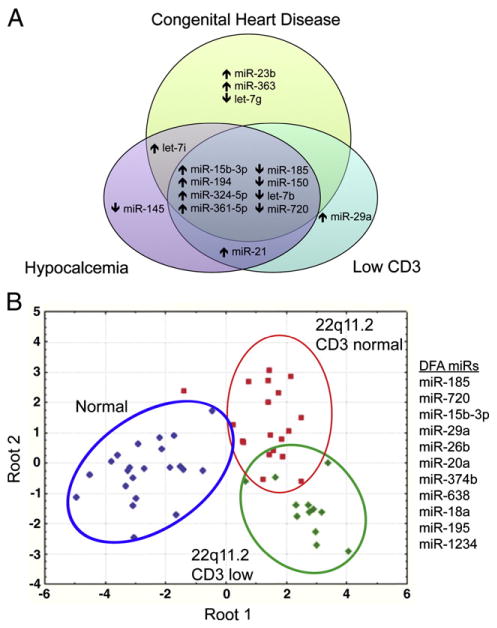
Specific miR groups distinguish 22q11.2 deletion syndrome patients with T cell deficiency, hypocalcemia, and congenital heart disease. (A) Venn diagram illustrating groups of miRs that distinguish three major clinical presentations in patients with 22q11.2 deletion syndrome, congenital heart disease, hypocalcemia, and CD3+ T cell values below 2SD for normal age-matched controls. Groups of miRs that overlap among the different clusters are shown. (B) Discriminant functional analyses reveal unique miRs that categorize 22 normal controls, 13 patients with 22q11.2 deletion syndrome with normal CD3+ T cell numbers, and 18 with CD3 levels below the 10th percentile of age-matched controls. The miRs that distinguish these groups are miR-185, miR-720, miR-15b-3p, miR-29a, miR-26b, miR-20a, miR-374b, miR-638, miR-18a, miR-195, and miR-1234.
4. Discussion
MiRs are important biomarkers for cancer, autoimmune diseases, and muscular disorders, and are currently in phase II clinical trials for treating various conditions. Our studies suggest that four approaches, associative studies, hyper-variability plots, mosaic cluster analyses, and discriminant functional analyses, can distinguish complex clinical disorders arising from chromosomal deletions such as 22q11.2 deletion syndrome. MiR-185 was reduced to 0.4× control level in the FISH-verified 22q11.2 deletion syndrome patients, consistent with its haploinsufficiency on 22q11.2. MiR-185 is also haploinsufficient in mouse models of 22q11.2 deletion syndrome [32]. One patient with a duplication of 22q11.2 expressed miR-185 at levels 1.4 fold normal (data not shown). These results indicate that the locus encoding miR-185 is transcriptionally active on both alleles in multiple species. During the screening of patients with a clinical diagnosis of DiGeorge syndrome, miR profiling revealed 3 with normal miR-185 levels. These patients were subsequently confirmed to be FISH negative (i.e. no deletion of the most frequently deleted segment on 22q11.2). Two such patients were infants of diabetic mothers. This, along with Trisomy 22q11 and chromosome 10p13–p14 deletions can result in a DiGeorge-like clinical presentation [33–37]. Therefore, miR-185 analysis may represent a potential surrogate marker for 22q11.2 deletion syndrome and an alternative to molecular cytogenetics in distinguishing clinically defined DiGeorge cohorts.
The associative methodology applied to the miR and gene expression data sets revealed a miR expression and gene hyper-variability unique to patients with deletions on chromosome 22q11.2. Mosaic cluster analyses also uncovered a miR group behavior that was extremely unusual in the study population. These clusters of miRs, tightly linked in expression in the normal population, were uncoupled in the patient group. Many of the miRs in these clusters have key roles in controlling cellular growth and differentiation (Tables 2–4). The molecular basis of the miR alterations in the patients remains unknown, but is partly linked to reductions in dgcr8, consistent with mouse models [18,22,32].
There are many dysregulated miRs in the patient cohort with confirmed biological functions. MiR-185 defined all the patients with confirmed deletions on 22q11.2. Could its reduced expression account for some of their clinical presentations? In mouse models, reductions in miR-185 increase the expression of one of its target, Bruton’s tyrosine kinase, leading to autoantibody production by B cells [38]. In our miR-185 over-expression model in T cells, elevated miR-185 caused a dose-dependent T cell lymphopenia [39]. MiR-185 targeted Mzb1, NF-ATc3, and Camk4 in developing thymocytes, with Mzb1 reduced 5-fold. This reduction causes a T cell receptor-dependent increase in intracellular calcium levels [39]. This agrees with previous work demonstrating that Mzb1 is an endoplasmic reticulum calcium regulator, with high levels of Mzb1 reducing calcium influx [40]. MiR-185 targets a distinct calcium regulator in neurons, SERCA2 [32]. In the 22q11.2 deletion mouse model, the neurons have elevated levels of SERCA2 and increases in long-term potentiation over time [32]. Taken together, the findings strongly support the idea that reductions in miR-185 in 22q11.2 deletion syndrome patients contributes to their immune system deficiencies and neurological abnormalities, partly through the up regulation of two distinct calcium regulators. Other candidate miRs likely contribute to disease progression. MiR-150, also reduced in the patient cohort, is normally expressed in many cell populations including mature T and B cells [41]. Its reduced expression could reflect the low numbers of these cells in the DiGeorge subgroup. MiR-23b, elevated in a subset of the patients, regulates transforming growth factor β [42]. MiR-363 is a paralog of the miR-17-92 family and functions in a similar anti-apoptotic role as the 6 other miRs in this family, with the haploinsufficiency of miR-17-92 causal to Feingold syndrome [43]. In conclusion, miR profiling of patients with confirmed deletions on chromosome 22q11.2 reveals distinguishing signature miR expression behaviors with clear connections to the immunological and cardiac abnormalities. The associative methodologies for miR profiling we describe for 22q11.2 deletion syndrome patients may provide novel insights into the clinical heterogeneity underlying other chromosomal deletion syndromes.
Supplementary Material
Acknowledgments
We sincerely appreciate all the help of Dr. Rhonda Bassel-Duby and the many members of the Eric Olson lab in the Department of Molecular Biology at UT Southwestern Medical Center. We especially thank Dr. Christoph Eicken from LC Sciences for critical experimental suggestions during the course of the study. Special appreciation is given to the patients and their families who agreed to participate in this study. This work was supported, in part, by grants from the National Institutes of Health (AI838270, NvO); an NIAID T32 training grant (AI005285, AH); and the Jeffery Modell Foundation (MdlM).
Abbreviations
- ASD
Atrial septal defects
- Btk
Bruton’s tyrosine kinase
- Camk4
Calcium/calmodulin-dependent kinase 4
- Cy3
Cyanine 3
- DGCR8 (dgcr8)
DiGeorge Syndrome Critical Region 8
- DGS
DiGeorge syndrome
- FISH
Fluorescent in situ hybridization
- IRB
Institutional Review Board
- Itk
Interleukin-2 inducible T cell kinase
- KEGG
Kyoto Encyclopedia of genes and genomes
- LCR
Low copy repeats
- MiR
microRNA
- Mzb1
Marginal zone B- and B1-cell specific protein 1 (pERp1)
- NF-ATc3
Nuclear factor of activated T cells, cytoplasmic, calcineurin 3
- PIDs
Primary immunodeficiency diseases
- SERCA2
sarcoplasmic/endoplasmic reticulum calcium ATPase 2
- TA
Truncus arteriosus
- Tbx1
T-box transcription factor
- TOF
Tetralogy of Fallot
- Th2
T helper 2 subset
- VCF
Velo-cardio-facial syndrome
- VSD
ventricular septal defects
Appendix A. Supplementary data
Supplementary data to this article can be found online at http://dx.doi.org/10.1016/j.clim.2013.01.011.
Footnotes
Conflict of interest statement
All of the authors confirm that no conflict of interest exists.
Contributor Information
M. Teresa de la Morena, Email: maite.delamorena@utsouthwestern.edu.
Nicolai S.C. van Oers, Email: nicolai.vanoers@utsouthwestern.edu.
References
- 1.Kobrynski LJ, Sullivan KE. Velocardiofacial syndrome, DiGeorge syndrome: the chromosome 22q11.2 deletion syndromes. Lancet. 2007;370:1443–1452. doi: 10.1016/S0140-6736(07)61601-8. [DOI] [PubMed] [Google Scholar]
- 2.Wilson DI, Burn J, Scambler P, Goodship J. DiGeorge syndrome: part of CATCH 22. J Med Genet. 1993;30:852–856. doi: 10.1136/jmg.30.10.852. [DOI] [PMC free article] [PubMed] [Google Scholar]
- 3.Shaikh TH, Kurahashi H, Saitta SC, O’Hare AM, Hu P, Roe BA, Driscoll DA, McDonald-McGinn DM, Zackai EH, Budarf ML, Emanuel BS. Chromosome 22-specific low copy repeats and the 22q11.2 deletion syndrome: genomic organization and deletion endpoint analysis. Hum Mol Genet. 2000;9:489–501. doi: 10.1093/hmg/9.4.489. [DOI] [PubMed] [Google Scholar]
- 4.Shaikh TH, Kurahashi H, Emanuel BS. Evolutionarily conserved low copy repeats (LCRs) in 22q11 mediate deletions, duplications, translocations, and genomic instability: an update and literature review. Genet Med. 2001;3:6–13. doi: 10.1097/00125817-200101000-00003. [DOI] [PubMed] [Google Scholar]
- 5.Shaikh TH, O’Connor RJ, Pierpont ME, McGrath J, Hacker AM, Nimmakayalu M, Geiger E, Emanuel BS, Saitta SC. Low copy repeats mediate distal chromosome 22q11.2 deletions: sequence analysis predicts breakpoint mechanisms. Genome Res. 2007;17:482–491. doi: 10.1101/gr.5986507. [DOI] [PMC free article] [PubMed] [Google Scholar]
- 6.Saitta SC, McGrath JM, Mensch H, Shaikh TH, Zackai EH, Emanuel BS. A 22q11.2 deletion that excludes UFD1L and CDC45L in a patient with conotruncal and craniofacial defects. Am J Hum Genet. 1999;65:562–566. doi: 10.1086/302514. [DOI] [PMC free article] [PubMed] [Google Scholar]
- 7.Rauch A, Pfeiffer RA, Leipold G, Singer H, Tigges M, Hofbeck M. A novel 22q11.2 microdeletion in DiGeorge syndrome. Am J Hum Genet. 1999;64:659–666. doi: 10.1086/302235. [DOI] [PMC free article] [PubMed] [Google Scholar]
- 8.Karayiorgou M, Simon TJ, Gogos JA. 22q11.2 microdeletions: linking DNA structural variation to brain dysfunction and schizophrenia. Nat Rev Neurosci. 2010;11:402–416. doi: 10.1038/nrn2841. [DOI] [PMC free article] [PubMed] [Google Scholar]
- 9.Zemble R, Luning Prak E, McDonald K, McDonald-McGinn D, Zackai E, Sullivan K. Secondary immunologic consequences in chromosome 22q11.2 deletion syndrome (DiGeorge syndrome/velocardiofacial syndrome) Clin Immunol. 2010;136:409–418. doi: 10.1016/j.clim.2010.04.011. [DOI] [PMC free article] [PubMed] [Google Scholar]
- 10.Markert ML, Sarzotti M, Ozaki DA, Sempowski GD, Rhein ME, Hale LP, Le Deist F, Alexieff MJ, Li J, Hauser ER, Haynes BF, Rice HE, Skinner MA, Mahaffey SM, Jaggers J, Stein LD, Mill MR. Thymus transplantation in complete DiGeorge syndrome: immunologic and safety evaluations in 12 patients. Blood. 2003;102:1121–1130. doi: 10.1182/blood-2002-08-2545. [DOI] [PubMed] [Google Scholar]
- 11.Piliero LM, Sanford AN, McDonald-McGinn DM, Zackai EH, Sullivan KE. T-cell homeostasis in humans with thymic hypoplasia due to chromosome 22q11.2 deletion syndrome. Blood. 2004;103:1020–1025. doi: 10.1182/blood-2003-08-2824. [DOI] [PubMed] [Google Scholar]
- 12.Jerome LA, Papaioannou VE. DiGeorge syndrome phenotype in mice mutant for the T-box gene, Tbx1. Nat Genet. 2001;27:286–291. doi: 10.1038/85845. [DOI] [PubMed] [Google Scholar]
- 13.Lindsay EA, Vitelli F, Su H, Morishima M, Huynh T, Pramparo T, Jurecic V, Ogunrinu G, Sutherland HF, Scambler PJ, Bradley A, Baldini A. Tbx1 haploinsufficieny in the DiGeorge syndrome region causes aortic arch defects in mice. Nature. 2001;410:97–101. doi: 10.1038/35065105. [DOI] [PubMed] [Google Scholar]
- 14.Merscher S, Funke B, Epstein JA, Heyer J, Puech A, Lu MM, Xavier RJ, Demay MB, Russell RG, Factor S, Tokooya K, Jore BS, Lopez M, Pandita RK, Lia M, Carrion D, Xu H, Schorle H, Kobler JB, Scambler P, Wynshaw-Boris A, Skoultchi AI, Morrow BE, Kucherlapati R. TBX1 is responsible for cardiovascular defects in velo-cardio-facial/DiGeorge syndrome. Cell. 2001;104:619–629. doi: 10.1016/s0092-8674(01)00247-1. [DOI] [PubMed] [Google Scholar]
- 15.Yagi H, Furutani Y, Hamada H, Sasaki T, Asakawa S, Minoshima S, Ichida F, Joo K, Kimura M, Imamura S, Kamatani N, Momma K, Takao A, Nakazawa M, Shimizu N, Matsuoka R. Role of TBX1 in human del22q11.2 syndrome. Lancet. 2003;362:1366–1373. doi: 10.1016/s0140-6736(03)14632-6. [DOI] [PubMed] [Google Scholar]
- 16.Baumer A, Riegel M, Schinzel A. Non-random asynchronous replication at 22q11.2 favours unequal meiotic crossovers leading to the human 22q11.2 deletion. J Med Genet. 2004;41:413–420. doi: 10.1136/jmg.2003.016352. [DOI] [PMC free article] [PubMed] [Google Scholar]
- 17.Guris DL, Duester G, Papaioannou VE, Imamoto A. Dose-dependent interaction of Tbx1 and Crkl and locally aberrant RA signaling in a model of del22q11 syndrome. Dev Cell. 2006;10:81–92. doi: 10.1016/j.devcel.2005.12.002. [DOI] [PubMed] [Google Scholar]
- 18.Landthaler M, Yalcin A, Tuschl T. The human DiGeorge syndrome critical region gene 8 and Its D. melanogaster homolog are required for miRNA biogenesis. Curr Biol. 2004;14:2162–2167. doi: 10.1016/j.cub.2004.11.001. [DOI] [PubMed] [Google Scholar]
- 19.Salmena L, Poliseno L, Tay Y, Kats L, Pandolfi PP. A ceRNA hypothesis: the Rosetta Stone of a hidden RNA language? Cell. 2011;146:353–358. doi: 10.1016/j.cell.2011.07.014. [DOI] [PMC free article] [PubMed] [Google Scholar]
- 20.Bartel DP. MicroRNAs: target recognition and regulatory functions. Cell. 2009;136:215–233. doi: 10.1016/j.cell.2009.01.002. [DOI] [PMC free article] [PubMed] [Google Scholar]
- 21.Mendell JT, Olson EN. MicroRNAs in stress signaling and human disease. Cell. 2012;148:1172–1187. doi: 10.1016/j.cell.2012.02.005. [DOI] [PMC free article] [PubMed] [Google Scholar]
- 22.Fenelon K, Mukai J, Xu B, Hsu PK, Drew LJ, Karayiorgou M, Fischbach GD, Macdermott AB, Gogos JA. Deficiency of Dgcr8, a gene disrupted by the 22q11.2 microdeletion, results in altered short-term plasticity in the prefrontal cortex. Proc Natl Acad Sci U S A. 2011;108:4447–4452. doi: 10.1073/pnas.1101219108. [DOI] [PMC free article] [PubMed] [Google Scholar]
- 23.Stark KL, Xu B, Bagchi A, Lai WS, Liu H, Hsu R, Wan X, Pavlidis P, Mills AA, Karayiorgou M, Gogos JA. Altered brain microRNA biogenesis contributes to phenotypic deficits in a 22q11-deletion mouse model. Nat Genet. 2008;40:751–760. doi: 10.1038/ng.138. [DOI] [PubMed] [Google Scholar]
- 24.Dozmorov I, Centola M. An associative analysis of gene expression array data. Bioinformatics. 2003;19:204–211. doi: 10.1093/bioinformatics/19.2.204. [DOI] [PubMed] [Google Scholar]
- 25.Dozmorov I, Lefkovits I. Internal standard-based analysis of microarray data. Part 1: analysis of differential gene expressions. Nucleic Acids Res. 2009;37:6323–6339. doi: 10.1093/nar/gkp706. [DOI] [PMC free article] [PubMed] [Google Scholar]
- 26.Dozmorov IM, Jarvis J, Saban R, Benbrook DM, Wakeland E, Aksentijevich I, Ryan J, Chiorazzi N, Guthridge JM, Drewe E, Tighe PJ, Centola M, Lefkovits I. Internal standard-based analysis of microarray data2—analysis of functional associations between HVE-genes. Nucleic Acids Res. 2011;39:7881–7899. doi: 10.1093/nar/gkr503. [DOI] [PMC free article] [PubMed] [Google Scholar]
- 27.Geiss GK, Bumgarner RE, Birditt B, Dahl T, Dowidar N, Dunaway DL, Fell HP, Ferree S, George RD, Grogan T, James JJ, Maysuria M, Mitton JD, Oliveri P, Osborn JL, Peng T, Ratcliffe AL, Webster PJ, Davidson EH, Hood L, Dimitrov K. Direct multiplexed measurement of gene expression with color-coded probe pairs. Nat Biotechnol. 2008;26:317–325. doi: 10.1038/nbt1385. [DOI] [PubMed] [Google Scholar]
- 28.Chaussabel D, Quinn C, Shen J, Patel P, Glaser C, Baldwin N, Stichweh D, Blankenship D, Li L, Munagala I, Bennett L, Allantaz F, Mejias A, Ardura M, Kaizer E, Monnet L, Allman W, Randall H, Johnson D, Lanier A, Punaro M, Wittkowski KM, White P, Fay J, Klintmalm G, Ramilo O, Palucka AK, Banchereau J, Pascual V. A modular analysis framework for blood genomics studies: application to systemic lupus erythematosus. Immunity. 2008;29:150–164. doi: 10.1016/j.immuni.2008.05.012. [DOI] [PMC free article] [PubMed] [Google Scholar]
- 29.Dozmorov MG, Guthridge JM, Hurst RE, Dozmorov IM. A comprehensive and universal method for assessing the performance of differential gene expression analyses. PLoS One. 2010;5 doi: 10.1371/journal.pone.0012657. [DOI] [PMC free article] [PubMed] [Google Scholar]
- 30.Papadopoulos GL, Alexiou P, Maragkakis M, Reczko M, Hatzigeorgiou AG. DIANA-mirPath: integrating human and mouse microRNAs in pathways. Bioinformatics. 2009;25:1991–1993. doi: 10.1093/bioinformatics/btp299. [DOI] [PubMed] [Google Scholar]
- 31.Vlachos IS, Kostoulas N, Vergoulis T, Georgakilas G, Reczko M, Maragkakis M, Paraskevopoulou MD, Prionidis K, Dalamagas T, Hatzigeorgiou AG. DIANA miRPath v. 2.0: investigating the combinatorial effect of microRNAs in pathways. Nucleic Acids Res. 2012;40:W498–W504. doi: 10.1093/nar/gks494. [DOI] [PMC free article] [PubMed] [Google Scholar]
- 32.Earls LR, Fricke RG, Yu J, Berry RB, Baldwin LT, Zakharenko SS. Age-dependent microRNA control of synaptic plasticity in 22q11 deletion syndrome and schizophrenia. J Neurosci. 2012;32:14132–14144. doi: 10.1523/JNEUROSCI.1312-12.2012. [DOI] [PMC free article] [PubMed] [Google Scholar]
- 33.Digilio MC, Marino B, Formigari R, Giannotti A. Maternal diabetes causing DiGeorge anomaly and renal agenesis. Am J Med Genet. 1995;55:513–514. doi: 10.1002/ajmg.1320550427. [DOI] [PubMed] [Google Scholar]
- 34.Van Esch H, Groenen P, Fryns JP, Van de Ven W, Devriendt K. The phenotypic spectrum of the 10p deletion syndrome versus the classical DiGeorge syndrome. Genet Couns. 1999;10:59–65. [PubMed] [Google Scholar]
- 35.Ensenauer RE, Adeyinka A, Flynn HC, Michels VV, Lindor NM, Dawson DB, Thorland EC, Lorentz CP, Goldstein JL, McDonald MT, Smith WE, Simon-Fayard E, Alexander AA, Kulharya AS, Ketterling RP, Clark RD, Jalal SM. Microduplication 22q11.2, an emerging syndrome: clinical, cytogenetic, and molecular analysis of thirteen patients. Am J Hum Genet. 2003;73:1027–1040. doi: 10.1086/378818. [DOI] [PMC free article] [PubMed] [Google Scholar]
- 36.Lichtner P, Konig R, Hasegawa T, Van Esch H, Meitinger T, Schuffenhauer S. An HDR (hypoparathyroidism, deafness, renal dysplasia) syndrome locus maps distal to the DiGeorge syndrome region on 10p13/14. J Med Genet. 2000;37:33–37. doi: 10.1136/jmg.37.1.33. [DOI] [PMC free article] [PubMed] [Google Scholar]
- 37.Van Esch H, Groenen P, Nesbit MA, Schuffenhauer S, Lichtner P, Vanderlinden G, Harding B, Beetz R, Bilous RW, Holdaway I, Shaw NJ, Fryns JP, Van de Ven W, Thakker RV, Devriendt K. GATA3 haplo-insufficiency causes human HDR syndrome. Nature. 2000;406:419–422. doi: 10.1038/35019088. [DOI] [PubMed] [Google Scholar]
- 38.Belver L, de Yebenes VG, Ramiro AR. MicroRNAs prevent the generation of autoreactive antibodies. Immunity. 2010;33:713–722. doi: 10.1016/j.immuni.2010.11.010. [DOI] [PMC free article] [PubMed] [Google Scholar]
- 39.Belkaya S, Murray S, Eitson JL, de la Morena MT, Forman JA, van Oers NS. T-cell specific transgenic expression of microRNA-185 causes a severe T cell lymphopenia. submitted for publication. [DOI] [PMC free article] [PubMed] [Google Scholar]
- 40.Flach H, Rosenbaum M, Duchniewicz M, Kim S, Zhang SL, Cahalan MD, Mittler G, Grosschedl R. Mzb1 protein regulates calcium homeostasis, antibody secretion, and integrin activation in innate-like B cells. Immunity. 2010;33:723–735. doi: 10.1016/j.immuni.2010.11.013. [DOI] [PMC free article] [PubMed] [Google Scholar]
- 41.O’Connell RM, Rao DS, Chaudhuri AA, Baltimore D. Physiological and pathological roles for microRNAs in the immune system. Nat Rev Immunol. 2010;10:111–122. doi: 10.1038/nri2708. [DOI] [PubMed] [Google Scholar]
- 42.Rogler CE, Levoci L, Ader T, Massimi A, Tchaikovskaya T, Norel R, Rogler LE. MicroRNA-23b cluster microRNAs regulate transforming growth factor-beta/bone morphogenetic protein signaling and liver stem cell differentiation by targeting Smads. Hepatology. 2009;50:575–584. doi: 10.1002/hep.22982. [DOI] [PubMed] [Google Scholar]
- 43.de Pontual L, Yao E, Callier P, Faivre L, Drouin V, Cariou S, Van Haeringen A, Genevieve D, Goldenberg A, Oufadem M, Manouvrier S, Munnich A, Vidigal JA, Vekemans M, Lyonnet S, Henrion-Caude A, Ventura A, Amiel J. Germline deletion of the miR-17[sim]92 cluster causes skeletal and growth defects in humans. Nat Genet. 2011;43:1026–1030. doi: 10.1038/ng.915. [DOI] [PMC free article] [PubMed] [Google Scholar]
Associated Data
This section collects any data citations, data availability statements, or supplementary materials included in this article.