

Abstract
Recent advances in molecular technique have now made it possible to interrogate the human microbiome in depth to better understand the interactions with the host organism and its role in diseases. We now report the utility of using Length Heterogeneity Polymerase Chain Reaction (LH-PCR) to survey samples and a proprietary Multitagged Pyrosequencing (MTPS) methodology to interrogate the gut microbiome in healthy and disease states. We present an overview of our studies demonstrating that the application of these molecular biology techniques to an example disease state such as Inflammatory Bowel Disease (IBD). The findings show that there is a core mucosal bacterial microbiome (i.e. a mucosal biofilm) that is distinct from the luminal microbiome in health and that the mucosal microbiome appears to be dysbiotic in IBD. We propose that the mucosal microbiome forms a synergistic and stable interaction with the host immune system, while the lumen microbiome varies based on diet or other environmental factors. We define this composite ecosystem of the human microbiome and human host as the Human Metabiome.
Introduction
Recent studies highlighted the importance of gut microbiota/microbiome in pathogenesis of several diseases including obesity, systemic and intestinal inflammatory disorders and cancers to name a few. Mammalian gut harbors one of the richest and most complex microbial communities. Recent advance in molecular techniques have now made it possible to fully interrogate the gut microbiome and better understand its role in chronic diseases. It is also not clear whether stool samples are the best medium to interrogate microbiota to determine clinically relevant changes in microbiota community (i.e. dysbiosis). We now report the utility of Length Heterogeneity Polymerase Chain Reaction (LH-PCR) followed by a proprietary Multitagged Pyrosequencing (MTPS) methodology [1] to interrogate gut microbiome in healthy and disease states.
The use of molecular methodologies now enables one to study the entire gut microbiome, including uncultured species, which has been estimated to contain a minimum of 400–1000 bacterial species [2]. With the advent of NextGen sequencing methodologies [3], one can exhaustively analyze the 16S Ribosomal RNA genes (16S rRNA) in a sample to phylogenetically characterize the microbiome in any ecosystem [4]. This phylogenetic characterization of a particular microbiome can be thought of as a surrogate for determining the functionality of that ecosystem [5] as each taxa has a characteristic metabolic profile. One critical issue is whether the methodologies employed in microbiota characterizations are faithfully reproducing the community composition and not distorting it due to experimental kinetic bias [6] or sequencing artifacts [7].
We present an overview of our studies demonstrating that LH-PCR can be used as both a quality assurance test to titrate community DNA to assure that there is no kinetic bias in the analysis and as a preliminary screening method to select samples of interest. We also present a proprietary Multitag Pyrosequencing (MTPS) methodology [1] that allows the analysis of dozens of samples in one instrument run without distorting the community profile through ligation artifacts. Finally, we exemplify the use of LH-PCR in patients with Inflammatory Bowel Disease (IBD) and present our pilot studies demonstrating that there is a mucosal microbiome that is distinct from the lumen microbiome and that shifts in the community composition between these two compartments (dysbiosis) is correlated with disease state. IBD was chosen as an exemplary disease state because: (1) IBDs are common, life-long, relapsing illnesses that have no known cause or cure and have an increasing incidence in developed societies [8–10]; (2) IBD seems to result from an abnormal inflammatory response to microbial antigens in the GI tract [11]; (3) Experimental models of IBD indicate an absolute need for colonization with bacteria for disease development, regardless of the type of genetic defect leading to disease susceptibility[12, 13]. This suggests a central role for bacteria in the pathogenesis of Ulcerative Colitis (UC) and Crohn’s Disease (CD); (4) Many clinical facts also support such a central role for bacteria in disease pathogenesis. For example, altering the fecal microbiota by elemental diets, antibiotics, or probiotics can be beneficial in the treatment of IBD.
Results and Discussion
LH-PCR fingerprinting characterizes the organisms in a community by amplifying variable regions of the 16S rRNA gene of a microbial community and separating the Polymerase Chain Reaction (PCR) products based on the natural variation in amplicon length and base composition using capillary electrophoresis. We typically amplify the first two variable regions of the 16S rRNA gene using 27F and 355R universal bacterial primers and perform triplicate assays using several 10 fold dilutions of the community DNA. Figure 1 depicts triplicate assays of a mucosal microbiome sample that has been titrated to optimize the community profile. We then used these conditions to amplify the community with tagged fusion primers for the MTPS process (see below). Unless one titrates the DNA in the sample, one cannot be assured that the resulting sequence analysis truly represents the community composition.
Figure 1. Triplicate LH-PCR assays of a human mucosal microbiome sample demonstrating the reproducibility of the technique.

Replicates of chromatographic profile from the SCE 9610 Fluorescent DNA sequencer as shown in the three panels. The relative fluorescence (y-axis) is plotted against the interpolated amplicon fragments sizes.
The peak area in the LH-PCR profile is proportional to the abundance of that amplicon in the community but is complicated by the fact that various bacterial taxa have varying numbers of the rRNA operon. It should also be noted that there may be more than one species/genus within the same amplicon size in these community profiles and thus the peaks in the LH-PCR fingerprints may actually be monitoring the dynamics of more than one genus/species. Nevertheless, LH-PCR has been successfully used to estimate the diversity present in bacterioplankton [6] and studies evaluating the robustness of this method have been found it to be highly reproducible [14–16]. The LH-PCR fingerprinting methodology is inexpensive and fast with the ability to screen several hundred samples a day. Thus we routinely use it to titrate the DNA from a microbiome sample, monitor the dynamics of a community, and to quickly identify samples of interest.
Example survey of the mucosal microbiome using LH-PCR in a disease state
We performed LH-PCR on mucosal biopsies from a healthy controls (HC) and patients with Crohn’s Disease (CD) and Ulcerative Colitis (UC). We define the peaks in the LH-PCR fingerprints as Operational Taxonomic Units (OTU) as they are an indirect indictor of bacterial groupings. We plotted the normalized OTU abundances as a Principle Coordinate Analysis (PCO) scatter plot (Figure 2). It can be seen that the PCO clustering does separate many of the CD and UC samples from each other and separates them from the healthy controls.
Figure 2. PCO analysis of taxa abundance from mucosal microbiome samples from IBD patients.

The normalized abundance of taxa from IBD and Control mucosa and lumen samples are plotted as a scatter diagram. The triangles represent Healthy Control mucosa and lumen samples, the squares represent Crohn’s Disease mucosa and lumen samples, and the circles represent Ulcerative Colitis mucosa and lumen samples.
Our previous observations [17] and those of others [18] have suggested that there is considerable variation in the minor components of the mucosal microbiome between individuals but that the major components are similar between normal individuals suggesting that there is a core microbiome and we have observed that these major components correlate with disease. Thus, we hypothesize that the major components of the mucosal microbiome contribute to the bulk of the interactive functionality of the Human Metabiome on a simple mass basis. Minor components may also contribute to Metabiome functionality and disease, especially when one considers inflammatory cascades, but the role for major components can be exemplified by our observations in IBD.
A proportion of IBD samples have dysbiotic microbiota resulting in a distinct clustering of microbiota separate from the controls (Figure 2). This observed primary difference between microbiota in IBD subjects compared to controls appears to be due to the loss of distinction between the mucosal microbiome (or mucosa-associated microbiome) and luminal bacteria in patients with IBD. Interestingly, there is significant overlap between samples from subjects diagnosed with CD and UC. It is not clear whether this is due to variations in disease pattern or whether ambiguities in the LH-PCR methodology is a limiting factor in separating the disease subtypes completely. Another potential explanation is that there may be a dysbiosis pattern reflecting chronic inflammation superimposed on a disease specific dysbiosis pattern.
Cloning and Sequencing of the Gut Microbiome in IBD and Healthy Subjects
We have also cloned and sequenced pooled samples of UC, CD and HC. Table I shows the bacteria composing at least 2% of the total pool abundance. When the data are examined at RDP phylotype level 4 [19], there is a decrease in the Bacteroides group in UC and CD. The results indicate that the bacterial microbiota found on the mucosal surface of CD and UC samples resemble the bacterial microbiota composition of lumen in healthy individuals. Thus the microbiota composition of mucosa in healthy individuals is very different from the mucosa composition in the disease state. For example, the Clostridium botulinum and Enteroccoci groups are associated with the mucosal surface of UC and Cytophaga group I seems to be associated with CD mucosal surface and stool samples. The diagnostic and therapeutic implications of this observation needs to be further explored [20].
Distortion of the community composition using ligated primers
Several groups have utilized the standard Roche pyrosequencing protocol to interrogate microbiomes or perform metagenomic analysis. The current Roche protocol for Pyrosequencing involves the ligation of 20 base pair linkers to the samples that is required for the emulsion PCR process. We ran several duplicate samples on a GS FLX run and determined that this ligation process distorts the abundances of various components in the replicate samples. Specifically, we used tagged PCR primers to amplify the components in duplicate microbial community samples, ligated the emulsion PCR adapters to these samples as described by Roche and analyzed the PCR amplicons on an Agilent Bioanalyzer system before and after ligation to quantitate the samples. Figure 3 depicts a microbiome sample run on the Bioanalyzer before (3A) and after (3B) direct ligation and clearly shows that the ligation step has drastically altered the distribution of the amplicons. Specifically, one can see that each of the original peaks is apparently split into at least two peaks, probably representing a ligated and unligated fragments, but the proportion of ligated fragments is variable depending on the size of the fragment and community composition. Note that the numbers on the peaks are area quantitations, not fragment sizes. This differential ligation efficiency is probably due to a number of factors such as internal structure of the amplicons or ligation biases with respect to the terminal nucleotide of the amplicon in the community. Furthermore, many of the sequence reads were chimeric, probably the result of the ligation of truncated PCR products.
Figure 3. Community profile before and after the ligation step.
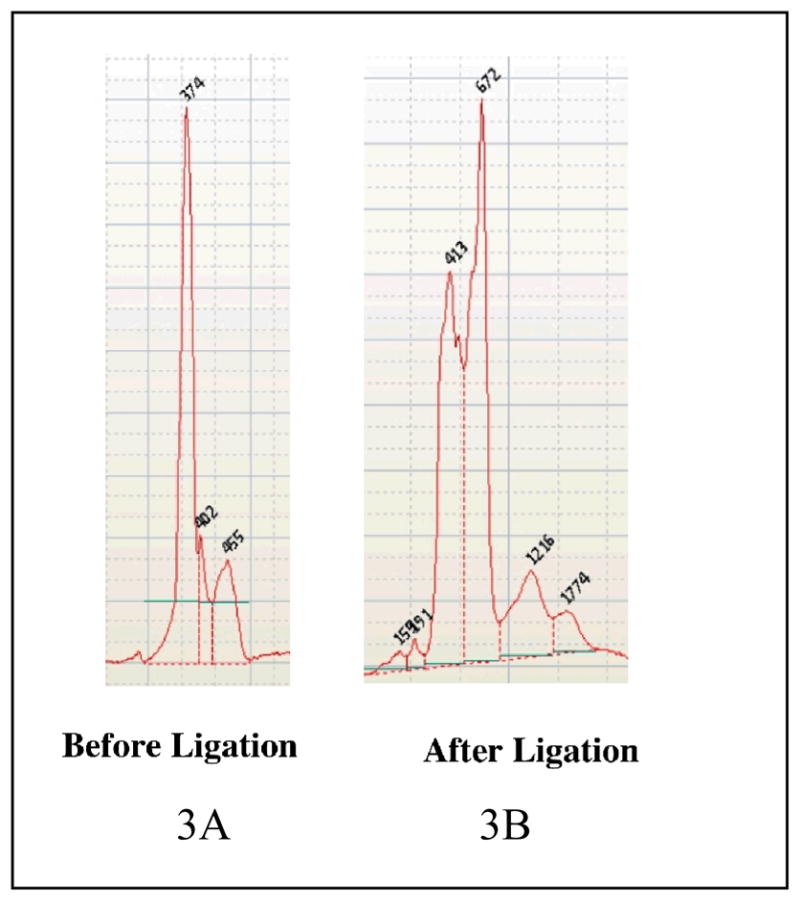
Figure 3A depicts the community profile before ligation of the 454 linkers while Figure 3B depicts the community profile after ligation.
Multitag Pyrosequencing of Controls using Tagged Fusion Primers
This ligation problem led us to develop a new proprietary process where we have constructed tagged fusion primers that contain the sequence specific for the PCR target (i.e. 16S rRNA), a 7 base barcode, and the emulsion PCR adapters. Figure 4A depicts the LH-PCR profile of a mucosal sample amplified with a tagged 16S rRNA primer and Figure 4B depicts the community profile amplified using a tagged fusion primer. One can see that the complex community pattern produced by the tagged primer is shifted by 19 bp when amplified by the tagged fusion primer and the relative abundances of each peak in the profile remains the same. Thus the use of tagged fusion primers eliminates the need for the ligation step and does not distort the community composition.
Figure 4. LH-PCR using a tagged primer (A) and a tagged fusion primer (B).
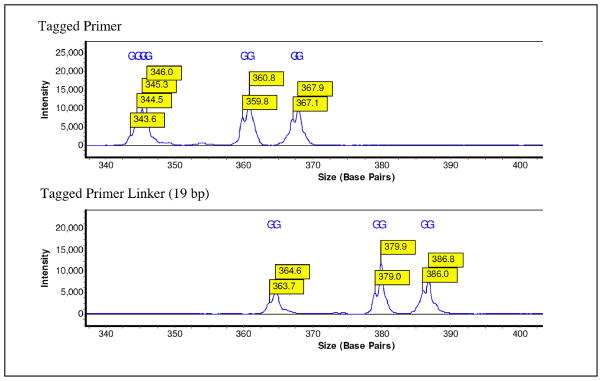
Figure 4A depicts the LH-PCR profile of a microbiome community using a tagged forward primer. Figure 4B depicts the LH-PCR profile of the same microbiome community using a tagged fusion primer with the 454 A linker attached.
We recently amplified triplicate samples using both forward and reverse tagged fusion primers (27F and 355R universal 16S rRNA primers) on 8 mucosal samples (i.e. 8 samples with 3 forward primers and 3 reverse primers = 48 total samples) and ran a MTPS pyrosequencing run on 1/2 of a LR75 plate. The run yielded 133,757 reads with an average read length of 235 bases (total of 31,444,588 bases) and obtained an average of 2,786 reads per sample.
We identified the taxa in the sample using a custom PERL script to search the RDP8.1 database and selected the highest bit score for identification of the component taxa at the Subdivision level (Level 4). We then enumerated and normalized the abundance of the taxa in each samples. We present the replicates as a bar chart of taxa abundance greater than 1% in asymptomatic Healthy Controls (Figure 5). The orange bars represent the Bifidobacter, yellow bars represent the Bacteriodes, blue bars represent the Firmicutes, red bars represent the Enterics, and the dark green in the last three replicates represent the abundance of Steptococcus. Clearly the replicates are quite good and the compositions of the microbiome from all but one subject are similar indicate that there is a core mucosal microbiome in humans. It should be noted that the variable component of the mucosal microbiome composes between 10 and 30 percent of the total microbiome (Figure 5).
Figure 5. Multitag Pyrosequencing of Healthy Controls.

Figure 5 depicts a stacked histogram of the taxa abundance from replicates of Healthy Control microbiome samples. The taxa are identified using Level 4 of the RDP8 taxanomic hierarchy. Microbiome samples are labeled on the x axis and the normalized abundance is plotted on the y axis. The color code is defined in the inset on the right of the figure.
The last subject presented as a healthy male but clearly his microbiome represents a “Variant Phenotype.” The cause of this variation is unknown as the subject did not report any dietary restrictions or present with any clinical disease symptoms. Thus, we conclude that there is a core mucosal microbiome in most people but there are also “Variant Phenotypes” that are either asymptomatic or actually completely healthy.
We have demonstrated the utility of using Length Heterogeneity PCR (LH-PCR) as a preliminary screening method to select microbiome samples of interest and described a proprietary Multitag Pyrosequencing methodology [1] that allows the analysis of dozens of samples in one instrument run without distorting the community profile through ligation artifacts. The data indicates that community analysis studies using the current Roche may need to be re-evaluated. Furthermore, metagenomic analysis utilizing the Multiplex Identifier (MID) kit sold by Roche should be viewed with some caution as it employs a ligation step to attach the emulsion PCR linkers and may introduce chimeric sequences and ligation biases into the analysis.
We have demonstrated that it is not necessary to sequence human gut microbiome samples exhaustively as the characterization of the few thousand reads from a sample is sufficient to correlate major taxa with our example disease state, IBD [20]. Specifically, analysis of taxa that are present at greater than 1% abundance was able to distinguish a mucosal microbiome that is distinct from the lumen microbiome and shifts in the community composition between these two compartments (dysbiosis) were correlated with Crohn’s Disease and Ulcerative Colitis but further experiments are needed to verify these preliminary observations. However, even when larger number of cases, it will be difficult to correlate rare taxa with a disease class as most statistical analyses will be dominated by the influence of the abundant taxa. One approach is to use network analysis which would allow the correlation of rare phenotypes with disease [21, 22] especially if a rare feature is consistently present in all or most samples of the same disease class. Finally, there is an ecological argument that the bulk of the microbial biomass contributes to the bulk if the ecological (metabolic) function of the system with the caveat that minor components may actually have larger effects with respect to immunological function. We will also suggest the need to characterize human gut mucosa-associated microbiome as part of the Human Microbiome Project as many current projects are focused only on the analysis of stool which may not even represent the luminal compartment of the Human Metabiome.
Experimental Part
Tissue samples and subjects
We performed LH-PCR on 93 biopsies from patients with UC (20 samples from 2 subjects), CD (38 samples from 4 subjects), and Healthy controls (HC) (n=35 samples from 4 subjects), recruited at a tertiary medical center after IRB approval and obtaining informed consent. IBD was diagnosed with presence of classical symptoms, typical endoscopic and histological features. Patients on NSAID or subjects who took antibiotics within the past 1 month were excluded. HC were composed of patients undergoing colonoscopy for cancer screening. Colonoscopy was performed using Olympus video colonoscopes (Olympus America Inc, Center Valley, PA) after a 4 L polyethylene glycol or fleet’s phosphosoda preparation. Mucosal biopsies were collected at the time of colonoscopy with a 2.2 mm standard biopsy forceps from the last 10 cm of the terminal ileum (Ileum or I), within 10–15 cm of the cecum at the ascending colon (right colon or RC), mid point of scope insertion in the transverse colon (transverse colon or TC), at 20–25 cm from the anal verge in the sigmoid (left colon or LC) and at the distal 10 cm of the colon (rectum or R). Samples of fecal matter (lumen samples or L) were also collected. All samples were immediately snap frozen at the time of collection in liquid nitrogen in the endoscopy suite and were stored in a −70 °C freezer.
We performed MTPS on eight sigmoid biopsy samples from 8 healthy individuals, obtained during a limited unprepped flexible sigmoidoscopy to 20–25 cm from the anal verge with a 2.2 mm standard biopsy forceps.
LH- PCR Fingerprint Analysis
Total genomic DNA was extracted from samples using Bio101 kit from Qbiogene, Inc., Montreal, Quebec. Extracted DNA (10 ng) is amplified by PCR using a fluorescently labeled forward primer 27F (5′-[6FAM] AGAGTTTGATCCTGGCTCA G-3′) and unlabeled reverse primer 355R′ (5′-GCTGCCTCCCGTAGGAGT-3′). Both primers are universal primers for Bacteria [23]. The reactions are performed using 20-ul final volume containing 1 X PCR buffer, 1.5 mM MgCl2, 0.2 mM of each deoxynucleoside triphosphate, 0.2 uM of each primer, and 2 U of Taq DNA polymerase. The initial denaturation step was 95°C for 11 minutes, followed by 35 cycles consisting of denaturation at 95°C for 30 seconds, annealing at 48°C for 30 seconds, extension at 72°C for 2 minutes, with a final extension step that consists of 72°C for 20 minutes. The LH-PCR amplification efficiency was quantified by agarose gel electrophoresis.
The LH-PCR products were diluted according to their intensity visualized by ethidium bromide staining on the agarose gel and mixed with ILS-600 size standards (Promega) and HiDi Formamide (ABI). The diluted samples were separated on the SCE9610 capillary fluorescent sequencer (Spectrumedix LLC, State College, PA) and analyzed with the GenoSpectrum™ software package (Version 2.01) which deconvolves the fluorescence data into electropherograms. The peaks of the electropherograms represent PCR amplicons of different length in base pairs (bp) which represent different groupings or OTUs of microbiota. All LH-PCR fingerprinting data were analyzed using a custom PERL script (Interleave 1.0, BioSpherex LLC) that combines data from several runs, interleaves the various profiles, normalizes the data, calculates the averages for each amplicon size for the disease state (i.e. averages for IBD and controls samples), and determines diversity indices. The normalized peak areas (abundance proportions) were calculated by dividing an individual peak area by the total peak area in that profile. A subset of the samples with the highest levels of diversity was then selected for cloning and sequencing based on this latter analysis.
Cloning and Sequencing
The PCR amplicons produced using unlabelled 27F and 355R primers were cloned using the TopoTA Cloning Kit (Invitrogen). Clones were screened for inserts using alpha-complementation with X-Gal (5-bromo-4chloro-3indoyl-B-D-galactopyranoside) and IPTG (isopropyl-B-D-thiogalactopyranoside). Positive clones were subjected to LH-PCR fingerprinting and clones were selected that corresponded to different PCR peaks in the community profile. These clones were sequenced by using Big Dye terminator chemistry and run on the SCE9610 sequencer. The clone sequences were compared to sequences in the RDP 8 database using a custom PERL script CloneID 1.0, (BioSpherex LLC, Stirling, VA). This algorithm uses Megablast to compare the clone sequence data to the RDP database, compiles a table using the RDP numbers to correlate species identification within the RDP hierarchical classification scheme. This custom PERL script annotates each clone with the corresponding RDP number obtained from the Megablast search results, which then is used to classify the Family/Genus/Species of each clone. Libraries were compared using the Bayesian Library Comparison program on the RDP web site (http://rdp.cme.msu.edu/).
Multitag Pyrosequencing
We amplified community samples with tagged fusion primers using the conditions standardized with the LH-PCR analysis depicted above. The tagged samples were purified using Ampure magnetic bead solution (Agencourt Bioscience Corp.), pooled and subjected to pyrosequeing on a Roche GS-FLX instrument. The filtered reads were sorted based on the tags using a custom PERL script and analyzed as described above.
PCO Analysis
LH-PCR fingerprint patterns (i.e. presence or absence of certain amplicon peaks) associated with presence of disease were identified by histograms of the LH-PCR amplicon normalized abundances. Principal component analysis (PCO) was used to analyze LH-PCR patterns using MVSP (Kovach, Wales, UK)
Table 1. Taxa abundance of Mucosal and Lumen Microbiome in Inflammatory Bowel Disease.
The table depicts the normalized abundance of various taxonomic groups in the microbiome of Healthy controls, Crohns patients and Ulcerative colitis (UC) patients. The taxa identification is based on the Level 3 of the Ribosomal Database Version 8.
| RDP GROUP | Control Mucosa | Control Lumen | Crohns Mucosa | Crohns Lumen | UC Mucosa | UC Lumen |
|---|---|---|---|---|---|---|
| BACTEROIDES_GROUP | 0.38 | 0.19 | 0.07 | |||
| BACTEROIDES_GROUP | 0.08 | |||||
| PROPIONIBACTERIUM_GROUP | 0.06 | |||||
| CLOSTRIDIUM_COCCOIDES_GROUP | 0.09 | |||||
| PSEUDOMONAS_AND_RELATIVES | 0.10 | |||||
| PSEUDOMONAS_AND_RELATIVES | 0.41 | 0.29 | 0.15 | 0.10 | 0.30 | |
| ACIDOVORAX_GROUP | 0.14 | 0.13 | 0.12 | 0.12 | 0.14 | |
| ACIDOVORAX_GROUP | 0.15 | 0.29 | 0.23 | 0.39 | 0.19 | |
| CYTOPHAGA_GROUP_I | 0.09 | 0.08 | 0.11 | |||
| CLOSTRIDIUM_BOTULINUM_GROUP | 0.06 | |||||
| ENTEROCOCCUS_GROUP | 0.06 |
Acknowledgments
The study was supported by NIH grant RO-1 AA 013745 (to AK); R 21 DK071838 (to EM); R21 AT001628 (to EM); and SBIR 1R43DK074275 (to PMG).
References
- 1.Gillevet PM. EPO 07871488.8, PCT/US2007/084840, WPO. BioSpherex LLC; Multitag Sequencing and Ecogenomic Analysis. 2006
- 2.Ley RE, Lozupone CA, Hamady M, Knight R, Gordon JI. Nature Reviews: Microbiology. 2008;6(10):776–788. doi: 10.1038/nrmicro1978. [DOI] [PMC free article] [PubMed] [Google Scholar]
- 3.Margulies M, Egholm M, Altman WE, Attiya S, Bader JS, Bemben LA, Berka J, Braverman MS, Chen YJ, Chen Z, Dewell SB, Du L, Fierro JM, Gomes XV, Godwin BC, He W, Helgesen S, Ho CH, Ho CH, Irzyk GP, Jando SC, Alenquer MLI, Jarvie TP, Jirage KB, Kim JB, Knight JR, Lanza JR, Leamon JH, Lefkowitz SM, Lei M, Li J, Lohman KL, Lu H, Makhijani VB, McDade KE, McKenna MP, Myers EW, Nickerson E, Nobile JR, Plant R, Puc BP, Ronan MT, Roth GT, Sarkis GJ, Simons JF, Simpson JW, Srinivasan M, Tartaro KR, Tomasz A, Vogt KA, Volkmer GA, Wang SH, Wang Y, Weiner MP, Yu P, Begley RF, Rothberg JM. Nature. 2005;437(7057):376–80. doi: 10.1038/nature03959. [DOI] [PMC free article] [PubMed] [Google Scholar]
- 4.Tannock GW. Eur J Clin Nutr. 2002;56(Suppl 4):S44–9. doi: 10.1038/sj.ejcn.1601661. [DOI] [PubMed] [Google Scholar]
- 5.Li M, Wang B, Zhang M, Rantalainen M, Wang S, Zhou H, Zhang Y, Shen J, Pang X, Zhang M, Wei H, Chen Y, Lu H, Zuo J, Su M, Qiu Y, Jia W, Xiao C, Smith LM, Yang S, Holmes E, Tang H, Zhao G, Nicholson JK, Li L, Zhao L. PNAS, USA. 2008;105(6):2117–22. doi: 10.1073/pnas.0712038105. [DOI] [PMC free article] [PubMed] [Google Scholar]
- 6.Suzuki M, Rappe MS, Giovannoni SJ. Appl Environ Microbiol. 1998;64(11):4522–9. doi: 10.1128/aem.64.11.4522-4529.1998. [DOI] [PMC free article] [PubMed] [Google Scholar]
- 7.Huse SM, Dethlefsen L, Huber JA, Welch DM, Relman DA, Sogin ML, Eisen JA. PLoS Genetics. 2008;4(11):e1000255. doi: 10.1371/journal.pgen.1000255. [DOI] [PMC free article] [PubMed] [Google Scholar]
- 8.Loftus EV., Jr Gastroenterology. 2004;126(6):1504–17. doi: 10.1053/j.gastro.2004.01.063. [DOI] [PubMed] [Google Scholar]
- 9.Turunen P, Kolho KL, Auvinen A, Iltanen S, Huhtala H, Ashorn M. Inflamm Bowel Dis. 2006;12(8):677–83. doi: 10.1097/00054725-200608000-00002. [DOI] [PubMed] [Google Scholar]
- 10.Vind I, Riis L, Jess T, Knudsen E, Pedersen N, Elkjaer M, Bak Andersen I, Wewer V, Norregaard P, Moesgaard F, Bendtsen F, Munkholm P. Am J Gastroenterol. 2006;101(6):1274–82. doi: 10.1111/j.1572-0241.2006.00552.x. [DOI] [PubMed] [Google Scholar]
- 11.Hanauer SB. Inflamm Bowel Dis. 2006;12(Suppl 1):S3–9. doi: 10.1097/01.mib.0000195385.19268.68. [DOI] [PubMed] [Google Scholar]
- 12.Kuhn R, Lohler J, Rennick D, Rajewsky K, Muller W. Cell. 1993;75(2):263–74. doi: 10.1016/0092-8674(93)80068-p. [DOI] [PubMed] [Google Scholar]
- 13.Sundberg JP, Elson CO, Bedigian H, Birkenmeier EH. Gastroenterology. 1994;107(6):1726–35. doi: 10.1016/0016-5085(94)90813-3. [DOI] [PubMed] [Google Scholar]
- 14.Mills DK, Fitzgerald K, Litchfield CD, Gillevet PM. J Microbiol Method. 2003;54:57–74. doi: 10.1016/s0167-7012(03)00007-1. [DOI] [PubMed] [Google Scholar]
- 15.Ritchie NJ, Schutter ME, Dick RP, Myrold DD. Appl Environ Microbiol. 2000;66(4):1668–75. doi: 10.1128/aem.66.4.1668-1675.2000. [DOI] [PMC free article] [PubMed] [Google Scholar]
- 16.Dunbar J, Ticknor LO, Kuske CR. Appl Environ Microbiol. 2001;67:191–197. doi: 10.1128/AEM.67.1.190-197.2001. [DOI] [PMC free article] [PubMed] [Google Scholar]
- 17.Komanduri S, Gillevet PM, Sikaroodi M, Mutlu E, Keshavarzian A. Clinical Gastroenterology and Hepatology. 2007;5(3):352–360. doi: 10.1016/j.cgh.2007.01.001. [DOI] [PubMed] [Google Scholar]
- 18.Turnbaugh PJ, Ley RE, Mahowald MA, Magrini V, Mardis ER, Gordon JI. Nature. 2006;444(21/28):10271–031. doi: 10.1038/nature05414. [DOI] [PubMed] [Google Scholar]
- 19.Cole JR, Chai B, Marsh TL, Farris RJ, Wang Q, Kulam SA, Chandra S, McGarrell DM, Schmidt TM, Garrity GM, Tiedje JM. Nucleic Acids Research 2003. 2003 Jan 1;31(1):442–3. doi: 10.1093/nar/gkg039. [DOI] [PMC free article] [PubMed] [Google Scholar]
- 20.Gillevet PM. PCT/US05/39887, PCT/USPTO. George Mason University; Compositions and Methods for Diagnosing Colon Disorders. 2005
- 21.Naqvi A, Rangwala H, Keshavarzian A, Gillevet P. BMC Bioinformatics. 2009. (manuscript submitted) [Google Scholar]
- 22.Gillevet P, Mutlu EA, Sikaroodi M, Engen P, Kwasny M, Keshavarzian A. Heptology. 2010 (manuscript submitted) [Google Scholar]
- 23.Lane DJ. In: Nucleic acid techniques in bacterial systematics. Goodfellow M, editor. John Wiley & Sons Ltd; West Sussex, England: 1991. pp. 115–175. Received September 17, 2009. [Google Scholar]