

Abstract
Phosphorylation and activation of Akt1 is a crucial signaling event that promotes adipogenesis. However, neither the complex multistep process that leads to activation of Akt1 through phosphorylation at Thr308 and Ser473 nor the mechanism by which Akt1 stimulates adipogenesis is fully understood. We found that the BSD domain–containing signal transducer and Akt interactor (BSTA) promoted phosphorylation of Akt1 at Ser473 in various human and murine cells, and we uncovered a function for the BSD domain in BSTA-Akt1 complex formation. The mammalian target of rapamycin complex 2 (mTORC2) facilitated the phosphorylation of BSTA and its association with Akt1, and the BSTA-Akt1 interaction promoted the association of mTORC2 with Akt1 and phosphorylation of Akt1 at Ser473 in response to growth factor stimulation. Furthermore, analyses of bsta gene-trap murine embryonic stem cells revealed an essential function for BSTA and phosphorylation of Akt1 at Ser473 in promoting adipocyte differentiation, which required suppression of the expression of the gene encoding the transcription factor FoxC2. These findings indicate that BSTA is a molecular switch that promotes phosphorylation of Akt1 at Ser473 and reveal an mTORC2-BSTA-Akt1-FoxC2–mediated signaling mechanism that is critical for adipocyte differentiation.
INTRODUCTION
The phosphoinositide 3-kinase (PI3K) signaling pathway plays a critical role in human physiology, and its deregulation is linked with obesity, diabetes, and cancer (1, 2). Akt, a principal downstream effector of PI3K and a member of the AGC family of kinases, is activated by numerous physiological stimuli and regulates various cellular functions (1, 3). Akt activation occurs through a complex, multistep, phosphorylation-dependent mechanism that is incompletely understood (4–6). Like some other AGC-family kinases, Akt is phosphorylated in response to growth factor signaling by phosphoinositide-dependent kinase (PDK1) (7) in the activation loop (Thr308) and by mammalian target of rapamycin complex 2 (mTORC2) (8) in the C-terminal hydrophobic motif (Ser473). A third, highly conserved site present in the turn motif (Thr450) that facilitates folding and stabilization of Akt is also phosphorylated, albeit constitutively, by an mTORC2-dependent mechanism (9, 10). Although it has been associated with full Akt activation (11, 12), the physiological relevance of phosphorylation of Ser473 is uncertain (13–16). Indeed, when rictor or other vital components of mTORC2 are deleted, Akt that is only modified on Thr308 is sufficiently active to phosphorylate several key substrates, consistent with the kinase activity and function of Akt being determined by the phosphorylation status of Thr308. Therefore, the lethal phenotype of rictor−/− mice may result from modification of activity of specific Akt targets and inactivation of AGC kinases such as serum- and glucocorticoid-inducible kinase (SGK) (5). Nevertheless, specific effectors and regulators of both Akt and mTORC2 that would help delineate the precise physiological role of phosphorylation of Ser473 remain to be identified or better characterized.
The phosphorylation status, substrate specificity, membrane association, and stability of Akt are also regulated by nonenzymatic interacting proteins such as the inhibitor protein TRB3 (Tribbles homolog 3) and the adaptor protein APPL1 [adaptor protein, phosphotyrosine interaction, pleckstrin homology (PH) domain, and leucine zipper containing 1] (17, 18). By interacting with the PH, kinase, or C-terminal regions of Akt, such binding partners may mediate Akt activation and function in specific physiological or pathological contexts. Whether any of these proteins interact exclusively with Akt among the AGC kinases or primarily regulate phosphorylation at Ser473 is not known, however.
Consistent with previous in vitro studies, gene ablation experiments in mice have indicated that only Akt1 of the three Akt isoforms has an essential role in adipogenesis, a critical determinant of whole-body metabolism, energy homeostasis, and growth (19, 20). In comparison, Akt2 and Akt3 have been implicated in insulin signaling, organismal growth, and brain development (2). The mechanism underlying Akt1 function is still unclear, and it is conceivable that specific interacting proteins and transcription factor mediators regulate its activation and function in adipocyte development. Here, we identified BSTA as a regulator of growth factor–induced phosphorylation of Akt at Ser473. We also characterized the BSD domain of BSTA and demonstrated that BSTA and Akt coordinately promote adipocyte differentiation by suppressing the expression of the gene encoding the transcription factor FoxC2.
RESULTS
BSTA interacts with Akt
We used a modified yeast two-hybrid system (21) and truncated Akt1 (1 to 460 amino acids) as bait to screen a human liver complementary DNA (cDNA) library for Akt-interacting proteins (fig. S1A). We identified various clones that partially encoded a 352–amino acid protein with the National Center for Biotechnology Information (NCBI) gene symbol SYAP1 or synapse-associated protein 1 (gene ID: 94056). The proteins encoded by the partial SYAP1 clones interacted with Akt1 but showed little or no affinity for another PI3K-regulated AGC kinase, PDK1 (fig. S1, B and C). Both SYAP1 and Akt1 were detected in all human and murine tissue samples examined including white and brown adipose tissues (fig. S1, D and E). Human and murine SYAP1 are nearly identical and contain a conserved region known as the BSD domain (22), which is also present in Drosophila Sap47 and other proteins. Because SYAP1 may be ubiquitously distributed and not restricted to neurons and its function was not previously described, we refer to it as BSD domain–containing signal transducer and Akt inter-actor (BSTA).
We developed and validated two different anti-BSTA antibodies to examine BSTA in cells and detected a protein of about 55 kD (fig. S2A). Coimmunoprecipitation studies indicated that full-length FLAG-BSTA and Akt interacted with each other, and that this interaction was enhanced in cells that were stimulated with growth factors such as epidermal growth factor (EGF) or treated with the tyrosine phosphatase inhibitor pervanadate (fig. S2B). Coincident with increased phosphorylation of Akt, endogenous BSTA and Akt also interacted after EGF treatment (Fig. 1A and fig. S2, C and D). Because BSTA was phosphorylated (fig. S2, E and F) and the PI3K inhibitor LY294002 blocked its interaction with Akt (Fig. 1A and fig. S2D), BSTA-Akt complex formation likely depends on PI3K activation and subsequent posttranslational modifications.
Fig. 1.
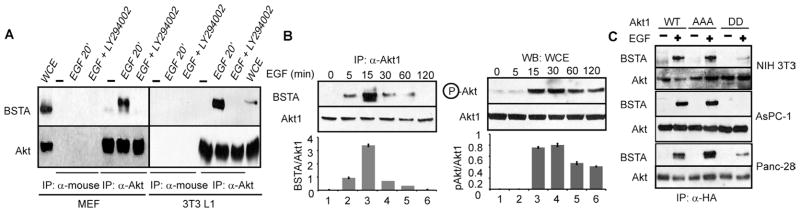
BSTA is a binding partner for Akt. (A) Immunoprecipitates from MEFs and 3T3 L1 cells treated as indicated were immunoblotted for BSTA and Akt. n = 5 blots. (B) Panc-28 cells treated with EGF were used for immunoprecipitations with anti-Akt1 or were immunoblotted. Densitometric data (n = 3 experiments) showing BSTA/Akt and pAkt/Akt ratios (means ± SD) are also presented below each representative blot. (C) Hemagglutinin (HA) immunoprecipitates from HA-Akt1–, HA-Akt1-AAA–, and HA-Akt1-DD–expressing stable cells (NIH 3T3 and Panc-28) or transient transfectants (AsPC-1) were immunoblotted for BSTA or Akt. n = 3 blots.
Kinetic analyses of the BSTA-Akt interaction and Akt phosphorylation suggested that BSTA-Akt complexes are rapidly assembled and may control the subsequent phosphorylation of Akt (Fig. 1B). BSTA interacted to the same extent with wild-type Akt1 and an Akt1 triple mutant (Akt-AAA) containing alanines in place of Thr308, Ser473, and the phosphate transfer residue in the catalytic domain, Lys179, but to a lesser extent with an Akt1 phosphomimetic mutant (Akt1-DD) containing aspartate residues instead of Thr308 and Ser473 (Fig. 1C) despite equal amounts of BSTA (fig. S3A). Complex formation between BSTA and wild-type Akt1 or Akt1-AAA did not appear to be affected by knockdown or pharmacological inhibition of endogenous Akt (fig. S3, B and C). Thus, the kinase activity of Akt was not essential for interaction with BSTA, and although Thr308 and Ser473 were also dispensable, the affinity of Akt for BSTA was reduced upon phosphorylation of one or both sites. The effect of LY294002 on BSTA-Akt interaction may therefore reflect a requirement of PI3K in the modification of BSTA or of another molecule in the complex.
The BSD domain mediates the interaction of BSTA with Akt1
To identify the function of BSTA, we first investigated the structural bases of its interaction with Akt by testing various deletion mutants and their ability to interact with Akt1 (1 to 460 amino acids). Full-length BSTA did not interact with Akt1 in yeast (Fig. 2A). Because the BSTA clones identified as interacting with Akt in the two-hybrid screen described above were partial clones (173 to 352 amino acids), we first generated two N-terminal deletion mutants from full-length BSTA lacking 130 or 172 amino acids. Because only the second mutant interacted with Akt1, a sequence in BSTA (131 to 172 amino acids) appeared to antagonize binding to Akt1 (Fig. 2A). Deletion analysis of Akt1 (fig. S4, A and B) suggested that 20 C-terminal amino acids similarly constrain full-length Akt1 (1 to 480 amino acids) from binding to BSTA (173 to 352 amino acids) and identified a putative BSTA-binding sequence (141 to 220 amino acids) in a region that undergoes a disorder-to-order transition and is critical for Akt activation (23). Thus, both BSTA and Akt1 may require structural modifications before they can interact in mammalian cells.
Fig. 2.
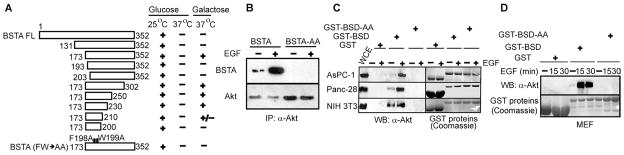
BSTA interaction and function require the BSD domain. (A) Full-length BSTA (BSTA FL) and its deletion mutants were tested for their interaction with Akt1 (1 to 460 amino acids). Yeast growth in a galactose medium (37°C) indicated an interaction: −, no growth and no interaction; +, strong growth and interaction; and +/−, weak growth and interaction. A BSTA mutant containing point mutations (F198A and W199A) was also tested. n = 3 experiments. (B) Akt immunoprecipitates from AsPC-1 cells transiently transfected with full-length wild-type (WT) or mutant BSTA (BSTA-AA) were immunoblotted for BSTA and Akt. n = 3 experiments. (C and D) GST-fused BSD (158 to 210 amino acids) or BSD-AA pull-downs from four different cell lines were immunoblotted for Akt. The GST proteins used were stained with Coomassie. n = 5 experiments.
Further analysis of BSTA and Akt1 in yeast identified a central region in BSTA (173 to 230 amino acids) that mediated strong interaction with Akt1 (Fig. 2A). Using Web-based sequence analyses tools (http://blast.ncbi.nlm.nih.gov/Blast.cgi?PAGE=Proteins), we determined that this minimal region overlapped the so-called BSD domain (158 to 210 amino acids), which is conserved in various proteins but whose function is unknown (22). The BSD domain has an FW motif that contains invariant neighboring phenyl-alanine and tryptophan residues (fig. S4C). A form of BSTA (173 to 352 amino acids) with mutations in the FW motif did not interact with Akt1 in the yeast two-hybrid assay (Fig. 2A). EGF did not induce the interaction of a full-length BSTA FW mutant (BSTA-AA) with endogenous Akt in mammalian cells (Fig. 2B). Glutathione S-transferase (GST) pull-down assays indicated that an intact BSD domain is sufficient to interact with Akt from human and murine cell extracts (Fig. 2, C and D). However, the BSD domain interacted with the Akt derived from EGF-stimulated cells only, suggesting that, like the deletion analysis above, Akt must be modified before it can bind to the BSD domain or BSTA. This is unlikely to involve phosphorylation of Thr308 or Ser473 because Akt1-AAA bound to BSTA (Fig. 1C and fig. S3B). It may not involve dimerization between BSD and any Akt-bound endogenous BSTA because BSTA did not form homodimers (fig. S4D).
The abundance of BSTA affects the phosphorylation of Akt
Because BSTA lacks the RXRXXS/T Akt substrate motif, and its interaction with Akt appeared to precede phosphorylation of Akt (Fig. 1B), we speculated that BSTA might promote activation of Akt. Indeed, the BSTA-AA mutant appeared to have dominant-negative effects and inhibited EGF- and serum-induced phosphorylation of Akt (Fig. 3A and fig. S5A). Expression of the wild-type BSD construct, but not of the BSD-AA mutant, inhibited phosphorylation of Akt, providing further evidence that BSTA and its BSD domain are critical for activation of Akt (Fig. 3B and fig. S5B). Furthermore, transfection of small interfering RNA (siRNA) directed against BSTA (fig. S5, C and D) inhibited EGF-induced phosphorylation of Akt without a concomitant decrease in total Akt (Fig. 3C). Because insulin-, insulin-like growth factor (IGF)–, and platelet-derived growth factor (PDGF)–induced phosphorylation of Akt was also inhibited, BSTA was essential for activation of Akt by multiple receptor tyrosine kinases (Fig. 3B and fig. S5E). In contrast, oxidative stress–inducing agents such as hydrogen peroxide activated Akt in the absence of BSTA (fig. S5F).
Fig. 3.

BSTA promotes phosphorylation of Akt. (A) Lysates from stable cell lines expressing vector, pMX-BSTA, or pMX-BSTA-AA that were serum-starved and stimulated with serum or EGF were immunoblotted for the indicated proteins. Densitometric data (n = 3 experiments) showing pAkt/Akt ratios (means ± SD; *P < 0.01) are also presented below each representative blot. (B) 3T3 L1 cells stably expressing FLAG-tagged BSD or BSD-AA were treated with EGF or insulin, and stable Panc-28 clones (right panel) expressing FLAG-tagged BSD1, BSD2, or BSD-AA were stimulated with EGF. Lysates were directly analyzed by immunoblotting for phosphorylated Ser473 in Akt or total Akt or were immunoprecipitated with anti-FLAG antibodies before Western blotting for FLAG-BSD. Densitometric data (n = 3 experiments) showing pAkt/Akt ratios (means ± SD) are also presented below each representative blot. (C) Cells transfected with control (Ctrl) or BSTA (human or murine) siRNAs were immunoblotted with anti–phosphorylated Ser473 Akt antibodies. Densitometric data (n = 3 experiments) showing pAkt/Akt ratios (means ± SD) are also presented below each representative blot.
Activation of Akt requires interaction between mTORC2 and BSTA
We next investigated whether BSTA regulates phosphorylation of Akt by controlling its translocation to or association with the plasma membrane (2). In control siRNA–transfected cells, EGF treatment increased the amount of Akt in the plasma membrane and its phosphorylation (fig. S6A). Although its function is unclear, EGF also increased the membrane-associated amounts of BSTA. Because the ability of EGF to increase the amount of Akt in the plasma membrane was essentially unaffected by BSTA knockdown, BSTA may not regulate phosphorylation of Akt by controlling its translocation.
We also investigated whether BSTA regulated the phosphorylation of Akt at all three of its key sites (Thr308, Ser473, and Thr450). BSTA knockdown inhibited phosphorylation of Ser473 but only partially blocked phosphorylation of Thr308 (in Panc-28 cells) and had little to no effect on phosphorylation of Thr450 (in Panc-28 and MDA-MB231 cells) (fig. S6B). Because the requirement for BSTA appeared to be greater for phosphorylation of Ser473, it is more likely that it is essential for mTORC2 function. Moreover, as studies of rictor have suggested, phosphorylation of Ser473 and Thr308 is coupled in transformed cells but not in untransformed cells (8, 16, 24), and this coupling may explain the partial inhibition of phosphorylation of Thr308 in cancer cell lines such as Panc-28 (fig. S6B). Indeed, the phosphorylation of Akt on Thr308 and Thr450 was unaffected when BSTAwas knocked down in untransformed 3T3 L1 cells (Fig. 4A). We next investigated BSTA function in murine embryonic stem (ES) cells and found that only the phosphorylation of Ser473 (but not that of Thr308 or Thr450) was inhibited in ES cells carrying a gene-trap insertion in bsta (ESbsta-GT) (Fig. 4B). Unlike ESbsta-GT cells, EGF potently induced phosphorylation of Ser473 in Akt in the parental wild-type ES cells. In addition, loss of BSTA in ESbsta-GT cells did not affect the phosphorylation of Ser256 in FoxO1, Thr389 in ribosomal protein S6 kinase (S6K), Thr421 in SGK1, and Ser657 in protein kinase Cα (PKCα) (Fig. 4B). Phosphorylation of p70S6K appeared to be increased in ESbsta-GT cells to a similar extent to that observed when SIN1, a component essential for mTORC2 activity, was specifically deleted to inactivate mTORC2 in mice (15).
Fig. 4.

Role of mTORC2 in BSTA-mediated phosphorylation of Akt. (A) siRNA-transfected 3T3 L1 cells were immunoblotted for phosphorylation of Akt at Ser473, Thr308, and Thr450. n = 3 experiments. (B) Serum-starved WT ES and bsta gene-trap mutant (ESbsta-GT) ES cells were stimulated with EGF and immunoblotted for phosphorylation of Akt at Ser473, Thr308, and Thr450, as well as phosphorylated FoxO1, p70S6K, SGK, and PKCα. n = 3 experiments. (C) Akt immunoprecipitates from serum-starved WT and rictor−/− MEFs that were stimulated with EGF were immunoblotted for BSTA and Akt. n = 3. (D) Whole-cell extracts from control or EGF-stimulated WT and rictor−/− MEFs were resolved on Phos-Tag acrylamide gels and immunoblotted for mobility-shifted BSTA or Akt. Control WT MEFs were transfected with scrambled or BSTA siRNA or treated with PP242 before EGF treatment to identify BSTA and mTOR-regulated phosphorylated bands. To confirm phosphorylation, whole-cell extracts from EGF-treated WT MEFs were incubated with CIP phosphatase. Data derived from two different exposure times are shown. n = 4 experiments. (E) Akt immunoprecipitates from control and EGF-stimulated WT ES and ESbsta-GT cells were immunoblotted for rictor, mTOR, and Akt. n = 3 experiments. (F) HA immunoprecipitates from siRNA-treated 3T3 L1 cells stably expressing HA-Akt1 and FLAG-Akt1 were immunoblotted for FLAG. Whole-cell extracts were immunoblotted for total Akt and Akt phosphorylated at Ser473. n = 3 experiments.
Surprisingly, in vitro kinase assays suggested that EGF-induced mTORC2 kinase activity was unaffected by BSTA knockdown (fig. S6C). Furthermore, BSTA may not function by counteracting the PH domain leucine-rich repeat protein phosphatases (PHLPPs) (25) because co-depletion of PHLPP1 and PHLPP2 did not alleviate the inhibitory effect of BSTA knockdown on phosphorylation of Ser473 in Akt (fig. S6D). However, EGF-induced BSTA-Akt complex formation was inhibited in rictor−/− mouse embryonic fibroblasts (MEFs), indicating that mTORC2 was essential for the BSTA-Akt interaction (Fig. 4C). In contrast, PDK1 was dispensable for the interaction (fig. S6E). We next investigated whether mTORC2 promoted the BSTA-Akt interaction by enhancing the phosphorylation of BSTA. Potentially differentially modified forms of BSTAwere detected in MEFs, and EGF stimulation induced the appearance of four major bands, which were specific because they were absent in BSTA siRNA–transfected cells (Fig. 4D). Of the four bands, the band with the least mobility was barely detectable in unstimulated cells, disappeared upon treatment with calf intestinal phosphatase (CIP), and was absent when cells were treated with the mTOR inhibitor PP242 before EGF stimulation. Furthermore, this BSTA band was missing in the rictor−/− MEFs, and after CIP or PP242 treatment, the banding pattern in the EGF-treated wild-type MEF extracts was identical to those observed for unstimulated wild-type MEFs and rictor−/− MEFs. These data suggest that mTORC2 promotes phosphorylation of BSTA in response to EGF stimulation and thereby induces the BSTA-Akt interaction. BSTA, in turn, may facilitate mTORC2-Akt interactions because mTORC2 was unable to efficiently interact with Akt in ESbsta-GT cells (Fig. 4E and fig. S6F).
Akt homodimerizes in yeast two-hybrid assays through a PH domain–dependent mechanism and invitro in the presence of phosphatidylinositol-3,4-bisphosphate (PI-3,4-P2), a PI3K lipid product (26, 27). Because Akt can be activated when dimerized (27) and interacting proteins such as Tcl1 can stimulate Akt by inducing it to form trimers (28), the mechanism by which growth factors promote phosphorylation of Ser473 in Akt may also involve multimerization. Consistent with this possibility, HA-Akt1 was detected in anti-FLAG immunoprecipitates from cells expressing both HA-Akt1 and FLAG-Akt1. These data indicate that multiple Akt1 molecules form a complex in an EGF- and BSTA-dependent manner (Fig. 4F and fig. S7A). Because BSTA may not itself form multimers as Tcl1 does (fig. S4D), it may facilitate multimerization of Akt1 by a different mechanism. Furthermore, size-exclusion chromatography revealed that EGF stimulation and BSTA induced the assembly of high–molecular weight complexes from a portion of total cellular Akt (fig. S7B). In further support of a mechanistic link between the two events, both dimerization and phosphorylation of Akt1 were also blocked when rictor was knocked down (fig. S7C).
BSTA is essential for adipocyte differentiation
We next investigated the consequences of silencing BSTA on specific functions of the PI3K-Akt pathway. Coincident with its effect on phosphorylation of Akt1, BSTA knockdown inhibited (>75%) insulin-induced glucose uptake in 3T3 L1 preadipocytes (fig. S8A). BSTA protein and mRNA amounts increased as 3T3 L1 cells differentiated into adipocytes in response to treatment with insulin, IBMX (3-isobutyl-1-methylxanthine), and dexamethasone and reached a peak by day 4 of the treatment (Fig. 5A). These data are consistent with previous findings indicating that phosphorylation of Akt increases during adipocyte differentiation (20) and that BSTA amounts are increased in human skeletal muscle by insulin treatment (29) and are higher basally in adipose and liver tissue in ob/ob obese mice (30). To determine whether BSTA had a function in adipogenesis, we knocked it down in 3T3 L1 preadipocytes before inducing differentiation. As judged by the abundance of lipid droplets as assessed by oil Red O staining, BSTA-knockdown cells failed to differentiate (Fig. 5B) and retained proliferative capacity (fig. S8B) in contrast to control cells. In addition, BSTA was required for phosphorylation of Ser473 in Akt and adipocyte differentiation in primary human preadipocytes (Fig. 5C). BSTA-specific RNA interference (RNAi) decreased the expression of genes encoding transcription factors essential for adipocyte differentiation (31, 32), including peroxisome proliferator–activated receptor γ (PPARγ), CCAAT/enhancer-binding protein α (c/EBPα), and adipocyte protein 2 (aP2) (fig. S8, C to E).
Fig. 5.

BSTA is essential for adipocyte differentiation. (A) 3T3 L1 preadipocytes treated as indicated were immunoblotted for BSTA and extracellular signal–regulated kinase (ERK). Total RNA from a second set of cells was used for qPCR analysis of bsta expression (graph), and averages and SDs obtained from three independent experiments are shown. (B) 3T3 L1 preadipocytes electroporated with scrambled (scr) or BSTA siRNA were differentiated with insulin/IBMX/dexamethasone (Dex) and stained with oil Red O. Scale bar, 100 μm. n = 5 experiments. (C) Primary human preadipocytes were electroporated with siRNA, induced to differentiate, and either immunoblotted to determine the phosphorylation status of Akt at Ser473 (right) or differentiated further and stained. Scale bar, 100 μm. n = 2 experiments. (D and E) 3T3 L1 cells expressing a control vector (pMX) or human bsta (pMX-BSTA) were electroporated with siRNA and either immunoblotted with the indicated antibodies (D) or differentiated further (E). Endogenous murine BSTA is less mobile than exogenous (human) protein. Densitometric data (n = 3 experiments) showing pAkt/Akt ratios (means ± SD; *P < 0.01) are presented below the representative blot (panel D). Oil Red O staining in (E) was quantified by measuring absorbance at 520 nm, and data from three independent experiments are presented (means ± SD). Scale bars, 100 μm. (F) 3T3 L1 cells overexpressing BSTA or BSTA-AA were induced to differentiate into adipocytes. Scale bars, 100 μm. n = 3 experiments. (G) Oil Red O staining for WT (F) and for rictor−/− MEFs (H) was quantified by measuring absorbance at 520 nm, and data from three independent experiments are presented (means ± SD). (H) Oil Red O staining for WT or rictor−/− MEFs induced to differentiate into adipocytes. Scale bars, 100 μm. n = 3 experiments.
To evaluate the specificity of the effects of RNAi, we generated 3T3 L1 cells overexpressing human BSTA cDNA and electroporated them with an siRNA that targeted a 3′-untranslated region (UTR) sequence in murine BSTA. Although endogenous BSTAwas knocked down in both cell lines, phosphorylation of Ser473 in Akt (Fig. 5D) and adipocyte differentiation (Fig. 5E) were fully inhibited only in the control cells, suggesting that the siRNA was target-specific and that human BSTA rescued the knockdown of murine BSTA.
Consistent with its inhibitory effect on phosphorylation of Ser473 in Akt (Fig. 3A and fig. S5A), the BSTA-AA mutant also blocked adipocyte differentiation (Fig. 5, F and G). In further support of a role for the phosphorylation of Ser473 in Akt in adipogenesis, we found that rictor−/− MEFs did not differentiate into adipocytes (Fig. 5, G and H).
The BSTA-Akt-FoxC2 axis regulates ES cell adipocyte differentiation
Unlike wild-type ES cells, ESbsta-GT cells were refractory to treatment with four different inducer combinations and failed to differentiate into adipocytes (Fig. 6, A and B). Wild-type ES cells overexpressing the BSTA-AA or the BSD construct also lost their ability to differentiate into adipocytes, and adipocyte differentiation of ESbsta-GT cells was rescued by expression of BSTA but not BSTA-AA, BSD, or BSD-AA (fig. S9, A to C).
Fig. 6.

ES cell adipocyte differentiation and FoxC2 abundance are regulated by BSTA. (A) ES cells were induced to differentiate into adipocytes with four different treatments. Scale bar, 100 μm. n = 4 experiments. (B) Oil Red O staining quantified by measuring absorbance is presented for two of the four treatments. (C and D) ES cells that were serum-starved (−) or continuously cultured in serum (+) were analyzed by Western blotting (C) or qPCR (D). Each qPCR data point was obtained from three independent experiments and used to calculate the averages and SDs. The mobility of the upper FoxC2 band was identical to that of transfected FoxC2. ns, nonspecific band. n = 3 experiments. (E) Serum-starved WT ES cells were treated with LY294002 and immunoblotted with the indicated antibodies. The statistical significance of densitometric data (n = 3 experiments) was determined for FoxC2/β-actin and pAkt/Akt ratios. The FoxC2/β-actin ratio (means ± SD; *P < 0.05) is presented below the representative blot. (F) Serum-starved WT, akt1−/−, and rictor−/− MEFs were immunoblotted with the indicated antibodies. The statistical significance of densitometric data (n = 3 experiments) was determined for FoxC2/β-actin and pAkt/Akt ratios. The FoxC2/β-actin ratios (means ± SD; *P < 0.05) are presented below the representative blots.
The forkhead transcription factor FoxC2 antagonizes white adipogenesis and induces brown adipogenesis (33–35). Although FoxC2 amounts may decrease during white adipocyte differentiation as could be expected of an inhibitor of adipogenesis (36), the underlying mechanisms have yet to be identified. We observed that FoxC2 protein amounts were severalfold higher in ESbsta-GT cells than in wild-type ES cells and appeared to be inversely proportional to BSTA amounts and phosphorylation of Ser473 in Akt (Fig. 6C). In contrast, the abundance of the related protein FoxC1 was unaltered. Quantitative polymerase chain reaction (qPCR) analysis confirmed that the expression of foxc2 was higher in ESbsta-GT than in wild-type ES cells and suggested that BSTA antagonizes a transcriptional or mRNA stability mechanism involved in its regulation (Fig. 6D). The abundance of FoxC2 was greater in LY294002-treated wild-type ES cells and in akt1−/− and rictor−/− MEFs than in untreated and wild-type control cells, suggesting suppression by PI3K-Akt signaling (Fig. 6, E and F). Moreover, expression of dominant-negative Akt1 (Akt1-AAA) increased FoxC2 amounts in wild-type ES cells and suppressed their ability to differentiate (Fig. 7, A and B). In addition to showing increased phosphorylation of Ser473 in Akt and reduced FoxC2 amounts, ESbsta-GT cells reconstituted with BSTA regained the capacity for adipocyte differentiation (Fig. 7, A and B). Consistent with FoxC2 amounts and function, the abundance of the brown adipose–specific marker uncoupling protein 1 (UCP-1) was lower in wild-type ES than in ESbsta-GT cells (fig. S9D). The knockdown of FoxC2 in ESbsta-GT cells decreased the abundance of UCP-1 and increased that of PPARγ (Fig. 7C). Reconstitution of BSTA in ESbsta-GT cells decreased the amounts of both FoxC2 and UCP-1 and increased PPARγ amounts (fig. S9D). Unlike BSTA, BSTA-AA and BSD were ineffective at restoring phosphorylation of Akt in ESbsta-GT cells (fig. S10, A and B). However, BSTA-AA and BSD were able to increase FoxC2 amounts in wild-type ES cells, consistent with their ability to inhibit phosphorylation of Akt and differentiation of wild-type ES cells into adipocytes (figs. S9, A to C, and S10, A and B).
Fig. 7.

The BSTA-Akt-FoxC2 axis promotes white adipocyte differentiation. (A) ES cells stably expressing Akt1-AAA or human BSTA were immunoblotted with the indicated antibodies. Densitometric data (n = 3 experiments) showing FoxC2/β-actin ratios (means ± SD; *P < 0.05) are presented below the representative blot. (B) ES cells stably expressing Akt1-AAA, BSTA, FoxC2-Eng, or FoxC2-VP16 were induced to differentiate into adipocytes with insulin and T3 treatment and stained with oil Red O. Oil Red O staining was quantified by measuring absorbance at 520 nm, and data from three independent experiments are presented (means ± SD). Scale bars, 100 μm. (C) ESbsta-GT cells stably transduced with scrambled or FoxC2 shRNA were immunoblotted with the indicated antibodies. The statistical significance of densitometric data (n = 3 experiments) was determined for FoxC2/β-actin and pAkt/Akt ratios. The FoxC2/β-actin ratio (means ± SD; *P < 0.05) is presented below the representative blot. (D and E) ESbsta-GT cells or rictor−/− MEFs stably expressing the Akt1 mutants (Akt1-ADE, Akt1-EDA, or Akt1-EDE) were immunoblotted with the indicated antibodies (D) or induced to differentiate into adipocytes (ES cells with insulin + T3; MEFs with insulin/IBMX/dexamethasone) and stained with oil Red O (E). Scale bars, 100 μm. Densitometric data (n = 3 experiments) showing FoxC2/β-actin ratios (means ± SD; *P < 0.05) are presented below each representative blot shown in (D). Oil Red O staining was quantified by measuring absorbance at 520 nm, and data from three independent experiments are presented (graph in E). (F) A model of the role of BSTA in Akt activation and adipogenesis.
To evaluate the importance of FoxC2 in ES cell differentiation, we stably expressed an antagonist ( foxc2-engrailed or foxc2-eng) or a constitutively active form ( foxc2-vp16) of FoxC2 in ESbsta-GT cells (35). ESbsta-GT cells expressing foxc2-eng differentiated into adipocytes and appeared to be rescued from loss of BSTA (Fig. 7B). In contrast, FoxC2-VP16 almost completely blocked the differentiation of wild-type ES cells into adipocytes but did not affect the differentiation of ESbsta-GT cells (Fig. 7B). Like FoxC2-Eng, FoxC2 knockdown also rescued ESbsta-GT cells (fig. S10, C and D). In addition, foxc2−/− MEFs differentiated into adipocytes (fig. S10, C and D), and UCP-1 amounts were lower and PPARγ amounts were higher in undifferentiated foxc2−/− MEFs than in the wild-type cells (fig. S10E).
Similarly to BSTA and FoxC2-Eng, expression of an Akt1 mutant (Akt1-EDE) that contained phosphomimetic residues (glutamate or aspartate) at all three sites (Thr308, Thr450, and Ser473), but not the Akt1-ADE or Akt1-EDA mutants, decreased FoxC2 abundance and restored adipogenic capacity to ESbsta-GT cells (Fig. 7, D and E). Akt1-EDE expression also decreased FoxC2 abundance and rescued rictor−/− MEFs (Fig. 7, D and E). These results suggested that phosphorylation of Thr308 and Ser473 was crucial to the ability of Akt1 to decrease FoxC2 abundance and rescue ESbsta-GT cells. We therefore propose that mTORC2 phosphorylates BSTA and induces it to interact with and modify Akt1 to render it competent for phosphorylation on Ser473 (Fig. 7F). When Akt1 is phosphorylated on both Thr308 and Ser473, it decreases FoxC2 abundance and promotes adipocyte differentiation.
DISCUSSION
We have shown that BSTA promotes the phosphorylation and adipogenic function of Akt and suggest that the BSTA-Akt1 interaction is likely influenced by the phosphorylation status, structural configuration, or subcellular localization, of one or both molecules. We have also identified a function for the BSD domain of BSTA and its FW motif as a facilitator of this protein-protein interaction.
We also demonstrated that BSTA has an essential function in growth factor–induced phosphorylation of Ser473 in Akt. Regulation of the phosphorylation status of this site involves the opposing actions of the kinase mTORC2 and the PHLPP family of phosphatases. Our data reveal that the ability of mTORC2 to phosphorylate Akt, but not other AGC family kinases such as SGK and PKCα, depends on a BSTA-mediated mechanistic step that did not appear to antagonize the action of the PHLPP family of phosphatases or maintain the integrity of the mTORC2 kinase complex. Instead, the mechanism might involve interplay between BSTA and mTORC2 whereby mTORC2 triggers the phosphorylation of BSTA to induce BSTA-Akt1 complex formation. BSTA is phosphorylated on multiple sites (37), at least one of which may be mTOR-regulated (38). We propose that phosphorylated BSTA binds to Akt1 and renders it accessible and competent for its subsequent interaction with mTORC2. BSTA may achieve this by inducing Akt1 to form multimers or by acting as a scaffolding protein. Although there is evidence that Akt is activated when multimerized (26–28), the molecular bases of this multimerization and its role in promoting mTORC2-Akt interaction are poorly understood. Moreover, the possibility that multimerization is not the trigger but a consequence of phosphorylation of Ser473 in Akt cannot be ruled out. Nevertheless, our study supports the possibility that BSTA mediates phosphorylation of Akt1 at Ser473 by facilitating the interaction between mTORC2 and Akt.
The relevance of mTORC2-mediated phosphorylation of Akt1 and other AGC kinases to adipogenesis is uncertain. Although adipose-specific rictor−/− mice have shown that mTORC2 is dispensable for the maintenance of normal adipose tissue morphology, rictor was knocked out only in mature adipocytes or during the terminal phase of adipocyte differentiation in these studies (39, 40). Furthermore, in Caenorhabditis elegans, mTORC2 has an essential role in fat metabolism, body size, and life span, which is primarily mediated by SGK and not Akt (41, 42). Herein, we have presented evidence that rictor−/− MEFs are incapable of differentiating into adipocytes and that mTORC2, like Akt1, is therefore also essential for mammalian adipocyte differentiation. Consistent with its role as an Akt1 regulator, our data indicate that BSTA also has a critical adipogenic function in both cells that are already committed to the adipocytic lineage (3T3 L1 and primary human preadipocytes) and those that are pluripotent (ES cells). This study further suggests that phosphorylation of Thr308 in Akt1 and its targets such as mTORC1 and S6K are not sufficient and that mTORC2-mediated phosphorylation of Ser473 in Akt1 is specifically required for optimal adipocyte differentiation. Several observations support this notion. First, we observed that ESbsta-GT cells (and rictor−/− MEFs) were defective for adipocyte differentiation despite normal phosphorylation of Akt on its PDK1-regulated site (Thr308) and S6K on its mTORC1-regulated (Thr389) site. Second, a BSTA-AA mutant that did not interact with Akt inhibited both phosphorylation of Ser473 in Akt1 and adipocyte differentiation. Third, genetic ablation of BSTA specifically blocked mTORC2-dependent phosphorylation of Ser473 in Akt but not that of SGK or PKCα, kinases whose functions are thought to overlap those of Akt (5). Finally, a phosphomimetic Akt1 mutant containing glutamate at both Thr308 and Ser473 restored the adipogenic capacity of the mutant ES cells.
Although the transcription factor FoxO has been proposed to be a mediator of Akt in adipogenesis (43), it may in fact primarily function downstream of SGK (44, 45). There is evidence that Akt may promote adipogenesis through mTORC1-S6K signaling as well (46, 47). However, SGK and S6K were phosphorylated in ESbsta-GT cells lacking functional BSTA but were unable to support their differentiation. That both mTORC1 and mTORC2 may be vital to adipogenesis is supported by the present study, which uncovered a signaling mechanism dependent on BSTA and phosphorylation of Ser473 in Akt1 and showed that it mediates white adipocyte differentiation in MEFs and ES cells by decreasing FoxC2 abundance. Although BSTA signaling promoted white adipocyte differentiation, it decreased the abundance of the brown fat–specific marker and FoxC2 target UCP-1, and thus appears to inhibit brown adipocyte differentiation.
Together, our findings suggest that the physiological role of phosphorylation of Ser473 in Akt1 is linked to the regulation of adipogenesis and reveal several aspects of the underlying mechanism.
MATERIALS AND METHODS
Cell lines, antibodies, DNA constructs, siRNAs, and reagents
Wild-type and akt1−/− MEFs (M. J. Birnbaum, University of Pennsylvania), immortalized MEFs used for immunoprecipitation and knockdown experiments (J. Woodgett, Samuel Lunenfeld Research Institute), wild-type and rictor−/− MEFs (M. Magnuson, Vanderbilt University), and wild-type and foxc2−/− MEFs (T. Kume, Northwestern University School of Medicine) were gifts. AsPC-1, MDA-MB231, NIH 3T3, 3T3 L1, human embryonic kidney (HEK) 293, BxPC-3, and Cos-7 cells were obtained from the American Type Culture Collection. Adult human primary cardiac preadipocytes were obtained from Cell Applications Inc. Parental and gene-trap AF0128 murine ES cells containing an insertion between exons 4 and 5 upstream of BSD domain were obtained from the National Institutes of Health (NIH)–sponsored National Center for Research Resources–Mutant Mouse Regional Resource Center at the University of California, Davis and National Heart, Lung, and Blood Institute–Baygenomics. Panc-28 cells were obtained from P. Chiao (The University of Texas M. D. Anderson Cancer Center) and maintained in Dulbecco’s modified Eagle’s medium (DMEM) supplemented with 10% fetal bovine serum (FBS) under standard culture conditions. Antibodies were purchased from Sigma-Aldrich (FLAG, FoxC2, UCP-1, and β-actin), Abcam (FoxC1), Santa Cruz Biotechnology (Akt1/2, HA, IGF-1 receptor, c-Myc, p-Ser657-PKCα, PKCα, FoxO1, and CREB1), Cell Signaling Technology (Akt 2966 for immunoprecipitation, Akt 9272 for Western blotting, p-Ser473-Akt, p-Thr450-Akt, p-Thr308-Akt, p-Ser256-FoxO1, p-Thr389-S6K, S6K, p-Ser133-CREB, PKA-RIα, mTOR, PPARγ, rictor, and PDK1), BD Biosciences (pan-ERK), Millipore (mSin1 and SGK1), and Bethyl Laboratories Inc. (PHLPP2 and hexokinase-2). The anti–p-Thr389-S6K antibody from Cell Signaling Technology recognizes both p-Thr389-S6K (70 kD) and p-SGK1-Thr421 (48 kD) as described previously (48). The expression vectors used in this study included pcDNA3.1, pCMV-FLAG2, and the retroviral vector pMX-Puro (49) for mammalian, and pGEX-5X for bacterial, expression. Full-length human bsta cDNA(GenBank accession no.BC014657)waspurchased from The IMAGE Consortium/Open Biosystems. Site-directed mutagenesis was performed with either the ExSite or the QuikChange kit (Stratagene). Various plasmids were gifts from A. Aronheim, Rappaport Institute, Israel (RRS constructs); D. Koul, M. D. Anderson Cancer Center (pcDNA-HA-Akt1, pcDNA-HA-Akt1-AAA, and pcDNA-HA-Akt1-DD); B. Burgering, University Medical Center, Utrecht (pSG5-HA-Akt1); and O. A. MacDougald, University of Michigan (pBabe-FoxC2-Eng and pBabe-FoxC2-VP16). All constructs were verified by sequencing and restriction analysis.
Control (scrambled) and BSTA target sequences were identified and siRNAs were designed with various Web-based tools, such as the Ambion siRNATarget Finder (http://www.ambion.com/techlib/misc/siRNA_finder.html). siRNAs were synthesized with an siRNA construction kit (Ambion) or ordered from commercial sources (Sigma-Aldrich or Dharmacon). An additional sequence was included in the primers that were used with the construction kit. Other control nontargeting siRNAs (Ambion) and scrambled and FoxC2 short hairpin RNA (shRNA) (Open Biosystems) were purchased. PHLPP1/2-, PDK1-, Akt1 (UTR)–, and Akt2 (UTR)–specific siRNAs and rictor shRNAwere described previously (8, 25, 50–52). Other reagents were purchased from Sigma-Aldrich [oilRedO, insulin, IBMX, dexamethasone, T3, and leukemia inhibitory factor (LIF)], Cayman Chemical (rosiglitazone), PeproTech (EGF), Cell Applications Inc. (HPAd differentiation medium and preadipocyte growth medium), Chemdea (PP242), and Calbiochem (LY294002, rapamycin).
Cell lysis, immunoblotting, and immunoprecipitation
Cell lines were serum-starved (16 to 24 hours) before any stimulation with growth factors or hormones (insulin, 100 nM) and then solubilized in buffer A [50 mM Hepes (pH 7.5), 150 mM NaCl, 1 mM MgCl2, 1 mM EGTA, 10% glycerol, 1 mM dithiothreitol (DTT), 1% NP-40] supplemented with phosphatase and protease inhibitors [2 mM sodium orthovanadate, 10 mM glycerophosphate, 50 mM sodium fluoride, aprotinin (10 μg/ml), leupeptin (10 μg/ml), benzamidine (0.5 mg/ml), 0.25 mM phenylmethylsulfonyl fluoride]. Whole-cell extracts were clarified by centrifugation (14,000g) for 20 min, resolved by SDS–polyacrylamide gel electrophoresis (SDS-PAGE), transferred onto nitrocellulose membranes, and probed by Western blotting with the appropriate antibodies. For coimmunoprecipitation assays, cells were serum-starved (16 hours) and stimulated with EGF (20 to 50 ng/ml) or 0.1 mM pervanadate before lysis. Whole-cell extracts (1.0 to 1.2 mg) were incubated with anti-Akt, anti-FLAG (BSTA or Akt), anti-HA (Akt), anti-Myc (BSTA), or anti-rictor antibodies for 3 to 6 hours. Immunocomplexes were collected after incubation (1 hour) with protein-A/G agarose and centrifugation (2500g) for 2 min. After several washes with buffer A, bound proteins were eluted with buffer B [20 mM Hepes (pH 7.9), 600 mM NaCl, 1 mM EGTA, 1 mM EDTA, 1 mM DTT, 2 mM sodium orthovanadate, 50 mM sodium fluoride, aprotinin (2 μg/ml), leupeptin (2 μg/ml), benzamidine (0.5 mg/ml), 0.4 mM phenylmethylsulfonyl fluoride] or preferably buffer C [50 mM Hepes (pH 7.4), 150 mM NaCl, 1.5 mM MgCl2, 1 mM EDTA, 1% Triton X-100, 1% SDS, 1 mM sodium orthovanadate, 10 mM sodium pyrophosphate, 100 mM sodium fluoride, aprotinin (10 μg/ml), leupeptin (10 μg/ml), 250 μM phenylmethylsulfonyl fluoride] and resolved by SDS-PAGE for Western blot analysis. For detection of Akt-mTORC2 interactions, cells were lysed (30 min) in buffer A containing only 0.5% NP-40 (instead of 1%), and whole-cell extracts were immediately diluted (1:3) with buffer A (minus NP-40) containing 0.3% CHAPS for immunoprecipitation. After immunoprecipitation, bound proteins were eluted with buffer C. For Akt dimerization experiments, pCMV-FLAG-Akt1 and siRNA (5 nmol per 6 × 10⁶ cells) were electroporated together (950 μF, 220 V, 4-mm cuvette) into AsPC-1, NIH 3T3, and Panc-28 cells that stably expressed HA-Akt1. Twenty-four hours after electroporation, the cells were serum-starved, EGF-stimulated (10 to 20 min), and prepared for immunoprecipitation and Western blotting as described above.
Densitometry and statistical analyses of Western blots
Western blots were scanned, and densitometric analyses of protein bands were performed with NIH ImageJ software version 1.46. The pixel density of each phosphorylated Akt or FoxC2 band was quantified and normalized to that of total Akt or β-actin. Statistical significance was calculated by a nonparametric method (Kruskal-Wallis). All computations were carried out with the SAS version 9.3 software.
Phos-tag acrylamide SDS-PAGE
Whole-cell extracts were prepared from EGF-stimulated (50 ng/ml, 20 min), serum-starved (16 hours) wild-type and rictor−/− MEFs. For detection of mobility-shifted phosphorylated proteins, whole-cell extracts were resolved by electrophoresis on Mn2+-Phos-tag SDS-PAGE gels (25 μM Phos-tag, 50 μM MnCl2) with a constant current (15 mA/gel) as described previously (53). After electrophoresis, the gels were soaked in transfer buffer (+EDTA) for 30 min and washed twice (30 min each) with transfer buffer (−EDTA). Proteins were then transferred onto nitrocellulose membranes and probed by Western blot.
Lipophilic transfection and electroporation of cells
Lipophilic reagents were used to transiently transfect cDNA (Lipofectamine) or siRNA (75 to 100 nM; Lipofectamine 2000) into HEK 293, AsPC-1, Panc-28, Panc-1, MDA-MB231, MCF-7, NIH 3T3, PC12, 3T3 L1 pre-adipocytes, and MEFs as described previously (54). Media were refreshed about 16 to 24 hours after siRNA transfection, and after another 24 hours (including serum starvation overnight), cells were stimulated with growth factors and harvested to prepare whole-cell extracts for Western blotting, mTORC2 kinase assays, size-exclusion chromatography, or differential centrifugation. siRNA was introduced into 3T3 L1 adipocytes (fifth day after differentiation was initiated for glucose uptake assays) and adult human primary cardiac preadipocytes by electroporation (55). Briefly, cells were trypsinized, washed three times, and resuspended in Opti-MEM reduced-serum medium (Invitrogen). Cells (4 × 10⁶) were then mixed with siRNA duplexes (10 nmol) and pulsed in a 4-mm cuvette with a Bio-Rad gene pulser II system (0.18 kV, 950 μF). Electroporated cells were immediately mixed with fresh medium before being reseeded at high densities for various assays.
GST-BSD pull-down assays
Expression of GSTand GST fusion proteins was induced in BL-21 bacteria (30°C, 1 mM isopropyl β-D-1-thiogalactopyranoside), and the proteins were collected with GSH (reduced glutathione)–agarose beads and visualized after SDS-PAGE (Coomassie bright blue). For GST-BSD pull-down assays, cells were serum-starved (16 hours) and treated with EGF (20 ng/ml) before lysis in buffer D [50 mM Hepes (pH 7.5), 150 mM NaCl, 1 mM MgCl2, 1 mM EGTA, 1 mM DTT, 0.5% NP-40, 2 mM sodium orthovanadate, 10 mM sodium fluoride, aprotinin (10 μg/ml), leupeptin (10 μg/ml), benzamidine (0.5 mg/ml), 250 μM phenylmethylsulfonyl fluoride]. Whole-cell extracts were cleared by centrifugation (20 min) at 14,000g and incubated with immobilized GST proteins (1.0 to 1.2 mg) for 4 hours at 4°C with continuous mixing. Protein complexes were collected by centrifugation and washed three times with buffer D and once with buffer A. SDS sample buffer (2×, 25 μl) was added directly to each tube containing the beads, and the samples, after being boiled, were subjected to SDS-PAGE and Western blotting.
3T3 L1, HPAd, and rictor−/− and foxc2−/−MEF differentiation
3T3 L1 cells were maintained at 37°C (5% CO2) in DMEM supplemented with 10% FBS and differentiated (55) with an induction medium (growth medium with 0.5 mM IBMX, 1 μM dexamethasone, and 0.2 μM insulin) about 24 hours after electroporation and seeding. This medium was changed everyday for 3 days. Cells were then cultured in a medium containing only 0.2 μM insulin for an additional 2 days. Finally, this medium was replaced with the original growth medium for 2 to 3 days before the cells were lysed for Western blot analysis or immediately stained with oil Red O. Before staining, differentiated cells were first washed three times with phosphate-buffered saline (PBS), fixed in 4% paraformaldehyde for 1 hour, and rinsed three times in water. Cells were then stained with oil Red O in 36% triethyl phosphate (30 min) and washed. Mature adult human primary cardiac preadipocytes were maintained in preadipocyte growth medium before being induced to differentiate (in HPAd differentiation medium). Two days after they reached confluence, rictor−/− MEFs (DMEM, 10% FBS) were induced either with HPAd medium (refreshed daily) or with insulin/IBMX/dexamethasone and wild-type and foxc2−/− MEFs were induced by insulin/IBMX/dexamethasone for 7 days. After oil Red O staining, adipocytes were visualized under an Olympus IX81 motorized inverted microscope with the DP70 controller software program, a Hamamatsu digital camera (C4742-95), and an Olympus UPLFLN10X lens. To quantitate lipid content, cells were washed extensively with water, and bound oil Red O dye was then eluted with 100% isopropanol and absorbance was measured at 520 nm by a spectrophotometer (56).
Quantitative polymerase chain reaction
Total RNAwas isolated from variously treated 3T3 L1 and ES cells and reverse-transcribed. qPCRs were performed in triplicate with the iQ SYBR Green Supermix with primers for murine bsta (forward, TGTCAAGAAGCCTGTTTACCGTA; reverse, AGTGCTGTGAAAACTTG) or foxc2 (forward, ACCGGCTTCGCCTCCTCCAT; reverse, ACCTGCGAGTTGCACGGAGC) and gapdh (forward, AACTTTGGCATTGTGGAAGG; reverse, ACACATTGGGGGTAGGAACA). The following thermal conditions were used for bsta: denaturation at 95°C for 15 min followed by 30 cycles at 95°C for 30 s, 55°C annealing for 30 s, and an extension step at 72°C for 30 s. For foxc2, after initial activation (95°C for 15 min), reactions were subjected to 40 cycles of 95°C for 15 s and 60°C for 60 s. Primers for pparγ, c/ebpα, and ap2 were purchased from SABiosciences. The iCycler data analysis software program was used to calculate Ct values, and relative gene expression was determined as described previously (54).
Western blot analysis and differentiation of ES cells
Gene-trap ES cells were cultured in gelatin-coated cell culture dishes with knockout DMEM (Invitrogen) containing 15% ES-qualified fetal calf serum (Invitrogen), penicillin-streptomycin (1000 U/ml), 2 mM glutamine, and 1 mM β-mercaptoethanol in the presence of LIF (1000 U/ml) and G418 (200 μg/ml). The medium was refreshed everyday without exception. For Western blot analysis, the following conditions were used: serum starvation (+LIF) and EGF stimulation (+LIF) (Fig. 4B), serum starvation (+LIF) and continuous culture in serum (+LIF) (Fig. 6, C and E), and continuous culture in serum (+LIF) (Fig. 7A). Cells were then lysed for 60 min in buffer A modified to contain 1% SDS and 1% Triton X-100 as well as higher concentrations of protease inhibitors. To differentiate the cells into adipocytes using the hanging drop method (57), we cultured ES cells for 2 days as embryoid bodies (EBs) on the undersides of plate covers. The plates were then flipped, and the EBs were flooded with medium containing 100 nM all-trans retinoic acid (RA) for 3 days and subsequently with medium lacking RA for 2 to 3 days. EBs were transferred to dishes and treated with an HPAd differentiation medium or insulin (1 μg/ml) in combination with 2 nM triiodothyronine (T3) and induced to differentiate for 15 to 20 days. Alternatively, they were treated with insulin (5 mg/ml) alone for 17 days before treatment with insulin, dexamethasone (400 ng/ml), and IBMX (500 nM) for 2 more days and switching back to medium containing insulin alone for 10 days. Using a protocol that did not involve the hanging drop method described above, we directly seeded ES cells in 12-well plates (24 hours) and changed them to medium containing 10 nM RA for 9 days (58). The cells were switched again but to a medium containing 1 μM rosiglitazone and cultured for 10 additional days. Differentiation of the cells was constantly monitored under a microscope, and the cells were stained with oil Red O as described for 3T3 L1 adipocytes.
Yeast two-hybrid screen
A bait vector [pADNS(Ras)-akt1 δC20] was constructed and used to screen a human liver cDNA library in pMyr (CytoTrap XR, Stratagene) with cdc25-2 yeast cells (21). Library plasmids were extracted from yeast transformants that preferentially grew at the restrictive temperature of 37°C in medium containing galactose, sequenced, and retransformed into cdc25-2 cells along with the bait vector to confirm the specificity of the interaction with Akt1.
Anti-BSTA antibodies
Polyclonal antibodies against BSTA were custom-made at Bethyl Laboratories Inc., with two synthetic peptides (105CQKEQKKFVEEQH-TKKSEA122 and 287CQEDLRKEMEQLVLDKKQEET306) derived from human BSTA as immunogens. Except for one amino acid, these sequences are identical in the murine BSTA protein. The purified peptides were also used as immunosorbents to affinity-purify BSTA antibodies. Anti-BSTA antibodies (α-BSTA-1 and α-BSTA-2) were deemed to be specific on the basis of various tests (peptide blocking, recognition of exogenous BSTA, siRNA-mediated BSTA knockdown). The data presented here were obtained with α-BSTA-1.
Retroviral transduction and generation of stable cell lines
Cells were infected with retroviruses expressing BSTA, BSTA-AA (NIH 3T3, Panc-28, AsPC-1, and 3T3 L1, ES), HA-Akt1, HA-Akt1-AAA, HA-Akt1-DD (NIH 3T3, AsPC-1, and Panc-28), FLAG-BSD and FLAG-BSD-AA (Panc-28, 3T3 L1, ES, and BxPC-3), Akt1-AAA, FoxC2-Engrailed, FoxC2-VP16 (ES), Akt1-ADE, Akt1-EDA, and Akt1-EDE (ES and rictor−/− MEFs) or containing scrambled or FoxC2 shRNA (ESbsta-GT) or rictor shRNA (Panc-28), in the presence of polybrene (10 μg/ml). Twenty-four hours later, all infected cells were trypsinized and grown in selection medium containing puromycin (2 μg/ml) and expanded.
Mouse tissue homogenization
White adipose, brown adipose, and kidney tissues from C57BL/6 mice were homogenized with a mechanical tissue homogenizer (Tissue-Tearor, BioSpec Products Inc.) in radioimmunoprecipitation assay buffer containing protease and protein phosphatase inhibitors [10 mM sodium phosphate (pH 7.2), 150 mM NaCl, 1% NP-40, 0.1% SDS, 0.5% sodium deoxycholate, 2 mM EDTA, 1 mM DTT,1 mM sodium orthovanadate, 10 mM sodium pyrophosphate, 100 mM sodium fluoride, aprotinin (10 μg/ml), leupeptin (10 μg/ml), 250 μM phenylmethylsulfonyl fluoride]. Homogenates were clarified by centrifugation at 14,000g for 20 min before Western blotting.
Size-exclusion chromatography
Whole-cell extracts were prepared by lysis in buffer D. After centrifugation at 14,000g for 20 min, 10 mg of protein was applied on a Superdex 200 FPLC (fast protein liquid chromatography) column previously equilibrated with buffer E [50 mM potassium phosphate buffer (pH 7.4) containing 0.15 M NaCl and 1 mM EDTA] at a flow rate of 0.4 ml/min and calibrated with blue dextran 2000 (for void volume), β-amylase (200 kD), alcohol dehydrogenase (150 kD), bovine serum albumin (66 kD), and carbonic anhydrase (29 kD). Fractions of 0.5 ml each were collected and analyzed by Western blotting.
mTORC2 kinase assay
mTORC2 kinase activity was assayed as described previously (8). Briefly, siRNA-transfected and EGF-stimulated Panc-28 and MDA-MB231 cells were lysed in CHAPS lysis buffer to prepare whole-cell extracts, which were then incubated with a reaction mixture containing GST-Akt1 at 37°C for 20 min. After the reaction was terminated and the mixture was centrifuged, the supernatant and the beads were analyzed by Western blotting for phosphorylated Akt1 and mTORC2 proteins, respectively.
Supplementary Material
Fig. S1. Identification of an Akt1-interacting protein.
Fig. S2. BSTA (Mr 55,000) interacts with Akt and is phosphorylated in cells.
Fig. S3. Akt activity is dispensable for the BSTA-Akt interaction.
Fig. S4. Identification of a putative BSTA-binding sequence in Akt1.
Fig. S5. Effect of BSTA mutants and siRNA on the phosphorylation status of Akt.
Fig. S6. Mechanism of BSTA-mediated phosphorylation of Akt.
Fig. S7. Akt multimerization requires BSTA and mTORC2.
Fig. S8. BSTA promotes glucose uptake and adipocyte differentiation.
Fig. S9. Effects of BSTA, BSTA-AA, BSD, and BSD-AA on adipocyte differentiation.
Fig. S10. BSTA, Ser473 in Akt, and FoxC2 regulate adipocyte differentiation.
Acknowledgments
We thank S. Xin for her assistance with the yeast two-hybrid screen, S. Rivera for assistance in culturing ES cells, P. F. Firozi for initial help in setting up the RRS system, M. Canizales for technical assistance during revision, D. R. Norwood for editorial assistance, D. G. Menter for critical reading of the manuscript, and W. Qiao and H. Tang for assistance with statistical analysis. S.A.G.R. is indebted to Sri A and M. Mirra for their guidance and inspiration.
Funding: These studies were supported by the American Diabetes Association and the Topfer Foundation for Pancreatic Cancer Research (to S.A.G.R.). This research was supported in part by the NIH through the M. D. Anderson Cancer Center Support Grant CA016672 and a grant to B.H.-J.C. (5RO1DK84495).
Footnotes
Author contributions: Y.Y. performed most of the experiments; M.S. conceived and assisted with the ES cell experiments; B.G.D. generated specific constructs and assisted with the RRS screen; B.G.H. performed FoxC2 qPCR; T.E.S. performed FPLC; T.A. characterized the BSTA antibodies and performed the radiolabeling experiments; C.-H.C. performed the mTORC2 assays; B.H.-J.C. provided the 3T3 L1 cells and helped with their differentiation; Y.L. and G.B.M. helped interpret specific Akt phosphorylation data; D.S. supervised the mTORC2 and FPLC assays; S.A.M. conceived FoxC2 as BSTA target and provided reagents; J.L.A. conceived the BSD domain experiments and helped analyze various data; and S.A.G.R. designed and supervised the study, analyzed all the data, and wrote the manuscript. All authors critically read the manuscript.
Competing interests: The authors declare that they have no competing interests.
Data and materials availability: The ES cells require a materials transfer agreement from the Mutant Mouse Regional Resource Centers, The Jackson Laboratory, Bar Harbor, ME 04609.
REFERENCES AND NOTES
- 1.Manning BD, Cantley LC. Akt/PKB signaling: Navigating downstream. Cell. 2007;129:1261–1274. doi: 10.1016/j.cell.2007.06.009. [DOI] [PMC free article] [PubMed] [Google Scholar]
- 2.Franke TF. PI3K/Akt: Getting it right matters. Oncogene. 2008;27:6473–6488. doi: 10.1038/onc.2008.313. [DOI] [PubMed] [Google Scholar]
- 3.Brazil DP, Yang ZZ, Hemmings BA. Advances in protein kinase B signaling: Aktion on multiple fronts. Trends Biochem Sci. 2004;29:233–242. doi: 10.1016/j.tibs.2004.03.006. [DOI] [PubMed] [Google Scholar]
- 4.Cameron AJ, De Rycker M, Calleja V, Alcor D, Kjaer S, Kostelecky B, Saurin A, Faisal A, Laguerre M, Hemmings BA, McDonald N, Larijani B, Parker PJ. Protein kinases, from B to C. Biochem Soc Trans. 2007;35:1013–1017. doi: 10.1042/BST0351013. [DOI] [PubMed] [Google Scholar]
- 5.Alessi DR, Pearce LR, Garcia-Martinez JM. New insights into mTOR signaling: mTORC2 and beyond. Sci Signal. 2009;2:pe27. doi: 10.1126/scisignal.267pe27. [DOI] [PubMed] [Google Scholar]
- 6.Bozulic L, Hemmings BA. PIKKing on PKB: Regulation of PKB activity by phosphorylation. Curr Opin Cell Biol. 2009;21:256–261. doi: 10.1016/j.ceb.2009.02.002. [DOI] [PubMed] [Google Scholar]
- 7.Pearce LR, Komander D, Alessi DR. The nuts and bolts of AGC protein kinases. Nat Rev Mol Cell Biol. 2010;11:9–22. doi: 10.1038/nrm2822. [DOI] [PubMed] [Google Scholar]
- 8.Sarbassov DD, Guertin DA, Ali SM, Sabatini DM. Phosphorylation and regulation of Akt/PKB by the rictor-mTOR complex. Science. 2005;307:1098–1101. doi: 10.1126/science.1106148. [DOI] [PubMed] [Google Scholar]
- 9.Ikenoue T, Inoki K, Yang Q, Zhou X, Guan KL. Essential function of TORC2 in PKC and Akt turn motif phosphorylation, maturation and signalling. EMBO J. 2008;27:1919–1931. doi: 10.1038/emboj.2008.119. [DOI] [PMC free article] [PubMed] [Google Scholar]
- 10.Facchinetti V, Ouyang W, Wei H, Soto N, Lazorchak A, Gould C, Lowry C, Newton AC, Mao Y, Miao RQ, Sessa WC, Qin J, Zhang P, Su B, Jacinto E. The mammalian target of rapamycin complex 2 controls folding and stability of Akt and protein kinase C. EMBO J. 2008;27:1932–1943. doi: 10.1038/emboj.2008.120. [DOI] [PMC free article] [PubMed] [Google Scholar]
- 11.Alessi DR, Andjelkovic M, Caudwell B, Cron P, Morrice N, Cohen P, Hemmings BA. Mechanism of activation of protein kinase B by insulin and IGF-1. EMBO J. 1996;15:6541–6551. [PMC free article] [PubMed] [Google Scholar]
- 12.Hietakangas V, Cohen SM. Re-evaluating Akt regulation: Role of TOR complex 2 in tissue growth. Genes Dev. 2007;21:632–637. doi: 10.1101/gad.416307. [DOI] [PMC free article] [PubMed] [Google Scholar]
- 13.Guertin DA, Stevens DM, Thoreen CC, Burds AA, Kalaany NY, Moffat J, Brown M, Fitzgerald KJ, Sabatini DM. Ablation in mice of the mTORC components raptor, rictor, or mlst8 reveals that mTORC2 is required for signaling to Akt-FOXO and PKCα, but not S6K1. Dev Cell. 2006;11:859–871. doi: 10.1016/j.devcel.2006.10.007. [DOI] [PubMed] [Google Scholar]
- 14.Shiota C, Woo JT, Lindner J, Shelton KD, Magnuson MA. Multiallelic disruption of the rictor gene in mice reveals that mTOR complex 2 is essential for fetal growth and viability. Dev Cell. 2006;11:583–589. doi: 10.1016/j.devcel.2006.08.013. [DOI] [PubMed] [Google Scholar]
- 15.Jacinto E, Facchinetti V, Liu D, Soto N, Wei S, Jung SY, Huang Q, Qin J, Su B. Sin1/mip1 maintains rictor-mTOR complex integrity and regulates Akt phosphorylation and substrate specificity. Cell. 2006;127:125–137. doi: 10.1016/j.cell.2006.08.033. [DOI] [PubMed] [Google Scholar]
- 16.Yang Q, Inoki K, Ikenoue T, Guan KL. Identification of Sin1 as an essential TORC2 component required for complex formation and kinase activity. Genes Dev. 2006;20:2820–2832. doi: 10.1101/gad.1461206. [DOI] [PMC free article] [PubMed] [Google Scholar]
- 17.Du K, Tsichlis PN. Regulation of the Akt kinase by interacting proteins. Oncogene. 2005;24:7401–7409. doi: 10.1038/sj.onc.1209099. [DOI] [PubMed] [Google Scholar]
- 18.Franke TF. Intracellular signaling by Akt: Bound to be specific. Sci Signal. 2008;1:pe29. doi: 10.1126/scisignal.124pe29. [DOI] [PubMed] [Google Scholar]
- 19.Peng XD, Xu PZ, Chen ML, Hahn-Windgassen A, Skeen J, Jacobs J, Sundararajan D, Chen WS, Crawford SE, Coleman KG, Hay N. Dwarfism, impaired skin development, skeletal muscle atrophy, delayed bone development, and impeded adipogenesis in mice lacking Akt1 and Akt2. Genes Dev. 2003;17:1352–1365. doi: 10.1101/gad.1089403. [DOI] [PMC free article] [PubMed] [Google Scholar]
- 20.Baudry A, Yang ZZ, Hemmings BA. PKBα is required for adipose differentiation of mouse embryonic fibroblasts. J Cell Sci. 2006;119:889–897. doi: 10.1242/jcs.02792. [DOI] [PubMed] [Google Scholar]
- 21.Broder YC, Katz S, Aronheim A. The Ras recruitment system, a novel approach to the study of protein–protein interactions. Curr Biol. 1998;8:1121–1124. doi: 10.1016/s0960-9822(98)70467-1. [DOI] [PubMed] [Google Scholar]
- 22.Doerks T, Huber S, Buchner E, Bork P. BSD: A novel domain in transcription factors and synapse-associated proteins. Trends Biochem Sci. 2002;27:168–170. doi: 10.1016/s0968-0004(01)02042-4. [DOI] [PubMed] [Google Scholar]
- 23.Yang J, Cron P, Thompson V, Good VM, Hess D, Hemmings BA, Barford D. Molecular mechanism for the regulation of protein kinase B/Akt by hydrophobic motif phosphorylation. Mol Cell. 2002;9:1227–1240. doi: 10.1016/s1097-2765(02)00550-6. [DOI] [PubMed] [Google Scholar]
- 24.Guertin DA, Stevens DM, Saitoh M, Kinkel S, Crosby K, Sheen JH, Mullholland DJ, Magnuson MA, Wu H, Sabatini DM. mTOR complex 2 is required for the development of prostate cancer induced by Pten loss in mice. Cancer Cell. 2009;15:148–159. doi: 10.1016/j.ccr.2008.12.017. [DOI] [PMC free article] [PubMed] [Google Scholar]
- 25.Brognard J, Sierecki E, Gao T, Newton AC. PHLPP and a second isoform, PHLPP2, differentially attenuate the amplitude of Akt signaling by regulating distinct Akt isoforms. Mol Cell. 2007;25:917–931. doi: 10.1016/j.molcel.2007.02.017. [DOI] [PubMed] [Google Scholar]
- 26.Franke TF, Kaplan DR, Cantley LC, Toker A. Direct regulation of the Akt proto-oncogene product by phosphatidylinositol-3,4-bisphosphate. Science. 1997;275:665–668. doi: 10.1126/science.275.5300.665. [DOI] [PubMed] [Google Scholar]
- 27.Datta K, Franke TF, Chan TO, Makris A, Yang SI, Kaplan DR, Morrison DK, Golemis EA, Tsichlis PN. AH/PH domain-mediated interaction between Akt molecules and its potential role in Akt regulation. Mol Cell Biol. 1995;15:2304–2310. doi: 10.1128/mcb.15.4.2304. [DOI] [PMC free article] [PubMed] [Google Scholar]
- 28.Laine J, Kunstle G, Obata T, Sha M, Noguchi M. The protooncogene TCL1 is an Akt kinase coactivator. Mol Cell. 2000;6:395–407. doi: 10.1016/s1097-2765(00)00039-3. [DOI] [PubMed] [Google Scholar]
- 29.Keller MP, Choi Y, Wang P, Davis DB, Rabaglia ME, Oler AT, Stapleton DS, Argmann C, Schueler KL, Edwards S, Steinberg HA, Chaibub Neto E, Kleinhanz R, Turner S, Hellerstein MK, Schadt EE, Yandell BS, Kendziorski C, Attie AD. A gene expression network model of type 2 diabetes links cell cycle regulation in islets with diabetes susceptibility. Genome Res. 2008;18:706–716. doi: 10.1101/gr.074914.107. [DOI] [PMC free article] [PubMed] [Google Scholar]
- 30.Hayashi Y, Iida S, Sato Y, Nakaya A, Sawada A, Kaji N, Kamiya H, Baba Y, Harashima H. DNA microarray analysis of type 2 diabetes-related genes co-regulated between white blood cells and livers of diabetic Otsuka Long-Evans Tokushima fatty (OLETF) rats. Biol Pharm Bull. 2007;30:763–771. doi: 10.1248/bpb.30.763. [DOI] [PubMed] [Google Scholar]
- 31.Seale P, Kajimura S, Spiegelman BM. Transcriptional control of brown adipocyte development and physiological function—Of mice and men. Genes Dev. 2009;23:788–797. doi: 10.1101/gad.1779209. [DOI] [PMC free article] [PubMed] [Google Scholar]
- 32.Rosen ED, MacDougald OA. Adipocyte differentiation from the inside out. Nat Rev Mol Cell Biol. 2006;7:885–896. doi: 10.1038/nrm2066. [DOI] [PubMed] [Google Scholar]
- 33.Cederberg A, Grønning LM, Ahrén B, Taskén K, Carlsson P, Enerbäck S. FOXC2 is a winged helix gene that counteracts obesity, hypertriglyceridemia, and diet-induced insulin resistance. Cell. 2001;106:563–573. doi: 10.1016/s0092-8674(01)00474-3. [DOI] [PubMed] [Google Scholar]
- 34.Davis KE, Moldes M, Farmer SR. The forkhead transcription factor FoxC2 inhibits white adipocyte differentiation. J Biol Chem. 2004;279:42453–42461. doi: 10.1074/jbc.M402197200. [DOI] [PubMed] [Google Scholar]
- 35.Gerin I, Bommer GT, Lidell ME, Cederberg A, Enerback S, MacDougald OA. On the role of FOX transcription factors in adipocyte differentiation and insulin-stimulated glucose uptake. J Biol Chem. 2009;284:10755–10763. doi: 10.1074/jbc.M809115200. [DOI] [PMC free article] [PubMed] [Google Scholar]
- 36.Grønning LM, Cederberg A, Miura N, Enerbäck S, Taskén K. Insulin and TNFα induce expression of the forkhead transcription factor gene Foxc2 in 3T3-L1 adipocytes via PI3K and ERK1/2-dependent pathways. Mol Endocrinol. 2002;16:873–883. doi: 10.1210/mend.16.4.0803. [DOI] [PubMed] [Google Scholar]
- 37.Huttlin EL, Jedrychowski MP, Elias JE, Goswami T, Rad R, Beausoleil SA, Villén J, Haas W, Sowa ME, Gygi SP. A tissue-specific atlas of mouse protein phosphorylation and expression. Cell. 2010;143:1174–1189. doi: 10.1016/j.cell.2010.12.001. [DOI] [PMC free article] [PubMed] [Google Scholar]
- 38.Yu Y, Yoon SO, Poulogiannis G, Yang Q, Ma XM, Villén J, Kubica N, Hoffman GR, Cantley LC, Gygi SP, Blenis J. Phosphoproteomic analysis identifies Grb10 as an mTORC1 substrate that negatively regulates insulin signaling. Science. 2011;332:1322–1326. doi: 10.1126/science.1199484. [DOI] [PMC free article] [PubMed] [Google Scholar]
- 39.Cybulski N, Polak P, Auwerx J, Rüegg MA, Hall MN. mTOR complex 2 in adipose tissue negatively controls whole-body growth. Proc Natl Acad Sci USA. 2009;106:9902–9907. doi: 10.1073/pnas.0811321106. [DOI] [PMC free article] [PubMed] [Google Scholar]
- 40.Kumar A, Lawrence JC, Jr, Jung DY, Ko HJ, Keller SR, Kim JK, Magnuson MA, Harris TE. Fat cell–specific ablation of rictor in mice impairs insulin-regulated fat cell and whole-body glucose and lipid metabolism. Diabetes. 2010;59:1397–1406. doi: 10.2337/db09-1061. [DOI] [PMC free article] [PubMed] [Google Scholar]
- 41.Soukas AA, Kane EA, Carr CE, Melo JA, Ruvkun G. Rictor/TORC2 regulates fat metabolism, feeding, growth, and life span in Caenorhabditis elegans. Genes Dev. 2009;23:496–511. doi: 10.1101/gad.1775409. [DOI] [PMC free article] [PubMed] [Google Scholar]
- 42.Jones KT, Greer ER, Pearce D, Ashrafi K. Rictor/TORC2 regulates Caenorhabditis elegans fat storage, body size, and development through sgk-1. PLoS Biol. 2009;7:e60. doi: 10.1371/journal.pbio.1000060. [DOI] [PMC free article] [PubMed] [Google Scholar]
- 43.Nakae J, Kitamura T, Kitamura Y, Biggs WH, III, Arden KC, Accili D. The forkhead transcription factor Foxo1 regulates adipocyte differentiation. Dev Cell. 2003;4:119–129. doi: 10.1016/s1534-5807(02)00401-x. [DOI] [PubMed] [Google Scholar]
- 44.Brunet A, Park J, Tran H, Hu LS, Hemmings BA, Greenberg ME. Protein kinase SGK mediates survival signals by phosphorylating the forkhead transcription factor FKHRL1 (FOXO3a) Mol Cell Biol. 2001;21:952–965. doi: 10.1128/MCB.21.3.952-965.2001. [DOI] [PMC free article] [PubMed] [Google Scholar]
- 45.Di Pietro N, Panel V, Hayes S, Bagattin A, Meruvu S, Pandolfi A, Hugendubler L, Fejes-Tóth G, Naray-Fejes-Tóth A, Mueller E. Serum- and glucocorticoid-inducible kinase 1 (SGK1) regulates adipocyte differentiation via forkhead box O1. Mol Endocrinol. 2010;24:370–380. doi: 10.1210/me.2009-0265. [DOI] [PMC free article] [PubMed] [Google Scholar]
- 46.Zhang HH, Huang J, Duvel K, Boback B, Wu S, Squillace RM, Wu CL, Manning BD. Insulin stimulates adipogenesis through the Akt-TSC2-mTORC1 pathway. PLoS One. 2009;4:e6189. doi: 10.1371/journal.pone.0006189. [DOI] [PMC free article] [PubMed] [Google Scholar]
- 47.Polak P, Cybulski N, Feige JN, Auwerx J, Rüegg MA, Hall MN. Adipose-specific knockout of raptor results in lean mice with enhanced mitochondrial respiration. Cell Metab. 2008;8:399–410. doi: 10.1016/j.cmet.2008.09.003. [DOI] [PubMed] [Google Scholar]
- 48.García-Martinez JM, Alessi DR. mTOR complex 2 (mTORC2) controls hydrophobic motif phosphorylation and activation of serum- and glucocorticoid-induced protein kinase 1 (SGK1) Biochem J. 2008;416:375–385. doi: 10.1042/BJ20081668. [DOI] [PubMed] [Google Scholar]
- 49.Lamothe B, Besse A, Campos AD, Webster WK, Wu H, Darnay BG. Site-specific Lys-63-linked tumor necrosis factor receptor-associated factor 6 auto-ubiquitination is a critical determinant of IκB kinase activation. J Biol Chem. 2007;282:4102–4112. doi: 10.1074/jbc.M609503200. [DOI] [PMC free article] [PubMed] [Google Scholar]
- 50.Xia S, Chen Z, Forman LW, Faller DV. PKCδ survival signaling in cells containing an activated p21Ras protein requires PDK1. Cell Signal. 2009;21:502–508. doi: 10.1016/j.cellsig.2008.12.002. [DOI] [PMC free article] [PubMed] [Google Scholar]
- 51.Hsieh AC, Bo R, Manola J, Vazquez F, Bare O, Khvorova A, Scaringe S, Sellers WR. A library of siRNA duplexes targeting the phosphoinositide 3-kinase pathway: Determinants of gene silencing for use in cell-based screens. Nucleic Acids Res. 2004;32:893–901. doi: 10.1093/nar/gkh238. [DOI] [PMC free article] [PubMed] [Google Scholar]
- 52.Sithanandam G, Fornwald LW, Fields JR, Morris NL, Anderson LM. Anti-tumor efficacy of naked siRNAs for ERBB3 or AKT2 against lung adenocarcinoma cell xeno-grafts. Int J Cancer. 2012;130:251–258. doi: 10.1002/ijc.26041. [DOI] [PMC free article] [PubMed] [Google Scholar]
- 53.Kinoshita E, Kinoshita-Kikuta E, Takiyama K, Koike T. Phosphate-binding tag, a new tool to visualize phosphorylated proteins. Mol Cell Proteomics. 2006;5:749–757. doi: 10.1074/mcp.T500024-MCP200. [DOI] [PubMed] [Google Scholar]
- 54.Sui X, Shin S, Zhang R, Firozi PF, Yang L, Abbruzzese JL, Reddy SA. Hdm2 is regulated by K-Ras and mediates p53-independent functions in pancreatic cancer cells. Oncogene. 2009;28:709–720. doi: 10.1038/onc.2008.423. [DOI] [PubMed] [Google Scholar]
- 55.Jiang ZY, Zhou QL, Coleman KA, Chouinard M, Boese Q, Czech MP. Insulin signaling through Akt/protein kinase B analyzed by small interfering RNA-mediated gene silencing. Proc Natl Acad Sci USA. 2003;100:7569–7574. doi: 10.1073/pnas.1332633100. [DOI] [PMC free article] [PubMed] [Google Scholar]
- 56.Zhang Y, Goldman S, Baerga R, Zhao Y, Komatsu M, Jin S. Adipose-specific deletion of autophagy-related gene 7 (atg7) in mice reveals a role in adipogenesis. Proc Natl Acad Sci USA. 2009;106:19860–19865. doi: 10.1073/pnas.0906048106. [DOI] [PMC free article] [PubMed] [Google Scholar]
- 57.Dani C, Smith AG, Dessolin S, Leroy P, Staccini L, Villageois P, Darimont C, Ailhaud G. Differentiation of embryonic stem cells into adipocytes in vitro. J Cell Sci. 1997;110(Pt. 11):1279–1285. doi: 10.1242/jcs.110.11.1279. [DOI] [PubMed] [Google Scholar]
- 58.Yin Y, Yuan H, Wang C, Pattabiraman N, Rao M, Pestell RG, Glazer RI. 3-Phosphoinositide-dependent protein kinase-1 activates the peroxisome proliferator-activated receptor-γ and promotes adipocyte differentiation. Mol Endocrinol. 2006;20:268–278. doi: 10.1210/me.2005-0197. [DOI] [PubMed] [Google Scholar]
- 59.Whitehead JP, Molero JC, Clark S, Martin S, Meneilly G, James DE. The role of Ca2+ in insulin-stimulated glucose transport in 3T3-L1 cells. J Biol Chem. 2001;276:27816–27824. doi: 10.1074/jbc.M011590200. [DOI] [PubMed] [Google Scholar]
- 60.Harrison SA, Buxton JM, Clancy BM, Czech MP. Insulin regulation of hexose transport in mouse 3T3-L1 cells expressing the human HepG2 glucose transporter. J Biol Chem. 1990;265:20106–20116. [PubMed] [Google Scholar]
Associated Data
This section collects any data citations, data availability statements, or supplementary materials included in this article.
Supplementary Materials
Fig. S1. Identification of an Akt1-interacting protein.
Fig. S2. BSTA (Mr 55,000) interacts with Akt and is phosphorylated in cells.
Fig. S3. Akt activity is dispensable for the BSTA-Akt interaction.
Fig. S4. Identification of a putative BSTA-binding sequence in Akt1.
Fig. S5. Effect of BSTA mutants and siRNA on the phosphorylation status of Akt.
Fig. S6. Mechanism of BSTA-mediated phosphorylation of Akt.
Fig. S7. Akt multimerization requires BSTA and mTORC2.
Fig. S8. BSTA promotes glucose uptake and adipocyte differentiation.
Fig. S9. Effects of BSTA, BSTA-AA, BSD, and BSD-AA on adipocyte differentiation.
Fig. S10. BSTA, Ser473 in Akt, and FoxC2 regulate adipocyte differentiation.