Abstract
Although plant diseases can be caused by bacteria, viruses, and protists, most are caused by fungi and fungus-like oomycetes. Intensive use of fungicides with the same mode of action can lead to selection of resistant strains increasing the risk of unmanageable epidemics. In spite of the integrated use of nonchemical plant disease management strategies, agricultural productivity relies heavily on the use of chemical pesticides and biocides for disease prevention and treatment and sanitation of tools and substrates. Despite the prominent use of fungi in early hormesis studies and the continuous use of yeast as a research model, the relevance of hormesis in agricultural systems has not been investigated by plant pathologists, until recently. A protocol was standardized for detection and assessment of chemical hormesis in fungi and oomycetes using radial growth as endpoint. Biphasic dose-responses were observed in Pythium aphanidermatum exposed to sub-inhibitory doses of ethanol, cyazofamid, and propamocarb, and in Rhizoctonia zeae exposed to ethanol. This report provides an update on chemical hormesis in fungal plant pathogens and a perspective on the potential risks it poses to crop productivity and global food supply.
Keywords: chemical hormesis, oomycetes, fungi, low-dose, biphasic, growth stimulation, plant pathogen
INTRODUCTION
The biphasic dose response characterized by stimulation at low doses and inhibition at high doses of a stressor, known as hormesis, is an adaptive response that can be either directly induced or the result of overcompensation after the alteration of homeostasis in a biological process (Calabrese and Baldwin, 2002). Hormesis is a general biological phenomenon, independent of environmental stresses and biological endpoints (Calabrese and Baldwin, 2001), with relevance to biological and chemical research in many fields of science including toxicology, pharmacology, medicine, microbiology, mycology, epidemiology, and plant pathology (Calabrese, 2008; Calabrese and Baldwin, 2001; Calabrese and Blain, 2009; Davis and Svendsgaard, 1990; Southam and Ehrlich, 1943; Stebbing, 1982, 1987).
Although plant diseases can be caused by bacteria, viruses, and protists, most are caused by fungi and oomycetes. In spite of the integrated use of nonchemical plant disease management strategies, agricultural productivity relies heavily on the use of chemical pesticides and biocides for disease prevention and treatment and sanitation of tools and substrates. Intensive use of fungicides with the same mode of action can lead to selection of resistant pathogen strains increasing the risk of unmanageable epidemics. Little is known about the effects of subinhibitory doses of fungicides on the metabolism of fungal plant pathogens and their ability to cause plant diseases. There are few reports of hormetic responses in plant pathogens, including growth stimulation of Fomitopsis officinalis by red cedar extracts (Southam and Ehrlich, 1943); biphasic dose responses of Fusarium oxysporum to trichothecin (Hessayon, 1953); increased germination of Penicillium expansum in the presence of thiabendazole (Baraldi et al., 2003); and increased pathogenicity and radial growth stimulation in Pythium aphanidermatum by low doses of mefenoxam (Garzón et al., 2011). Although observations of mycelial growth stimulation by fungicides in resistant strains of fungi and oomycetes can be found in the phytopathological literature (Hocart et al. 1990; Zhang et al., 1997; Parra and Ristaino, 2001), these effects have often been overlooked. Unintentional exposure of resistant strains to subinhibitory doses of fungicides has the potential to enhance their pathogenicity (Garzon et al. 2011), increase disease severity, and decrease crop productivity. Therefore, detection of hormetic responses in plant pathogen populations may be crucial for disease management, but their relevance has largely been ignored.
In vitro assessment of pathogen fungicide sensitivities is periodically conducted by researchers to monitor for the emergence of fungicide resistance; this is also done when fungicide resistance is suspected in a particular agricultural system. Unfortunately, current protocols are not designed to detect hormesis, and occasional observations of increased growth at low doses, and sometimes application doses, are accidental. We developed a protocol for fungicide sensitivity testing that can also detect hormetic effects on the growth of fungi and oomycetes. To detect hormesis, three experimental design requirements need to be fulfilled: (i) The NOAEL must be determined; (ii) evenly distributed doses below the NOAEL need to be tested to provide enough data to detect hormesis; and (iii) doses tested below the NOAEL should be separated by less than one order of magnitude since the hormetic zone is usually within a ten-fold range (Calabrese and Baldwin, 1997). Evaluation of data is very important when proving hormesis. Crump (2001) established four criteria for evaluating hormesis: strength of evidence, soundness of data, consistency, and biological plausibility. To detect hormesis in dose response relationships statistical analyses capable of differentiating a small response to stimuli from background noise are needed. The Brain-Cousens (Brain and Cousens, 1989) non-linear regression model describes the dose response relationship when there is stimulation at low doses followed by inhibition at high doses. The sigmoidal curve, commonly used in dose-response models, is a special case of the Brain-Cousens model, and arises when there is no stimulation at low doses (Brain and Cousens, 1989).
The objectives of this study were to (i) develop a protocol for robust detection of hormetic responses in fungi and oomycetes in vitro, and (ii) assess the effects of decreasing concentrations of disinfectants and fungicides on the radial growth in vitro of Pythium aphanidermatum and Rhizoctonia zeae.
MATERIALS AND METHODS
Inoculum
A strain of P. aphanidermatum previously characterized as mefenoxam and propamocarb resistant (isolate P18) by Dr. Gary Moorman (The Pennsylvania State University) and known to hormetically respond to mefenoxam (Garzon et al. 2011) was studied. The strain was maintained in long term storage as oospores in water agar (WA) plugs, kept under sterile water, at room temperature, in the dark. At the beginning of the experiment five WA plugs were transferred first to corn meal agar (CMA) to encourage oospore germination, then transferred to a PARP selective medium [Difco cornmeal agar amended with pimaricin 5 mg l−1 + ampicillin 250 mg l−1 + rifampicin 10 mg l−1 + pentachloronitrobenzene (PCNB) 100 mg l−1] (Jeffers and Martin, 1986) to eliminate possible bacterial contamination, and finally maintained actively growing on CMA for the duration of the study. One strain each of Rhizoctonia zeae and R. solani collected from Pencross turfgrass with symptoms of brown patch in Oklahoma were provided by Dr. Nathan Walker (Oklahoma State University). The Rhizoctonia strains were maintained actively growing on CMA for the duration of the study. Before each trial, fresh cultures of each pathogen were grown on CMA for 3 days in the dark at 28° C for use in various experiments.
Radial growth in vitro assessment
The effects of subinhibitory concentrations of ethanol and sodium hypochlorite on P. aphanidermatum and R. zeae, and the fungicides, cyazofamid (Segway® 34.5 % a.i., FMC Corporation, West Point, GA) and propamocarb (Previcur Flex® 66.5 % a.i., Bayer CropScience, Kansas City, MO) on P. aphanidermatum isolate P18, and propiconazole (Ferti-lome® 1.55% a.i., VPG, Bonham, TX) on R. zeae and R. solani, were evaluated. CMA (Becton Dickinson and company, Sparks, MD) was prepared according to the manufacturer’s instructions at 18.75 g l−1, dispensed in a number of flasks equal to the number of treatments in each assay, and autoclaved for 20 min. The media was cooled down to 55° C in a water bath before adding disinfectant and fungicide solutions.
For ethanol, the standard concentration for surface sterilization of 7.5 × 10⁵ ppm was used as the initial reference dose. To determine the zone where ethanol had activity against the pathogen an experiment was performed with a range of concentrations from 7.5 × 10⁴ ppm to 7.5 × 10⁻¹⁵ ppm, and a 0 ppm control. Then, a second experiment to estimate the no observed adverse effect level (NOAEL) was carried out with concentrations 0, 47, 120, 300, 750, 1,900, 4,700, 12,000, 30,000, and 75,000 ppm ethanol. Since the estimated NOAEL ethanol dose was similar for P. aphanidermatum and R. zeae, the same concentrations were used for both pathogens. The experiment was repeated three times with P. aphanidermatum and four times with R. zeae.
The sodium hypochlorite (SH) concentration routinely used for seed surface sterilization (30% bleach or 2 × 10⁴ ppm SH) was used as a reference dose. Assays to determine SH inhibitory doses for P. aphanidermatum and R. zeae were performed with a range of SH concentrations from 2,000 ppm down to 2 × 10⁻¹⁶ ppm. A second assay, using concentrations of 0, 0.5, 1.3, 3.2, 8.0, 20, 50, 130, 320, 800, and 2,000 ppm SH was conducted with three repetitions over time for both pathogens.
Fungicide 10X working solutions were prepared with sterile water in amber glass bottles, mixed on a stirring plate at medium speed for two minutes, and used within 24 hours. Each CMA-fungicide dilution combination was stirred for two minutes and poured into 9 cm dia petri dishes containing 25 ml of medium each. To determine the bench mark dose (BMD) of each fungicide, minimum application rates (MAR) of the active ingredients were transformed to parts per million (ppm) assuming a soil bulk density of 1.2 g cm−3 and an effective soil depth of 2 cm (Chen et al., 2001). Corn meal agar amended with fungicide concentrations ranging from MAR × 104 to MAR × 10−4 (total to no inhibition) 10 fold apart, was prepared.
Once the BMD for each fungicide (described below) was calculated, it was used as reference in a second assay using concentrations of 0, BMD × 10−2, BMD × 10−1.5, BMD × 10−1, BMD × 10−0.5, BMD, BMD × 100.5, BMD × 10, BMD × 102 and BMD × 103 for cyazofamid, and 0, BMD × 10−1.4, BMD × 10−1, BMD × 10−0.6, BMD × 10−0.2, BMD × 100.2, BMD × 100.6, BMD × 10, BMD × 102, BMD × 103and BMD × 104 for propamocarb and propiconazole. Agar plugs 5 mm in diameter were taken equidistantly from the center of a 3 day old culture and placed on the center of petri dishes with fungicide amended CMA. Petri dishes were sealed with parafilm and incubated at 28 °C in the dark. Radial growth was measured using a Kobalt 6” digital caliper (Lowe’s Cos., N. Wilkesboro, NC) after 24 h, and the mean value of two perpendicular diameters on each plate was used as a datapoint for statistical analyses. Each assay included 10 treatments with five replicates each. Assays were repeated at least three times. Radial growth of P. aphanidermatum and Rhizoctonia spp. on CMA with the resulting fungicide concentrations was used for modeling dose response curves.
Data analysis
The BMD was calculated using the US Environmental Protection Agency National Center for Environmental Assessment Software BMDS 2.1 (http://www.epa.gov/ncea/bmds/progreg.html), a software designed for hazardous pollutant risk assessments. A continuous Hill model using default parameters was run following the guidelines of the program. Data required for calculating the BMD included dose, mean length of radial growth, number of replicates and standard deviation. Mean radial growth and standard deviations were calculated from three replicates for each concentration. The BMD was set as one control standard deviation from the control mean and a 0.95 confidence level was used. Tests to evaluate goodness-of-fit, defined by the BMDS 2.1 software as “Global Measures for Continuous Models”, and visual examination, were considered to determine the appropriateness and fit of the model.
A Brain-Cousens non-linear regression model (Brain and Cousens, 1989) defined by Eq. [1] was used to detect the presence of hormesis and to estimate the EC50, NOAEL and MSD as described by Schabenberger et al. (1999). When hormesis was not present (i.e. 95% confidence range for γ included 0 or negative values), a log-logistic curve was modeled instead (Schabenberger et al., 1999). Curve modeling was performed using a non-linear modeling procedure (PROC-NLIN, SAS 9.2, SAS Institute, Cary, NC). For model building purposes, initial parameters (β, γ, and EC50) were approximated from experimental data. Radial growth data were transformed to percentages of the control. Since the upper limit of the curve was determined by the radial growth of the control, α was fixed at 100 and the lower limit δ was fixed at 0 (total growth inhibition) on the curve modeling program (Schabenberger et al., 1999). The SAS code parameterized in terms of EC50 is as follows: proc nlin data = dataset noitprint method = marquardt; parameters β 2.0 EC50 10 γ 0.1 ; omega = 1 + 2*gamma*EC50/(100); term = 1 + omega * exp(beta*log(rate/EC50)); model resp = (100 + gamma*rate) / term); run. The response values were plotted against the natural logarithm of several doses including the estimated NOAEL, EC50, and MSD on EXCEL® (Microsoft, Redmond, WA).
| [1] |
Where
: average response at concentration x
α: upper bound
δ: lower bound
β: slope at the EC50 dose
γ: rate of increase at low concentrations
The presence/absence of hormesis was also tested using the non-linear regression model by Cedergreen et al. (2005). Analysis of variance (ANOVA) between treatments, replicates, and repetitions was performed using a generalized linear model procedure (PROC-GLM, SAS 9.2, SAS Institute, Cary, NC). Student’s t test for small samples was also used for detecting significant growth stimulation by low pesticide concentrations.
RESULTS
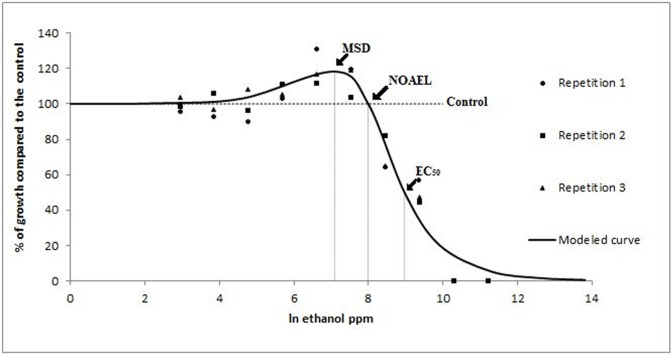
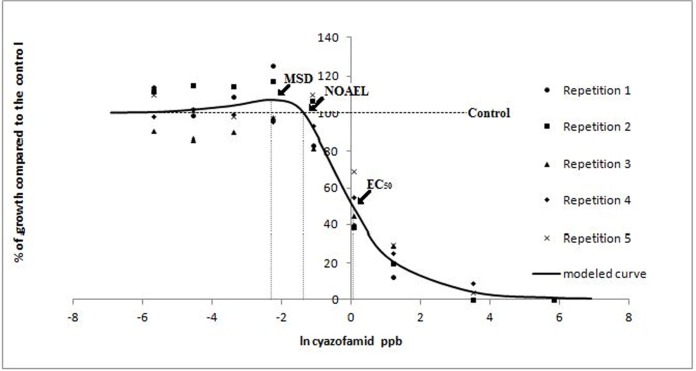
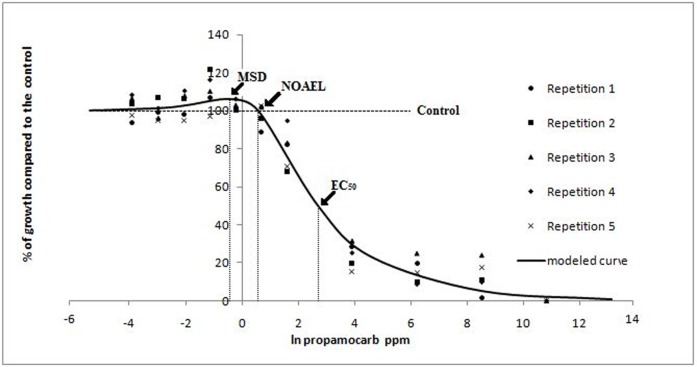
Pythium aphanidermatum. According to the Brain-Cousens non-linear regression model (Brain and Cousens, 1989) the EC50 of ethanol on P. aphanidermatum was 8.97 and β was 1.9; both parameters define the shape of the curve. The 95% confidence limits of γ (0.032) ranged from 0.014 to 0.049 indicating an increase in growth at low doses (Fig. 1). Ethanol NOAEL and MSD values were 7.99 and 7.09 respectively. No growth stimulation due to low concentrations of sodium hypochlorite was observed (data not shown). The MAR of cyazofamid and propamocarb were 0.33 ppm and 6 ppm respectively, resulting in a BMD of 0.0003 ppm for cyazofamid and 0.5 ppm for propamocarb. The modeled dose response curve of cyazofamid showed a biphasic shape with a maximum growth stimulation of 6% at the MSD of 0.11 ppb (Fig. 2). The modeled dose response curve of propamocarb on P. aphanidermatum was also biphasic and showed a maximum growth stimulation of 6% at a MSD of 0.64 ppm. According to the model, the EC50 for cyazofamid against isolate P18 was 1.06 ppb and β was 1.67; while for propamocarb (Fig. 3), the EC50 was 14.91 ppm and β was 1.37. The dose response curve of cyazofamid and propamocarb had positive γ (166.7 ± 112.3 and 35.17 ± 21.13, respectively) supporting the presence of hormesis in response to both fungicides. The NOAEL values were 0.26 ppb and 1.77 ppm for cyazofamid and propamocarb, respectively. Concentrations below the BMD (BMD×10−2, 10−1.5, 10−1, and 10−0.5 cyazofamid, and BMD × 10−1.4, 10−1, 10−0.6, 10−0.2 and 100.2 propamocarb) were also below the NOAEL. According to the Cedergreen model (Cedergreen et al., 2005), both propamocarb and cyazofamid had a hormetic effect on P. aphanidermatum, while Student’s t test revealed the presence of hormesis for propamocarb but not for cyazofamid.
FIG. 1.
Modeled curve of the radial growth in vitro of P. aphanidermatum in response to subinhibitory doses of ethanol. Radial growth is expressed as percentages relative to a non-amended control, and concentrations as natural logarithm of ppm. Each data point in the figure represents the mean value of three replicates. The slope of the curve at the EC50 was 8.97, β was 1.9 and the rate of increase at low doses (γ) was 0.032. Low-dose stimulation was observed.
FIG. 2.
Observed values and modeled curve of the radial growth in vitro of P. aphanidermatum in response to low doses of cyazofamid. Radial growth is expressed as percentages relative to a non-amended control, and concentrations as natural logarithm of ppb. Each data point in the figure represents the mean value of five replicates. Arrows indicate the natural logarithm of the EC50 (1.06 ppb), NOAEL (0.26 ppb) and MSD (0.11 ppb). The slope of the curve at the EC50 (β) was 1.67 and the rate of increase at low doses (γ) was 166.7. Low-dose stimulation was observed.
FIG. 3.
Observed values and modeled curve of the radial growth in vitro of P. aphanidermatum in response to low doses of propamocarb. Radial growth is expressed as percentages relative to a non-amended control, and concentrations as natural logarithm of ppm. Each data point in the figure represents the mean value of five replicates. Arrows indicate the natural logarithm of the EC50 (14.91 ppm), NOAEL (1.77 ppm) and MSD (0.64 ppm). The slope of the curve at the EC50 (β) was 1.37 and the rate of increase at low doses (γ) was 35.17. Low-dose stimulation was observed.
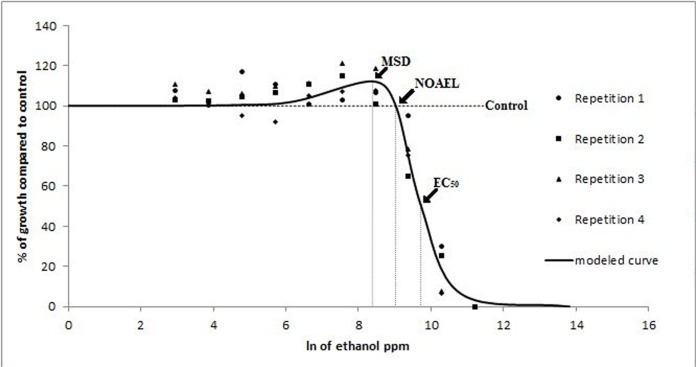
Rhizoctonia spp. According to the Brain-Cousens non-linear regression model (Brain and Cousens, 1989), the ethanol EC50 on R. zeae was 9.62 and β was 2.83. NOAEL and MSD values were 8.89 and 8.26 ppm, respectively. The 95% confidence limits of γ (0.0036) ranged from 0.00083 to 0.0063 indicating growth increase at low doses, with a maximum growth stimulation of 10% at the MSD (Fig. 4). Seven ethanol doses were below the NOAEL. No growth stimulation was observed at low SH doses (data not shown). Propiconazole MAR of R. solani was 0.5 ppm and the BMD was 0.06 MAR (0.03 ppm). The data were fit to the log-logistic model estimating an EC50 of 1.33 and β of 0.54, which defined the shape of the dose-response curve (Fig 5). No propiconazole low-dose stimulation was detected by either statistical test in R. solani or R. zeae (data not shown).
FIG. 4.
Modeled curve of the radial growth in vitro of R. zeae in response to subinhibitory doses of ethanol. Radial growth is expressed as percentages relative to a non-amended control, and concentrations as natural logarithm of ppm. Each data point in the figure represents the mean value of three replicates. The slope of the curve at the EC50 (β) was 2.83 and the rate of increase at low doses (γ) was 8.26. Low-dose stimulation was observed.
FIG. 5.
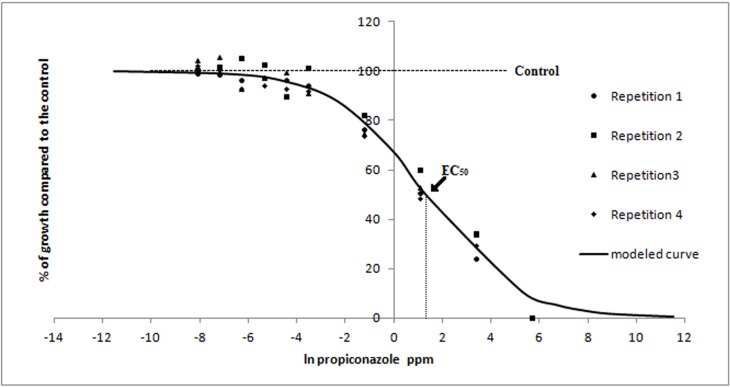
Observed values and modeled curve of the radial growth in vitro of R. solani in response to low doses of propiconazole. Radial growth is expressed as percentages relative to a non-amended control, and concentrations as natural logarithm of ppm. Each data point in the figure represents the mean value of four replicates. Arrows indicate the natural logarithm of the EC50 (3.76 ppm).The slope of the curve at the EC50 (β) was 0.54.
Significant differences between replicates were not found in any assay, but there were significant differences between repetitions and between treatments.
DISCUSSION
Hormetic responses to ethanol, cyazofamid, and propamocarb were observed on the radial growth in vitro of P. aphanidermatum, and to ethanol in R. zeae. Standardization and optimization of protocols for evaluation of the effect of low doses of fungicides was necessary to minimize experimental error and to detect radial growth changes in response to very dilute chemical concentrations. Although previous research reported radial growth stimulation in vitro in response to low doses of mefenoxam in P. aphanidermatum isolate P18 (Garzón et al., 2011) experimental design restrictions prevented statistical evaluation for hormetic responses, and large variation among trials of in vitro assays limited our ability to assess the statistical significance of the observed stimulation. The methods reported here minimized variation and increased reproducibility of results. The experimental design and laboratory protocols described here can be applied to evaluate chemical hormesis in other oomycetes and fungi using radial growth as endpoint.
This is the first report of in vitro growth stimulation due to chemical hormesis in the fungal plant pathogen Rhizoctonia zeae, and the second in P. aphanidermatum. The strain of P. aphanidermatum studied (P18) was previously characterized as mefenoxam and propamocarb resistant and having hormetic response to mefenoxam (Moorman and Kim, 2004; Garzon et al. 2011). In this study we report additional hormetic responses of this strain to ethanol, cyazofamid, and propamocarb. Calabrese and Blain (2005) described the typical hormetic response as modest in both magnitude and width. According to our experimental data, the range of growth stimulating concentrations of cyazofamid on P. aphanidermatum had a threefold width from the concentration where the response started to increase compared to the control to the estimated NOAEL, and a six fold width in the case of propamocarb. Although stimulation was observed consistently at doses within the hormetic curve for cyazofamid, maximum stimulation was achieved at different doses across repetitions. Variation in the maximum stimulation dose was probably a consequence of cyazofamid being inhibitory to isolate P18 at a very low concentration (1 ppb), making experimental error more likely. Garzon et al. (2011) observed a mean radial growth increase in vitro of up to 10% at subinhibitory concentrations, and increased pathogenicity of P18 on geranium seedlings, with damping-off severity increases ranging from 13% to 61% after 24 hrs of exposure to mefenoxam doses from 1 μg/ml to 1×10⁻¹⁸ μg/ml. In this study, radial grow stimulation up to 6% was observed at subinhibitory concentrations of propamocarb and cyazofamid. Since P. aphanidermatum isolate P18 shows resistance to mefenoxam and propamocarb, it is possible that its plasticity is exceptional and may not be representative of the species. Nonetheless, slight growth stimulation by exposure to 1 ppm propamocarb was reported by Moorman and Kim (2004) in P. aphanidermatum, Pythium irregulare, and P. ultimum isolates with resistance to mefenoxam and propamocarb, recovered from ornamental greenhouses in Pennsylvania. Therefore, chemical hormesis may be present not just in other P. aphanidermatum strains, but in other Pythium species as well. The mechanisms involved in the observed radial growth stimulation in Pythium are unknown. Since the fungicides studied have different mechanisms of action, involvement of diverse metabolic pathways can be expected. Cyazofamid inhibits complex III activity of the respiratory pathway in oomycetes (Mitani et al., 2001), while propamocarb acts on Pythium by disrupting cell membrane structure leading to leaks of cytoplasmic materials (Papavizas et al., 1978). Biphasic dose responses have also been observed in Phytophthora species (Parra and Ristaino, 2001; Zhang et al., 1997) and in the fungi Penicillium expansum (Baraldi et al., 2003) and Foma officinalis (Southam and Ehrlich, 1943).
Comparative tests failed to detect hormesis when low stimulations were present. For instance, the effect of doses below the NOAEL of cyazofamid on P. aphanidermatum, with an average stimulation of 6%, did not show a significant difference when compared to the control according to ANOVA. Furthermore, comparative analyses treat data as a discrete set (Schabenberger et al., 1999). The Brain-Cousens model (Brain and Cousens, 1989) represents a better choice for detection and assessment of hormesis since it implies continuity of the dosage, and important parameters such as the MSD, NOAEL, and EC50can be inferred (Schabenberger et al., 1999). There is, nonetheless, a drawback to the Brain-Cousens model (Brain and Cousens, 1989). If β is smaller than 1, the model does not yield a dose-response curve (Cedergreen et al., 2005). For such cases the model developed by Cedergreen et al. (2005) can be used to quantitatively determine hormesis. The model by Cedergreen et al. (2005) is robust and can be useful in many scenarios, but parameters such as NOAEL, MSD, and EC50 cannot be estimated. In this study the Cedergreen model (Cedergreen et al., 2005) was employed to corroborate the presence/absence of hormesis for all dose-response experiments performed, and showed results consistent with the Brain-Cousens model (Brain and Cousens, 1989).
For detecting hormesis it is essential to test several doses below the NOAEL at intervals smaller than one order of magnitude. A BMD equal to one standard deviation from the control can be used as a reference for determining doses that would fall in the hormetic zone. For dose response curves where hormesis was present doses within one order of magnitude below the BMD fell into the hormetic zone. The protocol developed in this study fulfilled criteria for evaluating hormesis (Crump, 2001): strength of evidence, soundness of data, consistency, and biological plausibility. It is important to emphasize that hormesis should be taken into account when modeling dose effect relationships between fungicides and fungal plant pathogens, since there may be potentially significant shifts in EC50 values when hormetic effects are considered (Schabenberger et al., 1999).
This study shows statistical evidence of growth stimulation in vitro of R. zeae and P. aphanidermatum in response to low doses of ethanol and of P. aphanidermatum to fungicides and provides tools to assess the occurrence of hormesis in this and other fungal systems. The absence of hormesis in the radial growth of R. solani in response to subinhibitory concentrations of propiconazole shows that hormesis may not be observable using radial growth as endpoint for this organism and it is not possible to predict its response to subinhibitory fungicide doses in vivo. Even though there is evidence that in vitro dose-response may not be comparable to in vivo responses at the high dose end of the dose-response curve (Bruin and Edgington, 1981), at the low dose end, small radial growth stimulation in vitro may be correlated to significant stimulation of virulence (Garzón et al., 2011). The risk of stimulation of oomycete and fungal strains by exposure to subinhibitory doses of fungicides in agricultural systems is possible, with unpredictable consequences. Potentially, accidental stimulation of fungicide resistant plant pathogenic strains may result in higher levels of disease, even at recommended application doses, and may represent a threat to agricultural productivity. The impact of chemical hormesis on agricultural systems is still unknown although potentially significant to disease management.
Acknowledgments
We thank Dr. Gary Moorman and Dr. Nathan Walker for providing the P. aphanidermatum and Rhizoctonia spp. isolates used in this investigation; Dr. Julio Molineros for his advice on statistical analysis; Dr. Damon Smith and Dr. Hasan Melouk for reviewing early versions of the manuscript, and Andrea Brenner, Patricia Garrido, Kylie Blough, Christian Sanchez, and Carla Rodriguez for technical assistance. This research was supported by the Oklahoma Agricultural Experiment Station (project OKL02698).
REFERENCES:
- Baraldi E, Mari M, Chierici E, Pondrelli M, Bertolini P, Pratella GC. Studies on thiabendazole resistance of Penicillium expansum of pears: pathogenic fitness and genetic characterization. Plant Pathol. 2003;52:362–370. [Google Scholar]
- Brain P, Cousens R. An equation to describe dose responses where there is stimulation of growth at low doses. Weed Res. 1989;29:93–96. [Google Scholar]
- Bruin GCA, Edgington LV. Adaptive resistance in Peronosporales to metalaxyl. Can J Plant Pathol. 1981;3:201–206. [Google Scholar]
- Calabrese EJ. What Is Hormesis? In: Bourg EL, Rattan SIS, editors. Mild Stress and Healthy Aging. Springer; Netherlands: 2008. pp. 5–19. [Google Scholar]
- Calabrese EJ, Baldwin LA. A quantitatively-based methodology for the evaluation of chemical hormesis. Hum Ecol Risk Assess. 1997;3:545–554. [Google Scholar]
- Calabrese EJ, Baldwin LA. Hormesis: A generalizable and unifying hypothesis. Crit Rev Toxicol. 2001;31:353–424. doi: 10.1080/20014091111730. [DOI] [PubMed] [Google Scholar]
- Calabrese EJ, Baldwin LA. Defining hormesis. Hum Exp Toxicol. 2002;21:91–97. doi: 10.1191/0960327102ht217oa. [DOI] [PubMed] [Google Scholar]
- Calabrese EJ, Blain R. The occurrence of hormetic dose responses in the toxicological literature, the hormesis database: an overview. Toxicol Appl Pharmacol. 2005;202:289–301. doi: 10.1016/j.taap.2004.06.023. [DOI] [PubMed] [Google Scholar]
- Calabrese EJ, Blain RB. Hormesis and plant biology. Environ Pollut. 2009;157:42–48. doi: 10.1016/j.envpol.2008.07.028. [DOI] [PubMed] [Google Scholar]
- Cedergreen N, Ritz C, Streibig JC. Improved empirical models describing hormesis. Environ Toxicol Chem. 2005;24:3166–3172. doi: 10.1897/05-014r.1. [DOI] [PubMed] [Google Scholar]
- Chen S-K, Edwards CA, Subler S. Effects of the fungicides benomyl, captan and chlorothalonil on soil microbial activity and nitrogen dynamics in laboratory incubations. Soil Biol Biochem. 2001;33:1971–1980. [Google Scholar]
- Crump K. Evaluating the evidence for hormesis: A statistical perspective. Hum Ecol Risk Assess. 2001;7:781. doi: 10.1080/20014091111947. [DOI] [PubMed] [Google Scholar]
- Davis JM, Svendsgaard DJ. U-shaped dose-response curves, their occurrence and implications for risk assessment. J. Toxicol. Environ Health. 1990;30:71–83. doi: 10.1080/15287399009531412. [DOI] [PubMed] [Google Scholar]
- Garzón CD, Molineros JE, Yánez JM, Flores FJ, Jiménez-Gasco MdM, Moorman GW. Sublethal doses of mefenoxam enhance Pythium damping-off of geranium. Plant Dis. 2011;95:1233–1238. doi: 10.1094/PDIS-09-10-0693. [DOI] [PubMed] [Google Scholar]
- Hessayon DG. Double-action of trichothecin and its production in soil. Nature. 1953;4284:998–999. doi: 10.1038/168998b0. [DOI] [PubMed] [Google Scholar]
- Hocart MJ, Lucas JA, Peberdy JF. Resistance to fungicides in field isolates and laboratory induced mutants of Pseudocercosporella herpotrichoides. Mycol Res. 1990;94:9–17. [Google Scholar]
- Jeffers SN, Martin SB. Comparison of two media selective for Phytophthora nad Pythium species. Plant Dis. 1986;11:1038–1043. [Google Scholar]
- Mitani S, Araki S, Takii Y, Ohshima T, Matsuo N, Miyoshi H. The biochemical mode of action of the novel selective fungicide cyazofamid: Specific inhibition of mitochondrial complex III in Pythium spinosum. Pestic Biochem Phys. 2001;71:107–115. [Google Scholar]
- Moorman GW, Kim SH. Species of Pythium from greenhouses in Pennsylvania exhibit resistance to propamocarb and mefenoxam. Plant Dis. 2004;88:630–632. doi: 10.1094/PDIS.2004.88.6.630. [DOI] [PubMed] [Google Scholar]
- Papavizas GC, Oneill NR, Lewis JA. Fungistatic activity of propyl-N-(g-dimethylamino-propyl) carbamate on Pythium spp. and its reversal by sterols. Phytopathology. 1978;68:1667–1671. [Google Scholar]
- Parra G, Ristaino JB. Resistance to mefenoxam and metalaxyl among field isolates of Phytophthora capsici causing Phytophthora blight of bell pepper. Plant Dis. 2001;85:1069–1075. doi: 10.1094/PDIS.2001.85.10.1069. [DOI] [PubMed] [Google Scholar]
- Schabenberger O, Tharp BE, Kells JJ, Penner D. Statistical tests for hormesis and effective dosages in herbicide dose response. Agron J. 1999;91:713–721. [Google Scholar]
- Southam CM, Ehrlich J. Effects of extract of western red-cedar heartwood on certain wood-decaying fungi in culture. Phytopathology. 1943;33:517–524. [Google Scholar]
- Stebbing AR. Hormesis—the stimulation of growth by low levels of inhibitors. Sci Total Environ. 1982;22:213–234. doi: 10.1016/0048-9697(82)90066-3. [DOI] [PubMed] [Google Scholar]
- Stebbing AR. Growth hormesis a by-product of control. Health Phys. 1987;52:543–547. doi: 10.1097/00004032-198705000-00003. [DOI] [PubMed] [Google Scholar]
- Zhang SY, Panaccione DG, Gallegly ME. Metalaxyl stimulation of growth of isolates of Phytophthora infestans. Mycologia. 1997;89:289–292. [Google Scholar]


