

Abstract
The controlled synthesis of high-yield gold nanostars of varying sizes, their characterization and use in surface-enhanced Raman scattering (SERS) measurements are reported for the first time. Gold nanostars ranging from 45 to 116-nm in size were synthesized in high-yield, physically modeled and optically characterized using transmission and scanning electron microscopy and UV-Visible absorption spectroscopy. The nanostar characterization involved both studying morphology evolution over time and size as a function of nucleation. The nanostars properties as substrates for SERS were investigated and compared with respect to size. As the overall star size increases, so does the core size, the number of branches and branch aspect ratio; the number of branch tips per star surface area decreases with increasing size. The stars become more inhomogeneous in shape, although their yield is high and overall size remains homogeneous. Variations in star size are also accompanied by shifts of the long plasmon band in the NIR region, which hints towards tuning capabilities that may be exploited in specific SERS applications. The measured SERS enhancement factors suggest an interesting correlation between nanostar size and SERS efficiencies, and were relatively consistent across different star samples, with the enhancement factor estimated as 5×10³ averaged over the 52-nm nanostars for 633-nm excitation.
Keywords: Nanostars, Plasmonics, Surface Enhanced Raman Scattering (SERS), p-MercaptoBenzoic Acid (p-MBA)
1. Introduction
Surface-enhanced Raman scattering (SERS) is a powerful tool for the analysis of vibrational information of analyte molecules, sufficiently sensitive to achieve single molecule detection.1,2 SERS is the result of two main types of enhancement: electromagnetic and chemical3, where the former stems from the local electromagnetic (EM) field enhancement, and the latter results from the electronic resonance-charge transfer between the molecule and metal surface. Recently, much emphasis has been put on controlling the shape of the metallic substrate as this process has been shown to significantly alter the local field enhancement experienced by the adsorbed analyte, and thus the enhancement factor (EF). Our laboratory has been involved in the development of SERS-active nanostructures for chemical and biomedical sensing.4–6 Recently, SERS measurements for gold and silver substrates have already been reported for several other particle morphologies, including dendrites7, rods8, cubes9 and colloids.10 The synthesis of exotic nanostars has been reported in low yield 11 and more recently in high yield.12 However, the SERS effect, has not been demonstrated for this intriguing shape. Additionally, the size control of these particles, in conjunction with their modeling and numerical analysis, has not yet, to the best of our knowledge, been reported.
This paper reports a thorough analysis and comparison of the morphology, optical characteristics, and SERS efficiency of high yield, synthesized stars as a function of size. We detail the modification of the protocol detailed by Liz Marzan et al.12, and further extend this procedure to simultaneously control star size, branch lengths and branching density, which translate to the tuning of the longer plasmon peak in the near infrared (NIR) region. A simple model describing the interrelation of several parameters that constitute the shape of a generic nanostar is proposed; based on this model, statistical studies of the various nanostar structures are performed to assess the reliability in controlling their morphology, as well as investigate any subtle parameter interdependences which may exist. The paper closes by the investigation and comparison of the SERS efficiencies of such star-shaped gold nanoparticles in solution for their potential use as SERS-substrates in detection applications.
2. Experimental
2.1. Preparation and Characterization of Gold Nanostars
All the chemicals in this research were of reagent grade. Chloroauric acid (HAuCl4.3H2O, 99%), Sodium Citrate (99%), poly-(vinylpyrrolidone) (PVP, MW = 10,000), Ethanol (99.8%), N,N-dimethylformamide (DMF, 99.8%), Sodium Sulfide (Na2S·9H20, 98%), p-MercaptoBenzoic Acid (p-MBA) were purchased from Sigma-Aldrich and used as received. Water used throughout the synthesis was Ultrapure DI (18.2 MΩ).
Gold nanostars were synthesized by the protocol presented by Liz-Marzan et al.. We further extended this protocol to enable size-control of the stars from approximately 45-nm to 116-nm in size, which translates to tuning capabilities of the longitudinal plasmon peak in the NIR region from around 725-nm to over 850-nm.
Briefly, 20-nm PVP-coated Au seeds in ethanol were prepared according to a modified version of the protocol by Graf et al.13, resulting in a colloidal suspension containing [Au] = 1.75mM. A 10 mM solution of PVP in 15mL DMF was prepared, into which 84 μL of an aqueous solution of 50 mM HAuCl4 were added. This solution is termed ‘growth solution’. This step was followed by the injection, under vigorous stirring, of Au seed volumes ranging from 45 μL to 700 μL, which yielded stars of 116-nm down to 45-nm, respectively. Within 15–30 minutes of synthesis, each solution experienced a three-color transition starting with pink, then colorless and finally purple/blue for small stars, around 15 min, to deep green for larger stars, past 25 min.
Gold nanostar growth as a function of time was investigated during an ongoing star synthesis, firstly, by analyzing the time-progression of the star’s absorption spectrum, and secondly, by imaging the star’s morphological changes over time, via TEM. The first procedure utilized fast spectral scan rates of approximately 45 seconds, enabling spectra to be taken in ‘real-time’ at 2-minute intervals throughout the entire synthesis. The second study required further postprocessing for the delicate preparation of TEM samples, and was therefore performed by successively extracting and quenching reaction mixture aliquots with sodium sulfide, where the sulfide acts as a scavenger for Au ions14.
Briefly, a 4.2 mM solution of Na2S in 15 mL DMF was prepared, followed by immersion in an ultrasonic cleaning bath for efficient dispersing. A rack of fifteen 10mL-glass test tubes was placed close to the reaction vessel, and into each test tube was pipetted 1-mL of the Na2S ‘quenching solution’. A star synthesis was initiated at t=0 min and, at 2-minute intervals, 1-mL reaction mixture aliquots were successively extracted, injected into the corresponding quenching solutions, which were gently mixed and rested for 1 minute prior to spectral analysis. Once sampling complete, the samples were washed 5 times with ethanol to remove excess PVP and DMF and imaged via TEM.
The gold nanostar samples were characterized by UV-Visible spectroscopy, transmission electron microscopy (TEM) and scanning electron microscopy (SEM). UV-Visible absorption spectra were measured using a Beckmann Coulter 530 spectrophotometer. TEM and SEM samples were prepared by drying ethanolic suspensions of the particles on carbon-formvar coated 300-mesh copper grids and copper tape, respectively. TEM images were acquired with a FEI Tecnai G2 Twin system operated at 160 kV and SEM images were obtained with a FEI XL30 SEM-FEG system at 29 kV. Particle dimensions were measured using the ImageJ15 software and the data shown in Table 1 are averages for 100 particles.
TABLE 1.
Average nanostar dimensions, estimated by measuring 100 particles imaged under TEM and SEM. Samples A–F correspond to images A–F in Figure 5.
| Star Sample | N | La (nm) | Lb (nm) | Dc (nm) | DS (nm) |
|---|---|---|---|---|---|
| A | 7 ± 1 | 12 ± 2 | 9 ± 2 | 27 ± 2 | 45 ± 4 |
| B | 7 ± 1 | 13 ± 3 | 10 ± 2 | 27 ± 2 | 52 ± 4 |
| C | 8 ± 1 | 15 ± 3 | 13 ± 2 | 31 ± 3 | 57 ± 5 |
| D | 10 ± 1 | 19 ± 4 | 13 ± 2 | 39 ± 3 | 72 ± 6 |
| E | 12 ± 1 | 22 ± 5 | 15 ± 2 | 46 ± 4 | 94 ± 9 |
| F | 14 ± 2 | 28 ± 7 | 15 ± 3 | 57 ± 5 | 116 ± 11 |
2.2. Preparation of SERS solutions
Nanostars are synthesized by the addition of pre-formed seeds into ‘growth solutions’, which enables calculation of their concentration by estimating the concentration of Au seeds added to the DMF growth solution. The concentration of citrate-capped Au seeds was estimated as 3.5×10¹¹ particles/mL, prior to PVP functionalization and re-suspension in ethanol (See Supporting Information). Varying volumes of the subsequently functionalized seeds were then added to the DMF growth solution to yield the final star solutions of different size and concentration. These solutions were centrifuged five times in ethanol to wash away excess PVP and DMF solvent.
Solutions containing a normalized surface-area of Au nanostars (2.560 m2/L) were then incubated with 20.0 μM p-MBA in ethanol and gently stirred overnight (~15 hours). Assuming a thiol molecular footprint of ~0.22-nm2,16,17 this p-MBA concentration would be just sufficient to ensure monolayer coverage.
The p-MBA-tagged nanostars were then washed three times with ethanol to remove displaced PVP and then transferred into a DI solution with EtOH 5% v/v. Small customized sample cells were prepared by affixing cover slips (0.17–0.18 mm thickness) onto 1.5 mL cleaved, plastic microcentrifuge tubes with epoxy (See Figure 1 in Supporting Information). Cleaving was achieved by horizontally slicing the tip of the tube with a utility knife, at the 100μL mark, forming an aperture of ~4mm in diameter. Epoxy was spread along the exposed wall-ends, and care was taken to ensure the aperture, through which sample detection would occur, was not compromised by excess epoxy. The cleaved tube was then vertically affixed, cleaved end and epoxy facing downwards, onto a cover slip and left to dry at room temperature for 24 hours. These customized cuvettes allowed for the use of higher NA objectives and prevented sample evaporation by capping with their original caps. A 50-μL volume of ample solution was then pipetted into these containers for Raman detection, and the solution pH was adjusted to approximately pH 10 by addition of 2-μL 10-mM aqueous NaOH. The cuvettes were positioned on the inverted microscope stage and the laser was focused 200 μm above the top surface of the cover slip to ensure identical sampling volumes. The Raman detection was performed using an inVia Renishaw Raman Microscope with a linearly-polarized 633-nm laser line, with a 20× 0.4NA Leica objective, 20 mW power and a 60-s acquisition time.
3. Results and Discussion
3.1. Nanoparticle characterization
For the reported synthesis, the size of nanostars was controlled by varying the concentration of Au seed suspended in the DMF growth solution. The higher the seed concentration, the lower the available Au atoms per seed and thus the smaller the resulting nanostar. Evidently, a negative correlation also exists between seed concentration and synthesis time: the higher the seed concentration, the thinner the deposition layer of Au atoms per seed and thus the shorter the time until depletion of Au atoms in the growth solution.
It is also hypothetically possible to control the star size by varying the HAuCl4 concentration in the growth solution, with a larger concentration of HAuCl4 yielding larger stars, but this pathway would require impractical PVP concentrations to maintain the large [Au]:[PVP] ratio required for the reduction of HAuCl4 and formation of the branches, as previously pointed out12. The latter method was explored as an alternative, but no further particle growth was observed when the concentration of HAuCl4 was increased whilst that of PVP was kept constant. Another possible route for controlling star size would be to inject Au seeds of varying sizes into the DMF growth solution, but this process requires the extra complication of synthesizing several seed batches and recalculating reagent concentrations to yield the desired star size.
TEM images of a typical batch of synthesized nanostars, extracted from samples originally injected with 45 μL and 135 μL of seed solution, are shown in Figure 1. The high-yield nature of the stars, as well as their complex morphology and homogeneous distribution, can be clearly interpreted.
Figure 1.

Typical TEM images of gold nanostars, synthesized via addition of 135 μL Au seed (main image) and 45 μL Au seed (inset). The inset is presented at this magnification to detail the star morphology for an enhanced perspective of their 3-dimensional structure.
In the ensuing analysis, a thorough investigation of the nanostar’s growth kinetics and final morphology is undertaken, by characterizing nanostar growth, for which the evolution of the star’s morphology is studied over the synthesis duration, and nanostar size, which involves the study of the nanostar’s final size as a function of added seed volume.
Star Growth Characterization
The growth mechanism of a nanostar has not been discussed extensively in the nanostar literature thus far. Nonetheless, such a study is important for elucidating nanostar growth kinetics after seed-injection, or ‘nucleation’, enabling a correlation between nanostructure and optical resonance, as well as for developing a simple geometrical model that would reliably represent the synthesized nanostar.
The nanostar synthesis was sampled at 2-minute intervals by treating reaction mixture aliquots with sodium sulfide. Sulfide ions have a strong affinity for heavy metals in their ionic and metallic states, and sulfide treatment has previously been demonstrated to successfully stabilize the long-plasmon drift of gold nanorods by immediately arresting nanorod growth14. For quenching the nanostar synthesis, a mole ratio of S to the total Au content of 4:1 was utilized, established as optimal in the nanorod growth arrest experiment14. Given the 30-minute synthesis duration, quenching and spectrally analyzing the reaction mixture at 2-minute intervals was deemed a compromise between excessive, uninformative spectral data and lack of time-resolution for capturing important spectral transitions. These superimposed spectra are presented in Figures 2A and 2B, for nanostars formed by injecting 135 μL and 540 μL Au seed, respectively. This ‘spectral’ growth study was performed on these two star sizes as a means of comparing the growth mechanism of both small and large nanostars.
Figure 2.
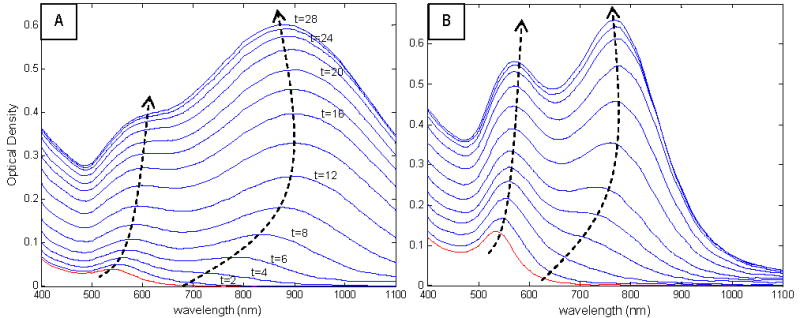
Nanostar growth spectral study for nanostars synthesized via injection of (A) 135 μL (B) 540 μL Au seed. Red curve represents spectrum of reaction mixture at t=0 min, and spectra are graphed at 2-min intervals until synthesis completion. Dotted arrows are loci of short and long plasmon band peaks as they evolve over time. The labeled time values are the times at which TEM imaging of the reaction mixture was performed.
Surface plasmons (SP), which involve collective oscillations of electrons confined to a metal/dielectric boundary such as a metal nanoparticle surface, can interact strongly with incident electromagnetic fields. The SP behavior is directly influenced by several parameters including nanoparticle structure, shape, size and material, all of which dictate the electron confinement by the metal. This ultimately affects the optical and SERS properties of the nanoparticle, which can be observed via its UV-Visible absorption and SERS spectra, respectively. In Figure 2, the star spectra exhibit a ‘short’ plasmon band in the mid-Visible region and a ‘long’ plasmon band, which appears following nucleation and evolves over time, in the NIR region. Interestingly, FDTD calculations on a nanostar have shown that the plasmons of such a particle result from hybridization of plasmons associated its core and individual tips18, and generate bonding and anti-bonding states of lower and higher energy levels compared to those of core and tips, respectively. Nevertheless, in order to simplify the interpretation of the growth mechanism, the short and long plasmon peaks are attributed to the plasmon modes associated with the inner core and branch tips, respectively.
The two dashed arrows on each graph represent the loci of the peaks of both the short and long plasmon bands, as the spectra evolve in time, and allow monitoring of the rate of change of the peak’s position: indeed, since the synthesis was sampled at regular intervals, the shallower the gradient between two consecutive spectra, the faster the shift in peak position. Additionally, the rate of change of the peak’s intensity can be monitored by evaluating the intensity difference between two consecutive spectra: the larger this difference, the faster the intensity increases. Considering Figure 2A, the short plasmon peak is observed to red-shift throughout the synthesis, with the greatest rate of change being between t=0 and t=8min. This suggests that the core grows the fastest during the initial stages of the synthesis and continues to grow steadily until synthesis completion, which occurs at approximately t=30 min, as judged spectrophotometrically. The long plasmon band starts appearing around λ=700-nm very early in the synthesis, at t=2min, and rapidly red-shifts to approximately λ=880-nm by t=10min, following which it slowly progresses further towards the NIR, reaching λ=900-nm at t=16 min. The long plasmon peak becomes dominant over the short plasmon at t=8 min. Interestingly, the long plasmon band then steadily blue-shifts back towards λ=850-nm as the synthesis terminates. These observations imply that the branches start growing from the core surface very shortly following nucleation, and lengthen rapidly in the first 10 min. The blue-shift would indicate that the branches, which are geometrically comparable to conical nanorods, decrease in ‘aspect ratio’ in the later stages of the synthesis, a phenomenon also observed during the growth of short nanorods19.
It is noteworthy that both core and branches simultaneously grow throughout the synthesis, with their fastest growth rate being at the synthesis initiation, followed by a steady growth until synthesis termination. Additionally, the above trends, analyzed for large nanostars, are also observed for smaller stars as depicted in Figure 2B, suggesting that the growth mechanism is independent of the star size (and therefore injected seed volume) and only one set of TEM images of a given star solution is sufficient for elucidating the growth mechanism of stars synthesized using this particular protocol.
Following spectral analysis, those samples which corresponded to spectra displaying critical changes were selected for TEM imaging. Since the greatest spectral changes appeared to occur at the beginning of the reaction, more emphasis was placed on imaging the initial samples. A total of ten samples of the large nanostars, corresponding to the time-labeled spectra in Figure 2A, were selected. These samples are chronologically ordered in Figure 3, and effectively depict the color changes that occur during nanostar synthesis. Their corresponding TEM images are also sequentially ordered in Figure 4 and confirm the observations made in the above spectral analysis of the growth mechanism: the nanostar core increases rapidly between t=0 and t=8 min, during which time surface protrusions, which appear at t=2 min, develop into distinct star branches by t=6 min. It is important to note that the appearance of protrusions at t=2 min and t=4 min correlates to the appearance of the long plasmon band at those same times, which suggests that simplifying the plasmon analysis by bypassing plasmon hybridization theory and attributing this plasmon band to the plasmon mode associated with star branches still yields a reliable analysis. Between t=8 min and synthesis termination, both the core and branches are observed to gradually grow, most likely by gold depositing onto branches while filling up the fractal spaces at the base of the branches, which leads to an increase in the core size, the number, length and width of branches. The blue-shift phenomenon is not obvious from the TEM images, which is expected since the spectral shift is small and rather gradual.
Figure 3.
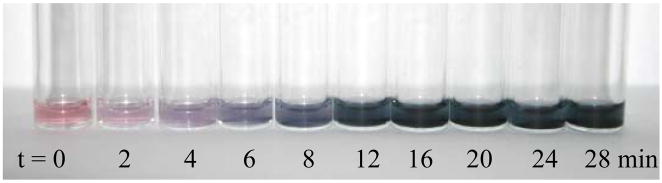
Photograph of quenched nanostar reaction mixture nanostar (synthesized by injection of 135 μL Au Seed), corresponding to the times labeled in Figure 2A.
Figure 4.
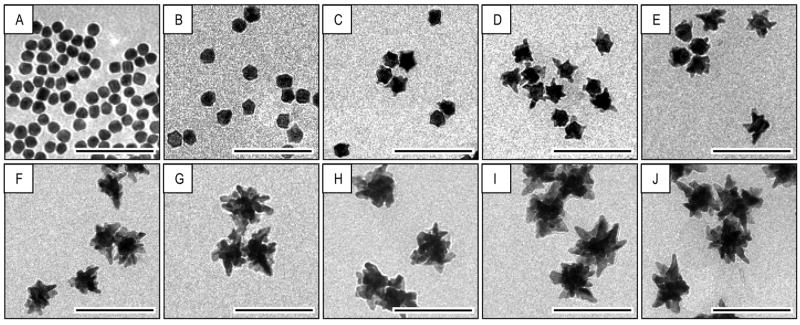
TEM images monitoring the nanostar evolution over time, and corresponding to the samples in Figure 3: (A) t=0-min (B) t=2-min (C) t=4-min (D) t=6-min (E) t=8-min (F) t=12-min (G) t=16-min (H) t=20-min (I) t=24-min (J) t= 28-min
Together, the spectral data and TEM images provide strong evidence with regards to the growth mechanism of nanostars. We propose that the nanostar growth mechanism can be divided into two stages: firstly, a rapid growth following nucleation, where gold begins depositing onto the seeds, increasing their diameter and forming shallow protrusions that emanate from their surface and develop into distinct branches; secondly, a gradual growth, whereby the continual deposition of gold serves to simultaneously grow the branches and fill up the fractal spaces at their base, which effectively further increases the star’s core diameter. As the core surface area increases, additional protrusions are able to form and develop into branches, which increase the star branch count. Synthesis termination occurs when the all the gold in solution is depleted.
It is noteworthy that attempting to halt the nanostar synthesis by simply centrifuging and diluting the reaction mixture aliquots, without sulfide-treatment, proved not to be effective: by the time the synthesis reached completion, the aliquots that were extracted and diluted at the initial stages of the reaction had already changed color from pinkish to deep blue, typifying nanostar formation. A likely explanation for this evolution is that the unreacted Au ions were not freely suspended in solution, but rather adsorbed onto the surfaces of the PVP, which co-precipitated with the nanostars upon centrifugation and redispersion, as observed for CTAB-stabilized nanorods14. In comparison, sulfide treatment immediately arrested the nanostar synthesis at the desired point in time, and the solution remained stable for days.
Star Size Characterization
Size characterization involved the study of final nanostar size as a function of added seed volume. Nanoparticle sizing was performed using TEM images such as those in Figure 5, which also highlights the controllability of the protocol for synthesizing stars of desired size. TEM was chosen over SEM for its enhanced resolution and visualization clarity, especially when dealing with nanostars capped with a non-conductive PVP-layer that prevents the capturing of well-resolved SEM images; nevertheless, SEM images are included as insets in Figure 5 for a three-dimensional (3D) perspective of the nanoparticles.
Figure 5.

Transmission and scanning (insets) electron microscopy images of the nanostars in order of increasing size (A–F). Their synthesis in high-yield is evident. The samples A–F were synthesized by addition of the following volumes of Au seed: (A) 700 μL, (B) 540 μL, (C) 400 μL, (D) 270 μL, (E) 135 μL, (F) 45 μL. Scale bars correspond to 200-nm for main panels and 100-nm for insets and the TEM or SEM images are acquired at the same magnification.
For more accurate size characterization, as well as for SERS analysis purposes, a 3D nanostar model is proposed in Figure 6, where a nanostar of overall size DS is interpreted as a spherical core of diameter DC, from which originates a number, N, of round-end cone ‘branches’. Here, the core is measured as the central sphere on top of which shallow protrusions (surface roughness) and branches are formed. The branch-length threshold, Lthresh, quantifies the surface roughness thickness above which protrusions are considered branches, and subsequent to TEM analysis, was established as ~7-nm for modeling purposes; as such, a branch is defined as any well-formed protrusion that is more elevated (>Lthresh) than the underlying surface roughness at its base. It is governed by the parameters of branch base Lb, branch length La and a ~3-nm radius of curvature at the branch tip. The model’s dimensions for samples A–F are estimated in Table 1.
Figure 6.
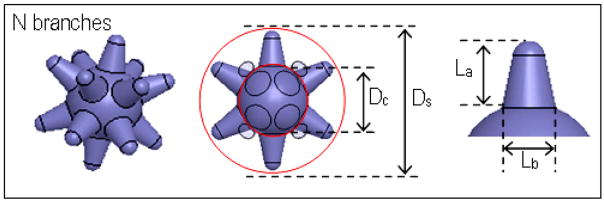
Nanostar model schematic
These 5 parameter definitions were set up to enable fair nanostar modeling across all sizes and were derived with the previously analyzed nanostar growth under consideration: branches begin their growth by the localized deposition of gold atoms, which is controlled by the reduction kinetics of PVP. At the initial growth stages, the growth kinetics are such that small, scattered protrusions would form relatively uniformly on the gold seed surface, at which point they would be considered part of the surface roughness and not as branches per say. It is only when some protrusions start preferentially outgrowing the others (along various crystal facets) as a result of continued metal deposition that the formation of well-formed branches occurs.
The ensuing analysis refers to Figure 7 and the statistics of Table 1 to provide a comprehensive understanding of the trends of these two plasmon bands, as the star size increases. As aforementioned in the nanostar growth investigation, although plasmon hybridization has been shown to occur between nanostar core and branch plasmons, the short and long plasmon peaks in Figure 7 are attributed, for simplification purposes, to the plasmon modes associated with the inner core and branch tips, respectively.
Figure 7.
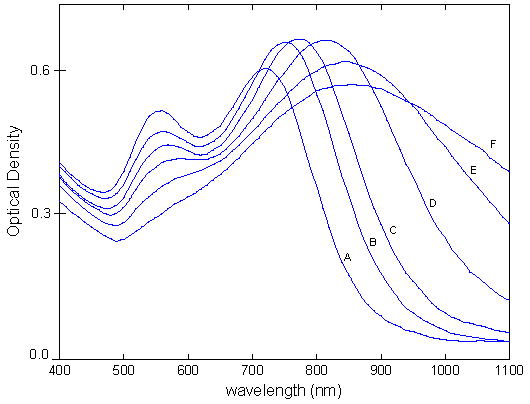
Absorption spectra of as-synthesized nanostars of increasing size from A to F, corresponding to samples (A–F) in Table 1.
It is also noteworthy that Figure 7 conveys the spectra of the as-synthesized, non-normalized star solutions, purposefully done to provide transparency to the nanostar synthesis. Since samples A–F are synthesized by injecting different volumes of Au seed, their final concentrations are all different and directly proportional to the volume of added seed. This implies that intensity comparisons across samples A–F are meaningless and not deemed of great importance. The positions and widths of the short and long plasmon peaks across samples, however, are comparable and of critical importance. The relative intensities, or intensity ratio, of the two peaks within a sample is also an important quantity whose trend is also depicted here. The nanostar solution color transitions as a function of size, depicted in Figure 8, may also be inferred from their corresponding spectra.
Figure 8.

Photograph of PVP-functionalized seed and as-synthesized nanostar dispersions in DMF of samples A–F, corresponding to curves A–F in Figure 7. Samples were illuminated from the left for better color identification.
As the star size increases from samples A to F, the short plasmon band centered around 550-nm, usually assigned to the plasmon band of spherical particles, becomes increasingly red-shifted as the spherical core diameter increases in size from 27 to 57-nm. At the same time, the long plasmon band, associated with the rod-like star branches, also undergoes red-shifting due to lengthening branches as well as an overall increase in star size.
The long plasmon band experiences an important broadening as the nanostars increase in size, which is a result of the increasingly inhomogeneous distributions of either particle sizes and/or shapes, which may both result in overall spectral broadening. Similarly to how size heterogeneity yields broad plasmons by the spectral superposition of plasmons associated with the different sized particles, shape heterogeneity could also result in broad plasmons by the spectral superposition of plasmons associated with the differently shaped particles. Interestingly, Table 1 reveals that the overall size distribution of the stars remains homogeneous from samples A to F, reflected by the standard deviations of Ds not exceeding 10% (generally accepted as the threshold for homogeneity). Additionally, the same observation is made for the core size, Dc. This statistical evidence implies that the extreme broadening of the long plasmon band originates from the increasingly inhomogeneous distributions of star shapes: since the distributions of both Dc and Ds remain homogeneous, the shape heterogeneity must originate from the increasing randomness of the star branch morphology, which comprises branch dimensional parameters, packing density and orientation. This hypothesis is further emphasized when analyzing parameters La and Lb in Table 1. Indeed, the parameters La and Lb both convey an increase in average length from A to F, but more importantly La shows a significant increase in its standard deviation, which translates to a larger distribution of branch lengths. As such, the branch length distribution becomes increasingly heterogeneous with increasing star size. The above analysis of the distributions of La, Dc and Ds as a function of increasing star size, proposes that the stars in a particular sample solution have similar average size (homogeneous Ds) but varying degrees of randomness in their branch morphology (heterogeneous La). As star size increases from A to F, the branch morphology, and subsequently nanostar shape, both become increasingly random, translating to the observed broadening of the long plasmon band. Finally, it is noteworthy that this broadening could also be due to increase plasmon hybridization between the core and branches, as the overall star size increases from samples A to F. The complexity of the nanostar morphology makes a simple plasmon analysis using the hybridization method virtually impossible18 and will not be attempted in this investigation.
On the other hand, the short plasmon band, associated with the star core, is well defined for sample A, but slowly becomes engulfed by the overwhelming intensity and width of the long plasmon band, from A to F. As such, these spectra alone do not provide sufficient information to infer any dependence between increasing star size and short plasmon band behavior; nevertheless, by reverting to Table 1, it can be concluded that the core diameter Dc maintains distribution uniformity from samples A to F, which is indicated by the Dc having a standard deviation inferior to 10%. The consistency of the standard deviations suggests that the short plasmon band width is likely unaffected by the increasing heterogeneous distributions of branch lengths, as star size increases. As such, the short plasmon band is not expected to broaden significantly, as in the case of the long plasmon band, and specifically not as a result of increasing star shape heterogeneity. Rather, the short plasmon band experiences slight broadening as Dc increases with increasing star size Ds. Again, it should be emphasized that the above analysis was simplified by ignoring the effects of plasmon band hybridization, which could introduce unaccounted contributions towards plasmon broadening and/or shifting; nevertheless, the general trends discussed should still be valid.
Finally, the decreasing relative intensities of the short to long plasmon peaks is a similar trend observed when increasing the aspect ratio of gold nanorods20, and is attributed to the increasing branch length and AR from A to F, a trend also demonstrated by Nordlander’s FDTD calculations. The increasing branch AR is analogous to increasing nanorod AR, and results in stronger confinement of plasmon oscillations at the tips. This translates to an increasingly intense longitudinal plasmon band.
While Table 1 depicts numerical entities from which general trends may be understood, further insight can be obtained by studying these parameters from a purely graphical standpoint.
Figure 9 conveys a graphical representation of interdependences between parameters in Table 1. A pair of parameters, (X, Y), are plotted as clusters of data points in 2D space. Each cluster represents data points from one sample, and therefore each presented graph comprises all samples, for an elegant visual comparison. It is noteworthy that for each sample A to F, only 30 randomly chosen data points per parameter (out of total of 100) are shown for clarity, but the parameter averages and standard deviations, Xaverage & Yaverage and Xstd & Ystd, respectively, are extracted from Table 1. The graphs were thus plotted from a data cube of dimensions 6×5×30 (Sample, Parameter, Data point). For each sample A to F, the drawn ellipses are centered at the point (Xaverage, Yaverage), join the 4 standard deviation boundaries (Xaverage±Xstd, Yaverage±Ystd), and represent the standard deviation locus in 2D parameter space. The width of the ellipse along each axis determines the variability of that specific parameter, from sample to sample; the greater the width, the more heterogeneous the parameter along that specific axis. As the parameter becomes increasingly homogeneous, the corresponding ellipse width would decrease until it collapses into an infinitesimal point, in the ideal case, at which point the parameter would be statistically constant. It is critical to note that, since the plotted parameters are not normalized with respect to each other, visual comparisons and deductions based on the ellipse characteristics (axes length and eccentricity) for a single, isolated sample are meaningless; rather, reliable intuition can be inferred from comparing ellipse transitions across the samples in a particular graph.
Figure 9.

Cluster graphs of star parameter interdependences for samples A to F, complemented with the estimations included in Table 1. The graphs represent the following: (a) Core diameter against overall star size (Dc vs. Ds), (b) Branch length against overall star size (La vs. Dc), (c) Branch length against branch-base width (La vs. Lb), (d) Number of branches against overall star size, (e) Overall star size against injected seed volume. Ellipses map the standard deviation loci in 2D parameter space. Solid lines represent lines of best fit through the ellipse centers, and dashed-lines represent line of best fit extrapolations.
The cluster plots depict parameter dependencies on two different scales: intra-sample parameter dependencies within the same sample of stars, and inter-sample parameter dependencies across samples of varying-sized stars. Evaluating the parameter cross-correlations in Figures 9a–d yielded a relatively low value of ±0.1, suggesting negligible intra-sample parameter dependence. This negligible dependence enables non-oblique ellipses to be used for the representation of variance loci.
The lines of best fit in each graph are fitted through the ellipse centers for the sole purpose of qualitative evaluation of inter-sample parameter trends; as such, they should not be considered quantitative evidence of the trends they suggest. Figure 9 (a, b, d, e) were established using a least-squares algorithm, whereas the disposition of ellipses in 4c lead to a gentle curving of the line of best fit. For the purpose of analysis simplification, the injected seed solution is assumed ideally monodisperse with a size of 20-nm, which, given their actual size distribution of 20.1±1.6 nm (See Figures 2 and 3 in Supporting Information), is a fair assumption.
Figure 9a displays the relationship between star core and overall size, whose line of best fit is remarkably linear throughout. Their relative distributions remain narrow with increasing size, as indicated by uniformly growing ellipses of similar eccentricity. Extrapolating the line of best fit down to the minimum value Dc=20-nm hypothetically suggests a minimum overall size Ds ≈ 34-nm. Under ideal conditions of infinitesimal star growth, the minimum star size, min(Ds), should equal the minimum core size, min(Dc), which is in turn defined by the 20-nm size of the injected gold seed; this should entail a line of best fit through the origin (20,20). Nevertheless, the 14-nm offset along the Ds-axis shows consistency with the proposed nanostar model, since the employed ‘branch’ and ‘core’ definitions imply an unaccounted surface roughness ‘shell’, of maximum thickness Lthresh, surrounding the whole core and contributing to Ds, when both of these are at their minimum. In other words, min(Ds) = min(Dc) + 2×Lthresh.
Figure 9b clearly conveys that as overall size Ds increases, so does branch length La. While the overall size remains quite homogenous, indicated by narrow ellipses from sample A to F, the branch length becomes more heterogeneous, depicted by increasingly elongated ellipses (increasing eccentricity). On a more subtle note, it appears that the ellipsoid centers are positioned along a line of best fit that is mostly linear, except at Ds=34-nm, where a singularity is forced. This interesting result suggests proportionality between La and Ds for the synthesized nanostars A–F. The singularity was introduced to validate the model’s consistency with other parameters: as such, simultaneous comparison between 4a and 4b depict that branching below Lthresh has no contribution towards the overall star size. Branching only starts contributing as the branch length exceeds the surrounding surface roughness. A value of La ≈ Lthresh when Ds=34-nm also shows consistency with the star model used for measurement purposes.
Figure 9c demonstrates the correlation between La and Lb, for which there is significantly more scattering of the data points. For consistency with the well-established nanorod literature and terminology, the quantity La/Lb may be defined as the branch ‘aspect ratio’, AR, although it should be noted that the branches are conical in shape, rather than cylindrical, as implied by the original term describing the nanorods. Interestingly, the curve represents the locus of points (Lb, La), whose gradient conveys the local rate of change of branch AR with dimension Lb, and tends to zero as the curve approaches the horizontal asymptote at a value La of approximately 7-nm, attributed to Lthresh. The graph depicts more heterogeneous branching accompanied by a sharpening of the star branches with increasing branch length.
Figure 9d shows the trend between seed volume and overall star size. Only the averages and standard deviation loci are plotted here, for clarity. The linear line of best fit extrapolates towards a threshold N=5, as Ds tends to its predetermined minimum size of 34-nm. Finally, Figure 9e is plotted to calibrate the resulting star size as a function of injected seed volume. The inversely proportional relationship is expected since the overall star size should decrease as the total seed surface area (SA) available for gold deposition increases. The singularity at Vseed=0μL was introduced to ensure consistency with the idea that star growth does not occur in the absence of added seed.
3.2. SERS Spectra and Enhancement Factors
A fair comparison between particles of different morphology is only achievable if the number of sampled analyte molecules is kept constant between the particle shapes. The nanostars are synthesized with a thick coating of long PVP chains (MW 10,000), which prevents any dye from accessing the highest enhancement regions on the gold surface. PVP is an organic polymer, whose polyvinyl skeleton serves as a hydrophobic tail group, and its polar pyrrolidone group serves as a hydrophilic head group, giving PVP an amphiphilic feature.21 The head groups interact with Au or Ag particle surfaces via physisorption, whereas the tail groups provide a physical barrier that prevents particle aggregation. The nanostars comprise the same protective sheath which helps them remain in suspension in organic solvents such as DMF and ethanol. When incubated with a dye that comprises a thiol group (SH), such as p-MBA, the very strong affinity of the thiol for the gold surface triggers a ligand-exchange process.22 The thiol ends of p-MBA bond to the gold surface via chemisorption that is generated from the redox reaction:
| (1) |
As such, the physically adsorbed nucleophilic groups of PVP are replaced by the thiol group of p-MBA, bringing the latter within close proximity of the enhanced E-fields.
Although this protocol generates stars in very high yield, the complex nanostar geometry makes estimation of the p-MBA surface coverage significantly more challenging than for particles with a defined symmetry. Table 1 enabled the estimation of average surface areas of 3.7, 3.9, 5.4, 9.0, 12.9 and 20.0 ×10³ nm2 for a generic nanostar in samples A–F, respectively, from which it was possible to keep the concentration of analyte molecules fixed across all star sizes.
It is noteworthy that due to the star’s outward radiating branches and sub-wavelength size (evidently depicted by the star TEMs in Figure 5 and model in Figure 6) and the linear polarization of the incident laser excitation, not all branches can be aligned with the E-field’s direction of polarization at any one instant in time; indeed, the local surface plasmons (LSPs) oscillating in the direction of the branch and confined at the tips would mainly be excited by components of the incident E-field in the same direction. It is therefore anticipated that the tips would exhibit varying enhancements for any given excitation snapshot, even for the ideally symmetric model shown in Figure 6. For SERS measurements in aqueous solutions, however, nanostars are randomly oriented and as such, the SERS intensities would be representative of all the possible nanostar branch orientations in the probed volume averaged over the acquisition period. This effectively removes any polarization-dependence of the SERS measurements and further increases comparison fairness across star sizes.
Valid comparisons also necessitate minimal particle aggregation, which leads to the localized formation of extremely high E-field enhancements as a result of plasmon coupling effects, or “hotspots”.23 The randomness of particle aggregation is the reason these SERS experiments were done in aqueous solutions under dilute conditions. Nevertheless, even in solution, particles may still aggregate depending on their surface chemistry as well as the ionic strength of the solvent. Self-Assembled Monolayers (SAMs) of p-MBA prepared via incubation in pure ethanol have been shown to form multilayers owing to the formation of hydrogen bonds between the carboxyl head groups of the p-MBA molecules.24 Acetic acid25 and trifluoroacetic acid26 have been used by several authors as a substitute reagent for hydrogen bonding, but these experiments were successful for synthesizing p-MBA SAMs on gold substrates, not on nanoparticles in solution. The addition of trace amounts of acetic acid to the synthesized nanostar solutions resulted in aggregation most probably due to neutralization of the charge shielding surrounding the particles. Even if successful, this procedure, involving the injection of new reagents to undergo sacrificial H-bonding, would result in additional Raman peaks pertaining to their intrinsic vibrations; more importantly, if possessing similar bonds to those in the dye of interest, unwanted contributions to extant Raman peaks could deceptively increase the SERS spectra intensities, which would invalidate any attempted comparison. This method also lacks simple, real-time calibration capabilities to indicate whether, and how much, H-bonding between p-MBA and acetic acid molecules has successfully taken place. As a more effective alternative, aggregation was prevented, post-incubation with p-MBA, by adjusting the solution to basic conditions of pH ~10 which deprotonates the COOH head groups of the chemisorbed p-MBA, yielding a negative, repelling surface charge on each nanostar.27–29 A pH of 10 was chosen as a compromise to ensure sufficient COOH deprotonation while maintaining an ionic strength low enough to keep the particles in suspension. Typical SERS spectra of the p-MBA-nanostar system are shown in Figure 10, before and after pH adjustment.
Figure 10.

SERS spectra of sample B prior (a) and post (b) injection of 2 μL 10-mM NaOH, which increases solution pH to 10 and modifies the peaks at 1415 cm−1 and 1710 cm−1. The 1590 cm−1 peak also experiences a decrease with increasing pH. The schematics depict the conformation of the p-MBA molecule in both states and the peaks to which they are associated.
The deprotonation was verified by the disappearance of the 1710-cm−1 peak and intensity increase of the 1415-cm−1 peak in the nanostar Raman spectra in Figure 10, corresponding to the C=O stretching vibrations ν(C=O) of non-dissociated COOH groups, and νs(COO−), respectively.30 Interestingly, an intensity decrease of around 5–10% was observed in the Raman spectra following addition of NaOH, suggesting a possible minor contribution to the detected intensity from E-field enhancements induced by interparticle E-field coupling in the original solution.
This intensity decrease may also be in part to slight sample dilution, but this effect was observed not to be the controlling factor in this case (See Figure 4 in Supporting Information). It should be noted that the νs(COO−) vibrations at 1415 cm−1 in this study is slightly lower than previously reported values29,30 of 1430 cm−1 and 1423 cm−1, but is nevertheless reasonable considering the different experimental conditions. Shifts of Raman peaks are usually associated with variations in local environments surrounding the probed molecules, such as substrate material, surface chemistry (capping/protective agents) and solvent; these ultimately alter the local dielectric constant, as well as any substrate-adsorbate chemical interactions which may exist, and lead to shifts in Raman peaks. Similarly, the same argument can be used to explain the observed shift of the same band from 1415 cm−1 to 1384 cm−1 for the normal Raman spectrum.
The two strong bands at about 1590 and 1080 cm−1 are assigned to ν8a and ν12 aromatic ring vibrations, respectively.30 The SERS efficiencies of all star sizes were investigated and their spectra are displayed in Figure 11. The slight right shift of the 1080-cm−1 peak to a higher wavenumber in the normal p-MBA Raman spectrum is also in accordance with that observed under similar conditions by the same authors.
Figure 11.

The surface-enhanced Raman scattering (SERS) spectra of nanostars in an aqueous solution with 5% EtOH v/v at pH 10, for samples A–F. The last spectrum is the ordinary Raman spectrum of 0.1M p-MBA in 1M aqueous NaOH, for reference.
The SERS spectra convey limited correlation between intensity and star size, which, considering the fact that star morphology also varies with increasing star size, implies a more complicated relationship between the two.
The decreasing overlap of the leading edge of the longitudinal plasmon band and the 633-nm excitation source, as star size increases, would hypothetically also be accompanied by an observable decrease in intensity; however, this feature was not observed.
Given the star morphology, the local field enhancement is expected to be inhomogeneous on the particle surface, with greater enhancements occurring in close proximity of sharp edges or corner.31 As such, the branch tips should boast significantly higher plasmonic enhancement intensities than on the flatter parts of the core surface12. Assuming a branch tip radius of curvature of ~3-nm, the branch AR generally increases with increasing star size, from 1.3 to 1.9, but no relationship to intensity may be inferred from this trend since other parameters (N, Dc and Ds) also increase simultaneously. If these other parameters were constant, however, it would be reasonable to expect intensity to generally increase with branch AR.
Another possible factor for variations in intensity among stars of different sizes is the ratio of the number of p-MBA molecules adsorbed to the branch tips to the total number of p-MBA molecules adsorbed to the star; the larger this fraction, the greater the anticipated intensity since more molecules would be located in the stronger field-enhanced region. Assuming a similar packing density of p-MBA molecules on the tip as everywhere else on the star, this ratio was estimated as 0.11 down to 0.039 for samples A–F, respectively. Again, the intensities of the SERS spectra indicate otherwise, which is to be expected considering this parameter is one of several variables affecting the overall detected intensity.
For the stars described here, the strongest substrate (i.e. that which exhibits the most intense SERS signal) is sample B, stars of 52-nm in size, and the weakest is sample A, stars of 45-nm, with a peak intensity difference of approximately 2.5× between the two.
The surface enhancement factors of the stars were estimated by considering the ν8a Raman band, since it is the strongest and shift-free peak of all bands in the spectra. The surface enhancement factor (EF) can be defined as
| (2) |
where ISERS and IBulk are intensities of the same band in the SERS and bulk spectra, NSERS is the number of adsorbed molecules sampled on the SERS-active substrate, NBulk is the number of molecules sampled in the bulk. The IBulk was determined from the normal Raman spectrum, which was measured by preparing p-MBA in a strong basic solvent (serving the purpose of dissolution) and keeping the ethanol concentration identical to the star solutions minimal shifts of, and fair comparisons between, peak intensities. The intense, shifted band at 1384 cm-1, corresponding to ν(C=O), reflects the saturated pH of the solution. However, since this band is independent of ν8a in that this particle-less solution is immune to aggregation or precipitation as a result of extremely low or high pH, respectively, direct comparison to ν8a in samples A–F is still possible.
The sampled volume was estimated by noting that the objective is characterized by a 5.8-μm depth of field, and produces a measured 633-nm laser spot size of approximately 3.2 μm in diameter. This yields a sampled volume of about 4.7×10⁻¹¹ mL, although any marginal error associated with this calculation does not affect the final EF since the experimental setup was identical for all measurements (implying the probed volume cancels out in equation (2)). With the particle SA fixed at 2.650 m2/L across star samples, assuming p-MBA monolayer coverage and a thiol footprint of 0.22-nm2, NSERS was estimated as 5.62×10⁵ in the probed volume. The 0.1-M p-MBA solution comprises 2.81×10⁹ analyte molecules in the same probed volume. The ISERS and IBulk values were extracted from the measured spectra in Fig 4 using the Wire 2.0 software provided in the Renishaw microscope. Table 2 summarizes the EF approximations for the 6 star samples A–F.
TABLE 2.
Enhancement factors for the ν8a vibrational mode of p-MBA on different star samples, using a 633-nm laser line
| Star Sample | Diameter (nm) | Enhancement Factor |
|---|---|---|
| A | 45 | 2.02 E+03 |
| B | 52 | 5.00 E+03 |
| C | 57 | 3.69 E+03 |
| D | 72 | 2.86 E+03 |
| E | 94 | 3.27 E+03 |
| F | 116 | 3.63 E+03 |
The enhancement factors were found to range from a minimum of 2.02×10³ to 5.00×10³ for star sizes 45 and 52-nm, respectively. It should be noted that the assumed complete monolayer coverage of the adsorbate, p-MBA, on the stars is the theoretical maximum calculated under ideal conditions. Experimentally, the structure of the resulting SAM and rate of formation is based on several critical factors32 such as adsorbate purity and molecular structure, adsorbate incubation time and concentration, nanostar surface cleanliness, nanostar surface radius of curvature, non-specific binding (H-bonding), all of which would increase the effective thiol molecular footprint of p-MBA from the ideal 0.22-nm2. This suggests that the EF values in Table 2 are surely underestimates.
The proposed simplistic star model, designed to estimate star SA was consistently used across all star sizes, which implies a fair qualitative EF comparison among them. A quantitative EF comparison with other shapes in the literature, however, is insignificant due to the large intrinsic error associated with this model in particular. Stars have a complex morphology that varies with size, and whose description is attempted with the aid of five interdependent parameters, or Degrees of Freedom, in Table 1. Evidently, increasing degrees of freedom in a model lead to greater potential inaccuracies. Specifically, the likelihood of, and errors associated with, under or over estimates in the p-MBA coverage are significantly higher: if the SA is overestimated, the concentration of added p-MBA would result in an excess of p-MBA molecules, NSERS, which would be removed from the sample solution via washing post-incubation. The effective NSERS would be lower than that used in the EF calculation, leading to an underestimated EF. If, on the other hand, the SA is underestimated, the added p-MBA would be insufficient to ensure complete monolayer coverage. This would result in detected SERS intensities that are lower than the nanostar’s true enhancing potential. Again, the EF would be underestimated. Adding an excess p-MBA could improve the problem of underestimating the star SA, but this would introduce further variables into the nanoparticle-adsorbate system, such as uncontrolled non-specific H-bonding. Furthermore, this would not resolve inaccuracies originating from the model’s simplicity. As such, quantitative EF estimates are extremely hard to attain.
It is important to note that the reported values are for isolated particles in solution, and care has been taken to prevent aggregation leading to hotspots, so that they are significantly lower than for particles where aggregation is promoted.
Furthermore, greatest SERS enhancements are expected to occur when the spectral overlap between the incident wavelength and the absorption peaks, representative of the wavelengths at which LSPs are excited, is maximized. However, since SERS intensity is also proportional to 1/λ4 33, a compromise exists between red-shifting the incident wavelength to maximize spectral overlap and ensuring minimal negative contributions originating from the 1/λ4 factor. With reference to Figure 7, the use of a 633-nm laser excitation source, which was available in our laboratory, does not maximize the overlap with the SP bands (or absorption bands) of any sample, which implies that the EF can be further increased by shifting the excitation source to a wavelength of 780–820 nm, where the overlap is nearly twice as large in some cases. The 1/λ4 factor should not play a critical role for such a red-shift, with a ~3× decrease from 6.22E-12 nm−4 to 2.21E-12 nm−4 for λ=633-nm and λ=820-nm respectively.
It is noteworthy that although each nanostar comprises several branches, with the greatest E-field enhancement in the vicinity of their tips, the detected SERS is effectively a spatial average of all the E-field interactions occurring over the surface of the particles, integrated over the acquisition period (this is assuming no coupling interaction between particles, since solutions were dilute and particle surface were repelling). As aforementioned, the branch tip to total SA was estimated as being inferior to 10%, in the best case scenario (sample A). This implies that at least 90% of the remaining p-MBA molecules are adsorbed on the sides of the branches or on the central core surface, where the E-field enhancement is significantly lower. This weighted spatial average would effectively hamper the overall EF, providing insight into the reported range of EF values. Incidentally, if normalization was effectuated with respect to particles per unit volume, rather than to area per unit volume, the EF values are anticipated to be significantly higher since each nanostar comprises several branch tips.
The reported SERS experiments were performed to enable a more accurate, qualitative comparison between different star sizes, with the intention of determining that which provides the best SERS efficiency.
The nanostar E-field enhancement, and thus SERS efficiency, appears to originate from an intricate interplay of star size, spectral overlap between surface plasmon peaks and excitation source, excitation wavelength, the number of branches (i.e., proportion of branch tip to total SA), branch AR, branch length and general star morphology..
4. Conclusion
The synthesis of high-yield gold nanostars of varying sizes, the growth mechanism, their physical modeling, optical response and use as SERS substrates are reported for the first time. The results indicated that it is possible to vary the size and morphology of the nanostar structures in a controlled fashion, by carefully adjusting the volume of preformed Au seed added to the growth solution.
Detailed statistical analysis of the synthesized samples, based on TEM and SEM measurements, was performed and unraveled unique parameter interdependences across samples, even though intra-sample analysis revealed little correlation. The homogeneously-sized star samples conveyed interesting absorption spectra comprising a short and long plasmon band, with the latter becoming increasingly broad and red-shifted with enlarging nanostar, indicating a heterogeneous distribution of morphologies within a given sample.
Solution-based SERS measurements were performed using the Raman-active dye p-MBA, demonstrating the use of this new nanostructure as a useful SERS-active substrate.
Acknowledgments
This work was sponsored by the National Institute of Health (Grant R01 EB006201). The authors gratefully thank Jimi Wen from Imperial College, London, for insightful discussions on statistical modeling.
Footnotes
Supporting Information Available
Seed concentration calculations, seed transmission electron micrographs, size distribution of gold seeds and extra SERS spectra. This information is available free of charge via the Internet at http://pubs.acs.org.
References
- 1.Kneipp K, Kneipp H, Itzkan I, Dasari RR, Feld M. J Phys Condens Matter. 2002;14:R597. [Google Scholar]
- 2.Nie S, Emory SR. Science. 1997;275:1102. doi: 10.1126/science.275.5303.1102. [DOI] [PubMed] [Google Scholar]
- 3.Campion A, Kambhampati P. Chem Soc Rev. 1998;27:241. [Google Scholar]
- 4.Vo-Dinh T, Hiromoto MYK, Begun GM, Moody RL. Anal Chem. 1984;56:1667. [Google Scholar]
- 5.Vo-Dinh T. Trends in Anal Chem. 1998;17:557. [Google Scholar]
- 6.Vo-Dinh T. IEEE J Selected Topics in Quantum Electronics. 2008;14:1989. doi: 10.1109/JSTQE.2007.914738. [DOI] [PMC free article] [PubMed] [Google Scholar]
- 7.Tang XL, Jiang P, Ge GL, Tsuji M, Xie SS, Guo YJ. Langmuir. 2008;24:1763. doi: 10.1021/la703495s. [DOI] [PubMed] [Google Scholar]
- 8.Orendorff CJ, Gearheart L, Jana NR, Murphy CJ. Phys Chem Chem Phys. 2006;8:165. doi: 10.1039/b512573a. [DOI] [PubMed] [Google Scholar]
- 9.McLellan JM, Siekkinen A, Chen J, Xia Y. Chem Phys Lett. 2006;427:122. doi: 10.1016/j.cplett.2006.10.095. [DOI] [PMC free article] [PubMed] [Google Scholar]
- 10.Driskell JD, Lipert RJ, Porter MD. J Phys Chem B. 2006;110:17444. doi: 10.1021/jp0636930. [DOI] [PubMed] [Google Scholar]
- 11.Nehl CL, Liao H, Hafner JH. Nano Letters. 2006;6(4):683. doi: 10.1021/nl052409y. [DOI] [PubMed] [Google Scholar]
- 12.Senthil Kumar P, Pastoriza-Santos I, Rodriguez-Gonzalez B, Garcia de Abajo FJ, Liz-Marzan LM. Nanotechnology. 2008;19:015606. doi: 10.1088/0957-4484/19/01/015606. [DOI] [PubMed] [Google Scholar]
- 13.Graf C, Vossen JDL, Imhof A, van Blaaderen A. Langmuir. 2003;19:6693. [Google Scholar]
- 14.Zweifel DA, Wei A. Chem Mater. 2005;17:4256. doi: 10.1021/cm0506858. [DOI] [PMC free article] [PubMed] [Google Scholar]
- 15.Abramoff MD, Magelhaes PJ, Ram SJ. Biophotonics Int. 2004;11:36. [Google Scholar]
- 16.Dubois LH. Annu Rev Phys Chem. 1992;43:437. [Google Scholar]
- 17.Sellers H, Ulman A, Schnidman Y, Eilers JE. J Am Chem Soc. 1993;115:9389. [Google Scholar]
- 18.Hao F, Nehl CL, Hafner JH, Nordlander P. Nano Letters. 2007;7(3):729. doi: 10.1021/nl062969c. [DOI] [PubMed] [Google Scholar]
- 19.Sau TK, Murphy CJ. Langmuir. 2004;20:6415. doi: 10.1021/la049463z. [DOI] [PubMed] [Google Scholar]
- 20.Nikoobakht B, El-Sayed MA. Chem Mater. 2003;15:1957. [Google Scholar]
- 21.Zhang Z, Zhao B, Hu L. J Solid State Chem. 1996;121:105. [Google Scholar]
- 22.Carotenuto G, Nicolais L. Composites: Part B. 2004;35:385. [Google Scholar]
- 23.Moskovits M, Jeong DH. Chem Phys Lett. 2004;397:91. [Google Scholar]
- 24.Nuzzo RG, Dubois LH, Allara DL. J Am Chem Soc. 1990;112:558. [Google Scholar]
- 25.Rosendahl SM, Burgess IJ. Electrochim Acta. 2007 [Google Scholar]
- 26.Wang H, Chen S, Li L, Jiang S. Langmuir. 2005;21:2633. doi: 10.1021/la046810w. [DOI] [PubMed] [Google Scholar]
- 27.Shiraishi Y, Arakawa D, Toshima N. Eur Phys J E. 2002;8:377. doi: 10.1140/epje/i2000-10103-4. [DOI] [PubMed] [Google Scholar]
- 28.Talley CE, Jusinski L, Hollars CW, Lane SM, Huser T. Anal Chem. 2004;76:7064. doi: 10.1021/ac049093j. [DOI] [PubMed] [Google Scholar]
- 29.Bishnoi SW, Rozell CJ, Levin CS, Gheith MK, Johnson BR, Johnson DH, Halas NJ. Nano Letters. 2006;6(8):1687. doi: 10.1021/nl060865w. [DOI] [PubMed] [Google Scholar]
- 30.Michota A, Bukowska J. J Raman Spectrosc. 2003;34:21. [Google Scholar]
- 31.Lance Kelly K, Coronado E, Zhao LL, Schatz GC. J Phys Chem B. 2003;107:668. [Google Scholar]
- 32.Christopher Love J, Estroff LA, Kriebel JK, Nuzzo RG, Whitesides GM. Chem Rev. 2005;105(4):1103. doi: 10.1021/cr0300789. [DOI] [PubMed] [Google Scholar]
- 33.Chang RK, Furtak TE. Surface-Enhanced Raman Scattering. New York: Plenum; 1982. [Google Scholar]