Abstract
Analytical expressions for the plasmon resonance frequencies of prolate and oblate spheroids and their dependence on ellipticity have been derived, and approximate bounds on these frequencies established. These formulas may be useful in tuning the plasmon resonance within certain limits. With increasing aspect ratio, the prolate spheroid resonance is red shifted relative to a sphere with no lower limit under the assumptions of a Drude dispersion model. On the other hand, the oblate resonances are blue shifted as the spheroid becomes increasingly flat, but up to a limit.
Keywords: nanotechnology, optical resonance, particle scattering, plasmon resonance, plasmons
1 INTRODUCTION
There has been a growing interest in using plasmonics-related properties of metallic nanostructures for a wide variety of applications. Our laboratory has extensively investigated surface-enhanced Raman scattering (SERS) in the development of plasmonics-active SERS substrates for chemical sensing and biosensing [1–3]. Plasmonics refers to the study of enhanced electromagnetic properties of metallic nanostructures. When a metallic nanostructured surface is irradiated by an incident electromagnetic field (e.g., laser light), conduction electrons are displaced into frequency oscillation equal to the incident light. These oscillating electrons, called “surface plasmons,” produce a secondary electric field, which adds to the incident field. When these oscillating electrons become spatially confined, as is the case for isolated metallic nanospheres or otherwise roughened metallic surfaces (nanostructures), there is a characteristic frequency (the plasmon resonance) at which there is a resonant response of the collective oscillations to the incident field. This condition yields intense localized fields which can interact with molecules in contact with or near the metal surface. Plasmon resonance frequencies of metallic spheroids and spheroidal nanoshells have been previously investigated [4–5].
It is well known that the plasmon resonance frequency of a spheroid can be shifted by varying its shape. For example, by increasing the aspect ratio of a prolate spheroid, the plasmon resonance is red shifted. On the other hand, the resonance frequency of an oblate spheroid is blue shifted relative to that of a sphere, but up to a limit. Although this fundamental behavior has been demonstrated by other authors, we have not seen the bounds on the plasmon resonance frequencies given explicitly for the prolate and oblate cases as a function of ellipticity. In this work we derive analytical expressions for the plasmon resonance frequencies of prolate and oblate spheroids and their dependence on ellipticity and establish approximate bounds on these frequencies. Our analysis is carried out using the simplifying assumptions of the quasi-static approximation and a Drude dispersion model for the dielectric constant. As a result, our results will only be qualitatively correct, but should nevertheless provide reasonable estimates of the dependence of the resonances on the spheroid shape. We also assume that the dipolar resonance dominates, which is generally accurate for particles much smaller than an optical wavelength [6]. In calculating the resonances for various aspect ratios for both prolate and oblate spheroids, we use the optical constants for the Drude model derived by fitting the Drude parameters to the data of Johnson and Christy [7].
2 ANALYSIS USING A DRUDE DISPERSION MODEL
When light is incident on a metallic nanoparticle, the plasmon resonances occur at the poles of the induced dipole moment. Suppose we assume an ellipsoidal particle with polarizabilities, αx, αy and αz, along its principal axes. Letting (E0x, E0y, E0z) denote the components of an incident electric field E0 along these axes, the dipole moment induced in the particle is
| (1) |
where x̂, ŷ and ẑ are unit vectors oriented along its principal axes. We first consider a prolate spheroid with the z-axis directed along its symmetry axis. Denoting by a and b the spheroid’s semi-major and semi-minor axes (with a > b) and εr its relative permittivity, the polarizabililties αx, αy and αz are given by [8]:
| (2) |
where V = 4πb2a/3 is the spheroid volume and Lx, Ly and Lz are the three spheroidal depolarization factors, given by
| (3) |
| (4) |
and is the ellipticity of the prolate spheroid. When e → 0, the spheroid becomes a sphere, Lx = Ly = Lz → 1/3 and αx = αy = αz.
For an oblate spheroid (a < b), the depolarization factors are [8]
| (5) |
| (6) |
where . Note that f = be/a, where is the ellipticity of the oblate spheroid. Again when e → 0, the spheroid becomes a sphere and Lx = Ly = Lz → 1/3
The frequency of the plasmon resonance occurs when the real part of the denominator of Eq. (2) vanishes:
| (7) |
To determine the frequencies of these resonances, we use the Drude free-electron model for the frequency-dependence of the dielectric constant, given by
| (8) |
where ωp is the plasma frequency of the bulk material, γ is the width of the resonance and ε∞ is the high-frequency limit of the dielectric constant.
We can compute the frequencies of the plasmon resonances for either prolate or oblate spheroids by substituting Eq. (8) into Eq. (7) and solving for ω. This gives the following expression for the plasmon resonance frequency of the spheroid:
| (9) |
Typically, γ ≫ ωp, and a reasonable approximation is obtained by neglecting the γ2 term:
| (10) |
Note that for the case of a sphere, Lj = 1/3 and .
Now assume a longitudinally incident electric field (parallel to the symmetry axis of the spheroid), in which case we set Lj = Lzin the above formulas. For the prolate spheroid the bounds on e and Lz are 0 ≤ e < 1 and 0 < Lz ≤ 1/3. In the limit as the aspect ratio becomes large, e → 1 and Lz → 0. For the oblate spheroid the bounds on e and Lz are 0 ≤ e < 1 (or, equivalently, 0 ≤ f < ∞) and 1/3 ≤ Lz < 1, and in the limit as the oblate spheroid becomes flat, e → 1 (or f → ∞) and Lz → 1. Thus, for the prolate case, the bounds on the plasmon resonance frequency, ωres, may be written
| (11) |
where the left-hand side can, in principle, go to zero as Lz → 0. For the oblate spheroid, the bounds on the plasmon resonance frequency become
| (12) |
Thus, from Eq. (11) we see that, as the aspect ratio of the prolate spheroid becomes large (Lz → 0), the resonance frequency is red shifted without bound. From Eq. (12), as the oblate spheroid becomes increasingly flat, the resonance frequency is blue shifted, but up to the limit given by the right-hand side of Eq. (12).
Oubre and Nordlander [9] give values for the constants ωp and ε∞ for silver and gold derived by fitting the Drude model (8) to the data of Johnson and Christy [7]. They obtain for silver, ε∞ = 5.0 and ħωp = 9.5 eV, and for gold, ε∞ = 9.5 and ħωp = 8.95 eV. Using these values in Eq. (11), the model predicts bounds on the resonant frequency for a prolate spheroid which, after converting to wavelength, are (in nm):
and the bounds on the oblate resonances are:
In the first two inequalities the infinity indicates that the Drude model predicts no upper bound on the wavelength in the limit as the aspect ratio of the prolate spheroid increases without bound. However, eventually other mechanisms will take effect and the Drude model will break down. For example, the Drude model will require modification when the mean-free path of the electrons exceeds the thickness of the spheroid.
For the transverse mode, Eq. (4) implies the following bounds on Lx for the prolate spheroid: 1/3 ≤ Lx < 1/2, where Lx = 1/3 again corresponds to the limit of a sphere. Also, as Lx → 1/2, the prolate aspect ratio increases without bound. From Eq. (10) these limits lead to the following bounds on the frequency for the transverse mode of the prolate spheroid:
| (13) |
These bounds are narrower than and bracketed by the bounds of the longitudinal mode for the oblate spheroid, given by Eq. (12). Finally, for the transverse mode of the oblate spheroid, we have 0 ≤ Lx < 1/3, where, as Lx → 0, the spheroid becomes increasingly flat. This result leads to frequency bounds identical to those for the longitudinal mode of the prolate spheroid.
3 ANALYSIS USING TABULATED DISPERSION DATA
The above results were computed using the expression Eq. (8) for the dielectric constant using fitted values for ω∞, ωp and γ. An alternative approach is to search the tabulated data for the frequency that satisfies the relation Eq. (7) for a given parameter Lj, which is defined by the spheroid shape. That is, we search for the zeros of the function
| (14) |
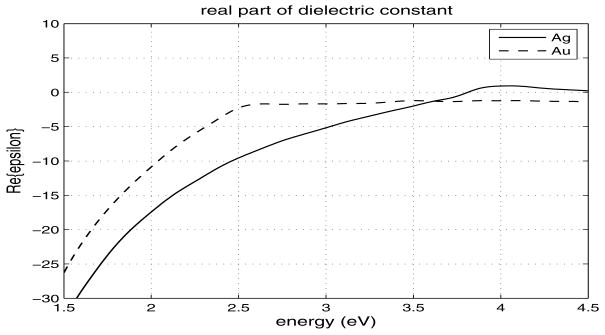
given data for the real part of the dielectric constant, Re{εr(ω)}. For this purpose, we use Johnson and Christy’s data for Re{εr(ω)}, which is plotted in Figure 1.
Fig. 1.
Real part of dielectric constant (from [7]).
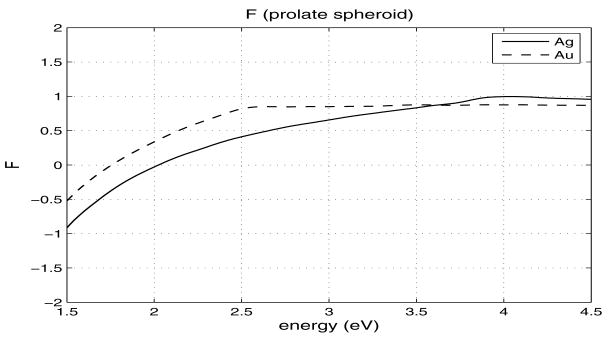
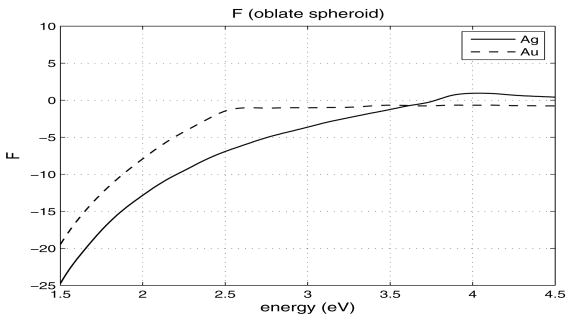
Figure 2 shows plots of F(ω) for a prolate spheroid of aspect ratio a/b = 5 (Lz = 0.056) for silver and gold. The plasmon resonance frequencies for the two metals are given by the zero crossing of the graphs, which are ħωAg = 2.04 eV and ħωAu = 1.76 eV. These values compare well with those predicted by formula (10), which are ħωAg = 2.029 eV and ħωAu = 1.741 eV. Figure 3 is a plot of F(ω) for an oblate spheroid of aspect ratio b/a = 5 (Lz = 0.751) for silver and gold. For silver, we obtain a zero crossing at 3.78 eV, as compared to 4.11 eV computed using Eq. (10). However, for the case of gold, the graph does not cross zero, which evidently indicates that a gold oblate spheroid of this aspect ratio will fail to have a plasmon resonance. Nevertheless, formula (10) predicts such a resonance at ħωAg = 2.854 eV, since the Drude model generates a smooth curve that crosses the zero axis.
Fig. 2.
Plot of the function F(ω) given by Eq. (14) for a prolate spheroid.
Fig. 3.
Plot of the function F(ω) given by Eq. (14) for an oblate spheroid.
Finally, as evident from Eq. (9), the effect of a nonzero γ in Eq. (8) will result in a small red-shift in all of the above values. For very small particles, a correction to γ derived from the bulk material is often included to account for electron scattering from the particle boundaries, but this correction is expected to have a relatively minor effect on the location of the resonance frequencies.
Acknowledgments
This work was sponsored by the National Institutes of Health (Grant R01 EB006201).
References
- 1.Vo-Dinh T, Hiromoto MYK, Begun GM, Moody RL. Surface-enhanced Raman spectrometry for trace organic-analysis. Anal Chem. 1984;56:1667–1670. doi: 10.1021/ac00273a029. [DOI] [Google Scholar]
- 2.Vo-Dinh T. Surface-enhanced Raman spectroscopy using metallic nanostructures. Trends Anal Chem. 1998;17:557–582. doi: 10.1016/S0165-9936(98)00069-7. [DOI] [Google Scholar]
- 3.Wabuyele M, Vo-Dinh T. Detection of Human Immunodeficiency Virus Type 1 DNA sequence Using Plasmonics Nanoprobes. Anal Chem. 2005;77:7810–7815. doi: 10.1021/ac0514671. [DOI] [PubMed] [Google Scholar]
- 4.Radloff C, Halas NH. Plasmonic properties of concentric nanoshells. Nano Lett. 2004;4:1323–1327. doi: 10.1021/nl049597x. [DOI] [Google Scholar]
- 5.Norton SJ, Vo-Dinh T. Plasmon resonances of nanoshells of spheroidal shape. IEEE Trans Nanotechnology. 2007;6:627–638. doi: 10.1109/TNANO.2007.909074. [DOI] [PMC free article] [PubMed] [Google Scholar]
- 6.Bohren CF, Huffman DR. Absorption and Scattering of Light by Small Particles. John Wiley and Sons; New York: 1983. [Google Scholar]
- 7.Johnson PB, Christy RW. Optical constants of the noble metals. Phys Rev B. 1972;6:4370–4379. doi: 10.1103/PhysRevB.6.4370. [DOI] [Google Scholar]
- 8.Ishimaru A. Electromagnetic Wave Propagation, Radiation and Scattering. Prentice Hall, Englewood Cliffs; New Jersey: 1991. p. 291. [Google Scholar]
- 9.Oubre C, Nordlander P. Finite difference time domain studies of optical properties of nanoshell structures. Proc SPIE. 2003;5221:133–143. doi: 10.1117/12.511664. [DOI] [PubMed] [Google Scholar]


