

Abstract
Ranaviruses have been implicated in recent declines in global amphibian populations. Compared with the family Iridoviridae, to which the genus Ranavirus belongs, ranaviruses have a wide host range in that species/strains are known to infect fish, amphibians and reptiles, presumably due to recent host-switching events. We used eight sequenced ranavirus genomes and two selection-detection methods (site based and branch based) to identify genes that exhibited signatures of positive selection, potentially due to the selective pressures at play during host switching. We found evidence of positive selection acting on four genes via the site-based method, three of which were newly acquired genes unique to ranavirus genomes. Using the branch-based method, we identified eight additional candidate genes that exhibited signatures of dN/dS (non-synonymous/synonymous substitution rate) >1 in the clade where intense host switching had occurred. We found that these branch-specific patterns of elevated dN/dS were enriched in a small group of viral genes that have been acquired most recently in the ranavirus genome, compared with core genes that are shared among all members of the family Iridoviridae. Our results suggest that the group of newly acquired genes in the ranavirus genome may have undergone recent adaptive changes that have facilitated interspecies and interclass host switching.
Introduction
Since the 1980s, amphibian populations have increasingly declined on a global scale, and by 2004, at least 32 % of all amphibian species were categorized as threatened by the International Union for Conservation of Nature (Collins & Storfer, 2003; Stuart et al., 2004). In addition to several biotic and abiotic factors, two emerging pathogens, a chytrid fungus (Batrachochytrium dendrobatidis) and a virus (ranavirus), have been implicated in this ecological crisis (Daszak et al., 1999). The genus Ranavirus is a member of the family Iridoviridae, which consists of large dsDNA viruses that are currently divided into five genera (Williams et al., 2005). Members of two of these genera (Iridovirus and Chloriridovirus) infect invertebrates and members of three (Lymphocystivirus, Megalocytivirus and Ranavirus) infect heterothermic vertebrates. Members of the genera Lymphocystivirus and Megalocytivirus solely infect fish, but ranaviruses infect fish, amphibians and reptiles, presumably due to recent host-switching events (Jancovich et al., 2010). Direct contact and ingestion of contaminated water are known transmission modes, and infection leads to necrosis of the liver, spleen, skin and haematopoietic tissue (Lesbarrères et al., 2012). The bait, pet and food industries are major factors in the spread of these pathogens geographically to naïve localities and species (Jancovich et al., 2005; Picco & Collins, 2008). Although both pathogens pose a lethal threat to amphibians, ranaviruses tend to cause recurrent population die-offs that target larval-stage amphibians (Chinchar, 2002). Numerous ranavirus species/strains have contributed significantly to amphibian die-offs on five continents, and are known to infect over 70 amphibian species (Daszak et al., 1999; Miller et al., 2011).
Ranaviruses are emerging pathogens, meaning that amphibian populations have only recently been affected due to increased incidence, geography or host range (Rachowicz et al., 2005). There is significant evidence for host switching of ranaviruses between vertebrate classes (Jancovich et al., 2005, 2010; Bandín & Dopazo, 2011), as well as documented instances of simultaneous infections of sympatric fish and frogs with the same viral isolate (Mao et al., 1999; Bayley et al., 2013). In viral host switching, the virus of one species evolves such that it can replicate and spread in a new species. There is great interest in understanding this process, not just for conservation reasons but also because it underlies the emergence of new human diseases (Wain et al., 2007; Parrish et al., 2008; Choe et al., 2011; Demogines et al., 2012a, b, 2013). In general, host switching is thought to occur via a series of steps that involve both geographical movement of viruses (leading to exposure to new hosts) and, in most cases, the evolution of viral genomes for compatibility with new host species (Herfst et al., 2012; Kaelber et al., 2012). With regard to host switching in ranaviruses, the process probably began with the exposure of a novel amphibian host to a viral strain that originated in a fish host (Fig. 1). New mutations, including point mutations, insertions, deletions and even the acquisition or loss of whole genes, may have made a certain strain of the fish virus compatible with the new amphibian host species. Following initial infection, additional mutations or gene acquisitions may have increased viral fitness in a new host, thus allowing local transmission within species and between classes. Indeed, ranavirus genomes have diverged in sequence, and are known to have acquired several new genes that are not found in the broader family of the Iridoviridae (Eaton et al., 2007). These new genes may have been acquired via the processes of horizontal gene transfer or recombination. The presence of several virus-encoded cellular homologues in ranavirus genomes supports the acquisition of new viral genes by horizontal transfer from host genomes (Tidona & Darai, 2000). In addition, the presence of several ranavirus genes without corresponding cellular homologues, coupled with the high rate of recombination seen in these viruses, suggests that recombination is also a significant source of new genes (Eaton et al., 2007; Chinchar et al., 2009). The situation with ranaviruses may be analogous to the evolution of simian immunodeficiency viruses, where the continued acquisition and evolution of new viral genes led to expansion of these viruses to new primate hosts and ultimately to humans, giving rise to HIV (Gifford, 2011).
Fig. 1.

A model for ranavirus host switching within and between vertebrate classes. During cross-species transmission, evolution of a viral genome makes the virus increasingly compatible with the genetic background of new host species, and may facilitate interclass transmission. Mutations (black bars) and the acquisition of new genes (open rectangles) may work to progressively increase the compatibility between the ranavirus genome and new host species. Two separate scenarios that include point mutations occurring throughout the original and newly acquired regions of the genome can lead to transmission within species (2a) or between vertebrate classes (2b) over time. The acquisition of novel genes in the ranavirus genome and subsequent mutations within those genes most likely play a fundamental role in the ranavirus host-switching process.
The main factor limiting our ability to understand the broad host range of ranaviruses is the paucity of information regarding the viral genes that govern host specificity. Ranavirus genomes encode approximately 100–140 putative gene products, most of which have unknown functions (Grayfer et al., 2012). Computational tools that can detect episodes of rapid adaptation of specific genes, in conjunction with the increased availability of genomic data, have provided new avenues for identifying candidate genes potentially involved in dynamic processes such as host switching (Sawyer & Elde, 2012). In many cases, genes that are involved in host–pathogen interactions exhibit episodes of intense positive selection during the process of establishing a new host species (Shackelton et al., 2005; Hoelzer et al., 2008; Meyerson & Sawyer, 2011; Bhatt et al., 2013). Genes identified via these methods are often involved in immune evasion, replication, reproduction, gene expression, host–pathogen co-evolution and host defences (Endo et al., 1996; Yang et al., 2000; McLysaght et al., 2003; Harrison & Bonning, 2004; Shackelton et al., 2005; Sabeti et al., 2006; Kosiol et al., 2008; Elde et al., 2012). However, the absence of positive selection does not necessarily mean that genes are not key factors in host range and immune evasion, just as the presence of positive selection does not automatically assign genes to these roles.
Methods used to study adaptive molecular evolution typically involve the identification of gene regions or specific codons where the non-synonymous substitution rate (dN) exceeds the synonymous substitution rate (dS). This is expected only when non-synonymous mutations offer a selective advantage and become fixed at a higher rate than expected under neutral theory (Goldman & Yang, 1994). In practice, dN/dS>1, dN/dS = 1 and dN/dS<1 are inferred to reflect positive selection, neutral evolution and purifying selection, respectively. Two widely used selection-detection methods identify individual codon sites (site-based model) and specific branches along a phylogeny (branch-based model) that exhibit signatures of positive selection (Nielsen & Yang, 1998; Yang, 1998). The availability of several complete genomes of members of the family Iridoviridae from viruses infecting vertebrates provides the opportunity to assess the prevalence of positive selection within specific genes and across the ranavirus phylogeny.
Here, we describe a genomic-scale characterization of ranavirus evolution. The goals of this study were to detect viral genes that were under positive selection, particularly on branches in the phylogeny where potential host-switching events have occurred. Using eight fully sequenced ranavirus genomes, we analysed 46 genes for evolutionary signatures. We found evidence of positive selection acting on four genes via the site-based method, three of which were newly acquired genes unique to ranavirus. Using the branch-based method, we identified eight additional candidate genes that exhibited signatures of dN/dS>1 along at least one branch in the clade where intense host switching had occurred. We also found evidence of significantly higher dN/dS values for ranavirus-specific genes along individual branches when compared with core genes shared among all members of the family Iridoviridae. We concluded that adaptive evolution is occurring in newly acquired viral genes, and propose that both the acquisition and the subsequent evolution of these genes has been key in facilitating host switching of these viruses.
Results
In previous studies, the full-genome sequences of 15 vertebrate viruses of the family Iridoviridae have been determined (Table 1). Ten of these are ranaviruses, and represent viruses isolated from bony fish, salamander, frog and turtle species (Figs 2 and S1, available in JGV Online). These viral genomes vary somewhat in length and gene content, and contain approximately 100–140 genes. The genes examined in this analysis were identified previously as orthologues via a whole-genome comparative analysis (see Methods; Eaton et al., 2007). In total, we were able to align 75 orthologues from these genomes, and assigned each of these 75 genes to four groups depending on when each gene was acquired in the phylogenetic history of these viruses (Fig. 2). The ‘core’ gene group included 26 genes found in all 15 sequenced iridovirus genomes. The ‘RV’ (ranavirus) gene group comprised 23 genes specific to the ten ranavirus genomes but not found in the other five genomes. This group of genes was gained prior to the initial host switch from fish to amphibians (Jancovich et al., 2010). The ‘F/A/R’ (fish/amphibian/reptile) gene group included six genes found exclusively in the target clade, which is the monophyletic group of ranaviruses, excluding SGIV and GIV. The target clade included the group of viruses that has been newly transmitted beyond fish. This F/A/R gene group was particularly interesting, because these genes were specific to the clade of viruses that has experienced the most recent host switching. Lastly, the remaining 20 genes were assigned to the ‘other’ gene group, which included genes found in ranaviruses and at least one other iridovirus genus (i.e. Ranavirus and Chloriridovirus but no other genera).
Table 1. Fifteen genomes utilized in the present study and their host species.
| Viral species/strain | Genus | Host species | GenBank accession no. (reference) |
| Frog virus 3 (FV3) | Ranavirus | Rana pipiens | AY548484 (Tan et al., 2004) |
| Soft-shelled turtle iridovirus (STIV) | Ranavirus | Trionyx sinensis | EU627010 (Huang et al., 2009) |
| Rana grylio virus (RGV) | Ranavirus | Rana grylio | JQ654586 (Lei et al., 2012) |
| Tiger frog virus (TFV) | Ranavirus | Rana tigrina | AF389451 (He et al., 2001) |
| Common midwife toad virus (CMTV) | Ranavirus | Alytes obstetricans | JQ231222 (Mavian et al., 2012a) |
| Ambystoma tigrinum virus (ATV) | Ranavirus | Ambystoma tigrinum | AY150217 (Jancovich et al., 2003) |
| Epizootic haematopoietic necrosis virus (EHNV) | Ranavirus | Oncorhynchus mykiss | FJ433873 (Jancovich et al., 2010) |
| European sheatfish virus (ESV) | Ranavirus | Silurus glanis | JQ724856 (Mavian et al., 2012b) |
| Singapore grouper iridovirus (SGIV) | Ranavirus | Epinephelus tauvina | AY521625 (Song et al., 2004) |
| Grouper iridovirus (GIV) | Ranavirus | Epinephelus awoara | AY666015 (Tsai et al., 2005) |
| Lymphocystis disease virus 1 (LCDV1) | Lymphocystivirus | Platichthys flesus | L63545 (Tidona & Darai, 1997) |
| Lymphocystis disease virus China (LCDVC) | Lymphocystivirus | Paralichthys olivaceus | AY380826 (Zhang et al., 2004) |
| Infectious spleen and kidney necrosis virus (ISKNV) | Megalocytivirus | Siniperca chuatsi | AF371960 (He et al., 2002) |
| Orange-spotted grouper virus (OSGIV) | Megalocytivirus | Epinephelus coioides | AY894343 (Lü et al., 2005) |
| Rock bream iridovirus (RBIV) | Megalocytivirus | Oplegnathus fasciatus | AY532606 (Do et al., 2004) |
Fig. 2.

Phylogenetic relationships among vertebrate iridovirus genomes included in the study. A phylogenetic tree of viral species/strains isolated from fish, amphibians and reptiles based on a maximum-likelihood analysis of a concatenated dataset of 26 core iridovirus genes. The target clade within the ranaviruses is highlighted in black. Arrows indicate the origin of genes shared among all iridovirus genomes (core gene group; n = 26), among all ranavirus genomes (RV gene group; n = 23) and among the target clade (F/A/R gene group; n = 6). Tick marks indicate branches along which the initial host switch from fish to salamanders (point A) and the host switch to frogs and reptiles (point B) are thought to have occurred (Jancovich et al., 2010). Bootstrap values are shown. Note that each fish, amphibian and reptile symbol denotes multiple species as indicated in Table 1. Bootstrap values are indicated on the branch nodes.
Four genes under positive selection identified using site-based tests
We next analysed a subset (46/75 genes) of the individual gene alignments for patterns of non-synonymous and synonymous substitution using the NSsites codon models in paml 4 (Yang, 2007). The 29 genes excluded from the analysis failed to meet the outlined criteria based on sequence alignment and phylogenetic reconstruction (see Methods; Table S1). Of the 46 analysed, we identified four genes that exhibited signatures of positive selection under the NSsites models (Table 2). This group of genes included a single member of the core gene group (ORF53R), one gene from the RV gene group (ORF79R) and two genes from the F/A/R gene group (ORF40R and ORF71R). Evidence of selection acting on RV and F/A/R genes might be explained by the fact that these genes have been recently acquired and are unique to a single genus where host switching is evident. Relative to the newly acquired RV and F/A/R genes, evidence of selection acting on core genes was unexpected due to the highly conserved nature of this group of genes within the family Iridoviridae. The conservation of core genes may indicate that, in general, these genes are essential to the viral life cycle and that they are subject to purifying selection pressures.
Table 2. Four genes under positive selection identified using site-based tests.
| Gene name | Gene group | M8a-M82Δl | P value (α = 0.05) | Tree length | Amino acid positions of dN/dS>1*†‡ |
| ORF53R/myristylate membrane protein | Core | 3.92 | 0.0478 | 0.16 | 387G (0.86) |
| ORF79R/putative ATPase-dependent protease | RV | 5.19 | 0.0227 | 1.06 | 81L (0.88), 82A,† 84Q (0.89), 86L (0.81), 87V (0.83), 91S (0.88), 123L (0.85), 137R,† 140N (0.87), 146L (0.83) |
| ORF40R | F/A/R | 4.74 | 0.0294 | 0.82 | 29M (0.84), 131Q,† 134A (0.88), 164T (0.83), 165V (0.81), 168L (0.83), 191T (0.88), 192P (0.86) |
| ORF71R | F/A/R | 12.9 | 0.0003 | 0.38 | 19T,‡ 50M (0.94), 58I,‡ 70I† |
Amino acid coordinates correspond to the position in the FV3 amino acid sequence. Values in parentheses refer to the PP of a site fitting into a dN/dS>1 class.
PP >0.95.
PP >0.99.
In addition to identifying individual genes that have experienced positive selection, specific codons under positive selection were also identified (Table 2). At least one codon with a posterior probability (PP) of >0.80 was identified for each gene. To determine whether the positively selected sites fell into structurally flexible regions of the protein, we utilized the Phyre2 server to predict the secondary structure of the proteins encoded by the four genes that exhibited signatures of positive selection under the NSsites model. We then mapped the amino acid sites onto the secondary structure to determine whether any of the residues resided in areas of conformational flexibility, described as unstructured regions with high disorder (Fig. S2). We found that one out of one sites for ORF53R, ten out of ten sites for ORF79R, three out of eight sites ORF40R and one out of four sites for ORF71R fell into unstructured (neither α-helix nor β-strand) regions of the protein. Unstructured regions of proteins may be more tolerant to conformational and adaptive changes (Nilsson et al., 2011).
Eleven genes with dN/dS>1 identified using branch-based tests
Based on the evolutionary relationships of the viral strains and the species from which they were isolated, we can support hypotheses about where host-switching events have occurred in the ranavirus species phylogeny (Jancovich et al., 2010). For instance, we can support the hypothesis that the original host switch involved a jump from fish to salamanders (Fig. 2, point A). Moreover, we can also support a host switch from fish to frogs or from fish to frogs and turtles on the lineage leading to the (FV3, STIV, RGV, TFV and CMTV) clade (Fig. 2, point B). To examine evidence for accelerated gene evolution of any genes on these lineages, we next analysed branch-specific patterns of dN/dS for each of our 46 genes. Whereas the previous test for selection identified specific codons that had dN/dS>1, in this analysis each gene was assigned a global dN/dS value along every branch of the tree.
We identified 11 genes that exhibited signatures of dN/dS>1 along at least one branch under the free-ratio test. These included three genes from the RV and core gene groups (Fig. 3), four genes from the F/A/R gene group (Fig. 4) and four genes from the ‘other’ gene group (Fig. S3). In some cases, dN/dS values were much higher than 1, as for gene ORF40R on the branch leading to TFV, where dN/dS = 3.7 (Fig. 4b). In other cases, dN/dS values were closer to 1 and may reflect neutral evolution rather than positive selection. Likelihood ratio tests were performed to determine whether the likelihood values obtained with individual branches assigned dN/dS>1 were statistically greater than likelihood values obtained when the same branch was fixed at dN/dS = 1. Based on this analysis, on no branch was dN/dS significantly greater than 1; however, identification of genes with elevated dN/dS signatures was notable considering dN/dS was averaged across the entire gene. There is reason to believe that some of these signatures could still be meaningful, because three of these same genes (ORF79R, ORF40R and ORF71R) were also identified previously as evolving under positive selection in the site-based analysis described above (Table 2).
Fig. 3.
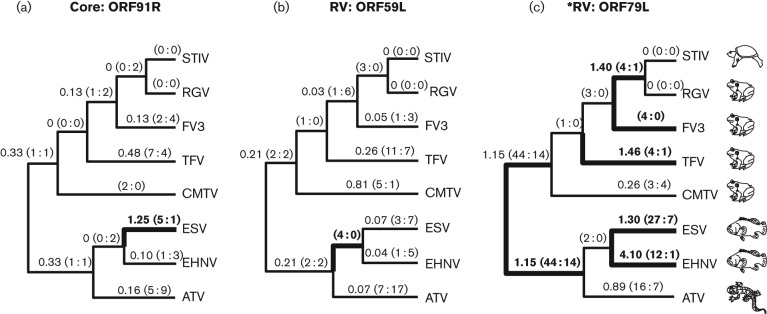
Three core and RV genes with elevated dN/dS values identified using branch-based tests. Phylogenies with free-ratio results for genes with branches exhibiting signatures of dN/dS>1 are presented. The branch values of dN/dS are shown, along with the estimated numbers of non-synonymous and synonymous (N : S) mutations that are predicted to have occurred along each branch (in parentheses). Branches with values of dN/dS>1 are shown in bold. Branches with incalculable dN/dS values (due to S = 0) are highlighted in bold if the ratio of N : S was greater than or equal to 4 : 0. Genes indicated with an asterisk were also found to exhibit signatures of positive selection under site-based tests (Table 2).
Fig. 4.

Four F/A/R genes with elevated dN/dS values identified using branch-based tests. Phylogenies with free-ratio results for genes with branches exhibiting signatures of dN/dS>1 are presented. Branch values of dN/dS are shown, along with the estimated numbers of non-synonymous and synonymous (N : S) mutations that are predicted to have occurred along each branch (in parentheses). Branches with dN/dS values >1 are shown in bold. Branches with incalculable dN/dS values (due to S = 0) are highlighted in bold if the ratio of N : S was greater than or equal to 4 : 0. Genes with an asterisk were also found to exhibit signatures of positive selection under site-based tests (Table 2). Note variation in the topologies of ORF71R and ORF93L due to slightly different gene trees.
Despite the fact that F/A/R represented the smallest gene group analysed, four of the six F/A/R genes analysed (ORF39R, ORF40R, ORF71R and ORF93L) exhibited dN/dS>1 on at least one branch (Fig. 4). When compared with the percentage of genes with dN/dS>1 branches for the core (5 %), RV (18 %) and ‘other’ (36 %) groups, genes from the F/A/R group (67 %) exhibit a relatively higher percentage of genes with elevated dN/dS values. Based on this result and the identification of two out of the six F/A/R genes via the site-based method (Table 2), we conducted an enrichment analysis to determine the probability that four randomly selected genes would belong to the F/A/R gene group. We calculated probabilities of P = 0.00009 when 46 genes were included and P = 0.00001 when 75 genes were included in the analysis. These results are consistent with selection in ranaviruses having been biased towards viral genes that are new to this clade.
Significant differences in median and mean dN/dS values of the core, RV and F/A/R gene groups detected using branch-based tests
We wished to examine further whether there were significant differences in branch dN/dS values among the core, RV and F/A/R gene groups. For each of the 13 branches in the target clade (the clade where host switching is pervasive; Fig. 2), median and mean dN/dS values for each gene group were compared. For each branch, we performed a Kruskal–Wallis (K-W) test (α = 0.05) to compare the median dN/dS values for each gene group, and a one-way ANOVA (α = 0.05) to compare the mean values. On four of the 13 branches, significant differences were noted (Fig. 5). We detected significant differences in the medians and means for branch B (K-W, P = 0.001; ANOVA, P = 0.0001) and the ATV branch (K-W, P = 0.0037; ANOVA, P = 0.0005) (Fig. 5b, d). In both cases, the median and mean dN/dS values were highest for the F/A/R gene group. However, whilst F/A/R dN/dS values were significantly different from the core gene group values, they did not differ significantly from the RV gene group based on post-hoc tests. We also detected a significant difference in the medians for the TFV branch (P = 0.0381) using the K-W test (Fig. 5c); however, the ANOVA was not significant (P>0.05). Lastly, branch A was marginally significantly different in the ANOVA analysis (P = 0.0446), but there was no significant difference in the medians based on the K-W test (P>0.05). Higher dN/dS values for the ranavirus-specific gene groups along branches A and B could indicate selection acting prior to a potential host switch between amphibians and reptiles, which was the most recent putative host-switching event examined in this study. Moreover, this interpretation might also apply to the ATV branch, which corresponded to selection following a host switch from fish to amphibians. The trend of higher mean and median values for the F/A/R gene group for three of the branches (Fig. 5b–d) is consistent with the idea that F/A/R genes are involved in ranavirus host switching.
Fig. 5.

Significant differences in median and mean dN/dS values of the core, RV and F/A/R gene groups detected using branch-based tests. The inset phylogenies show the significant branches in bold. Boxplots for statistically significant branches are shown (branches without significant support are not shown). K-W tests (medians) were performed on the transformed dataset (square root of dN/dS, raw data shown). One-way ANOVA tests (means) were performed on the transformed dataset (square root of dN/dS, raw data shown). An asterisk indicates that the mean of the F/A/R gene group was statistically different from the core gene group based on Bonferroni post-tests.
Discussion
The phylogeny of viruses in the family Iridoviridae, particularly in the ranavirus clade, is consistent with extensive host switching by these viruses (Fig. 2). The adaptation of a virus to a novel host species is often paired with intense episodes of positive selection acting on genes that increase the compatibility between the virus and host. We conducted a genome-wide scan for genes and lineages under positive selection to gain further insights into ranavirus host switching. We identified a total of 12 genes exhibiting signatures of dN/dS>1, and six of these were in a special category of genes, which have been newly acquired by these viruses (RV and F/A/R gene groups). We expected that genes in the RV and F/A/R gene groups may play a fundamental role in the adaptation of ranaviruses to new hosts, because the acquisition of these genes appears to have been coincident with the onset of host switching in this virus family (Jancovich et al., 2010). In support of this hypothesis, several approaches showed that dN/dS values tended to be elevated in these gene families.
Regarding the six ranavirus-specific genes that we identified as adaptively evolving, several aspects are notable. ORF79R (RV gene group) was the only gene to have dN/dS>1 on the branch that separates the two major ranavirus clades (Fig. 3c), which suggested gene evolution as the viruses spread to new frog species (Fig. 2). Thus, ORF79R may represent a gene that was fundamental to the initial host switch from fish to salamanders and possibly subsequent jumps. The identification of four genes specific to the F/A/R gene group with dN/dS>1 on at least one branch supports the hypotheses of intensified positive selection acting on these newer genes. Three of the four identified F/A/R genes are of unknown function and have no known homologues. It is possible that these genes encode novel virulence factors, which are typically proteins that counteract host-specific immune defences. For instance, examinations of genomes of members of the family Poxviridae and the order Herpesvirales have revealed the presence of virus-encoded homologues of cellular cytokines that have evolved to modulate the host immune response (Slobedman et al., 2009). In fact, the F/A/R gene ORF26R (α-subunit of eukaryotic initiation factor 2) is a virus-encoded cellular homologue (Eaton et al., 2007). Although no evidence of positive selection was detected in ORF26R, a recent study using a knockout approach showed that impairment of the gene in FV3 resulted in decreased virulence in vivo (Chen et al., 2011). We also found that mean and median dN/dS values for several branches in the ranavirus phylogeny were significantly higher for the F/A/R group when compared with the core gene group (Fig. 5). Considering this result and the low probability (P = 0.00009) of finding dN/dS>1 branches in four of the six F/A/R genes by random chance, we can conclude that F/A/R genes represent a group of newly acquired viral genes that have undergone adaptive changes that may have facilitated interspecies and interclass host switching (Fig. 1).
There are other examples where adaptive evolution of virus genomes has accompanied host-switching events. For instance, parvoviruses experienced adaptive evolution of the gene encoding the surface-exposed viral protein, the capsid, after this virus first became established in dogs in the 1970s (Hoelzer et al., 2008). These evolutionary changes improved the interaction between the capsid and the dog-encoded cell-surface receptor for virus entry, the transferrin receptor. Also, a recent study of the adaptive evolution of influenza viruses showed that elevated adaptive evolution was associated with the establishment of avian influenza viruses in swine populations (Bhatt et al., 2013). In this case, signatures of selection were located across the genome and so the specific host–virus interactions that drove this evolution are unknown. With regard to ranaviruses, this situation is unique from these other examples because the cross-species transmission of these viruses appears to have coincided with the addition of new genes to the viral genome, as well as their evolutionary refinement for infection of new host species.
Although we did not explicitly test the hypothetical model presented in Fig. 1, the relatively recent acquisition of new genes (RV and F/A/R genes) coupled with an excess of non-synonymous mutations in these genes supports the idea that gene gain followed by gene-specific mutation may influence ranavirus host switching. Moreover, evidence of simultaneous infections of sympatric fish and amphibian species with the same viral isolates (Mao et al., 1999) supports the idea that both interspecies and interclass transmission may be a common occurrence. However, additional studies of ranavirus spread in natural environments are needed to specifically test the model. Furthermore, estimates of viral divergence times and the timing of gene acquisitions are needed to fully understand the emergent nature of ranaviruses. Although humans have influenced the movement of aquatic species for millennia, it is more likely that recent human activities (globalized food, bait and pet trades) have enhanced the spread of these pathogens to naïve species. Unfortunately, as the rates of evolution in iridoviruses are currently unknown, uses of molecular clock methods are not possible (Ridenhour & Storfer, 2008). In the absence of these data, the genes identified in this study are prime candidates for knockout and site-directed mutagenesis analyses to determine gene function and the effect of the genes on viral host range in this unique genus.
Methods
Data collection and recombination analyses.
Sequences for 75 ORFs from the 15 complete vertebrate Iridoviridae genomes were downloaded from GenBank (Table 1). These ORFs were placed into specific gene groups based on the genomic analysis of Eaton et al. (2007), which identified orthologous genes throughout the family using a combination of blast searches and Viral Orthologous Clusters software (Eaton et al., 2007). Genes from viral genomes not analysed by Eaton et al. (2007) were identified via blast searches and analyses conducted by the authors of the published genome sequences (Huang et al., 2009; Jancovich et al., 2010; Lei et al., 2012; Mavian et al., 2012a, b). The first group, the core gene group, included 26 ORFs that have orthologues in all members of the family Iridovirdae (including the two invertebrate genera Iridovirus and Chlorididovirus). The second group, the RV gene group, included 23 ORFs that have orthologues only found in members of the genus Ranavirus. The third group, the F/A/R gene group, included six ORFs that have orthologues only found in the target clade, which included FV3, STIV, RGV, TFV, CMTV, ATV, ESV and EHNV species/strains. The remaining ORFs were identified as ‘other’ and included 20 ORFs that are shared between ranavirus species/strains and at least one other genus (including those that infect invertebrates).
The sequences for each ORF were aligned using clustal w (Larkin et al., 2007). Four ORFs with alignments that were judged to be unreliable were excluded from further analyses (Table S1). CodonTest (Delport et al., 2010) was then used to determine the best nucleotide substitution model for the remaining 71 alignments. The nucleotide substitution models were then used to calibrate the program gard (genetic algorithm for recombination detection) (Kosakovsky Pond et al., 2006), which was used to test for the presence of recombination in each ORF. A total of 25 ORFs with significant evidence of recombination were split based on the location of the recombination breakpoints, and each component was tested individually in subsequent analyses.
Phylogenetic reconstruction.
Phylogenetic trees were reconstructed for individual ORF alignments using the rapid bootstrap command in RAxML, which automatically applies the GTR+Γ model (500 bootstrap replicates were used to assess node support). Preliminary analyses of alignments that included sequences from the 15 members of the family Iridoviridae and ten ranavirus species/strains resulted in highly divergent phylogenies that fell outside the ideal range for the selection analyses (with some divergences of more than 20 nt substitutions per codon). To analyse divergences closer to 1 nt substitution per codon, which is a commonly used standard (Anisimova et al., 2001), only alignments using the eight sequences from the target clade were used in subsequent analyses. Please note that the apparent topological differences in the 15-taxon and the eight-taxon trees are due to the inclusion of additional data and the placement of the root. Fig. S4 illustrates that the relationship between ATV, and EHNV and ESV is consistent between the unrooted topologies. Moreover, the rooted topology seen in Fig. S4(b) can be recovered in Fig. S4(a) when the root of the 15-taxon tree is moved to match that of the eight-taxon tree. Thus, the phylogenetic relationships are consistent among the phylogenies.
The resulting eight-taxon phylogenies were accepted based on the criteria of a fully resolved topology and bootstrap support values that were ≥50 for the following clades: FV3, STIV and RGV; FV3, STIV, RGV, TFV and CMTV; and ATV, EHNV and ESV. A total of 25 ORFs that did not meet these requirements were excluded from the analyses, and the remaining core (18), RV (11), F/A/R (six) and ‘other’ (11) ORFs were further analysed. The resulting topologies for each ORF, without the inclusion of branch lengths, were then used as input topologies for the selection-detection analyses in the paml 4 (phylogenetic analysis by maximum likelihood) software package (Yang, 2007).
To determine the overall phylogenetic relationships of the vertebrate iridoviruses, a phylogenetic tree was reconstructed via maximum likelihood using a concatenated dataset of the 26 core group genes (Figs 1 and S1). The phylogeny was reconstructed using RAxML (Stamatakis, 2006) under the GTR+Γ model with the data partitioned by gene, and 500 bootstrap replicates were used to assess node support.
Detection of positive selection
Identifying selection at specific sites.
Site-based models were used to identify specific sites (codons) under positive selection via the NSsites models implemented in paml 4. The NSsites models allow dN/dS to vary among sites, and use likelihood ratio tests and Bayesian analyses to identify positively selected sites. Each test involves the comparison of a null model (M8a) with a model that incorporates positive selection (M8). M8a versus M8 models were run for each ORF, and the significance of the likelihood ratio scores was determined via the use of a χ2 distribution (α = 0.05). The models were run under the f61 codon frequency models. Sites that fell into positively selected classes were then subjected to a Bayes empirical Bayes analysis, which calculates a PP of a site fitting into a dN/dS>1 class. The sites detected were reported as being under positive selection if they had a PP of >0.80 under the Bayes empirical Bayes method.
Identifying selection along branches.
Branch-based models seek to identify specific branches along a phylogeny that exhibit signatures of positive selection. To test for positive selection along specific branches in the phylogeny, the free-ratio model that is implemented in paml 4 was used to estimate branch-specific dN/dS ratios. The free-ratio model allows a unique dN/dS value to be calculated for each branch in the phylogeny. The free-ratio model was run for each ORF under the f61 codon frequency model to account for codon usage bias. To maximize topological consistency in our analyses, we constrained the topology of gene trees with alternative topologies to the topology supported by Fig. 2 (accepted topology). We then ran the branch-based analysis and used likelihood ratio tests to determine whether the results were significantly different between the two trees. The accepted topology is presented in cases where no significant difference was detected. Likelihood ratio tests were performed to determine whether the likelihood value for each branch that was assigned dN/dS>1 was statistically significant when compared with the likelihood value of the same branch when fixed at dN/dS = 1. The dN/dS of the target branch was fixed at 1, and the likelihood was calculated (null model). The null model was then compared with the alternative model, which fixed the target branch at the dN/dS value calculated under the free-ratio model.
To determine whether there were significant differences in dN/dS values among the core, RV and F/A/R gene groups, we compared both the median and mean dN/dS values for each group for each branch using K-W and ANOVA tests, respectively. The dN/dS values of several branches were undefined due to zero observed synonymous changes along the branch (dN/0). However, branches with S = 0 are not uninformative with respect to selection; they are likely to be evolving near neutral if N is small, and under positive selection if N is large. Therefore, to include these branches in our analyses, we assigned a value of dN/dS = 0.95 (near neutral) for branches with observed N : S ratios greater than 1 : 0 and less than 4 : 0. Likewise, we assigned a value of dN/dS = 2.0 to branches with observed N : S values greater than 4 : 0 to account for likely positive selection. We also obtain consistent results where a dN/dS value of 1.5 is assigned, instead of 2.0, to this latter class. These assignments were consistent among all gene groups to keep the relative differences of the median and mean dN/dS values consistent for each dataset.
Protein structure prediction analyses.
The secondary protein structure for each of the ORFs found to be under positive selection under the NSsites method was determined using the Phyre2 server (Kelley & Sternber, 2009). The full-length FV3 amino acid sequence for each ORF was used as the input sequence for the analysis. The predicted domains, secondary structure and disorder were determined and a relative confidence value for each component was calculated. The positively selected sites identified by the NSsites methods were then mapped onto the predicted secondary structure of the protein.
Acknowledgements
The authors would like to thank the Cannatella, Hillis and Sawyer laboratory groups for helpful comments on the manuscript. We would also like to thank Emily McTavish for assistance with simulation analysis. This work was supported by a grant from the National Institutes of Health (R01-GM-093086) to S. L. S. A. J. A. was supported on an NSF IGERT fellowship in Computational Phylogenetics and Applications to Biology, and an NSF Graduate Research fellowship. S. L. S. holds a Career Award in the Biomedical Sciences from the Burroughs Wellcome Fund, and is an Alfred P. Sloan Research Fellow in Computational and Evolutionary Molecular Biology.
Footnotes
One supplementary table and four figures are available with the online version of this paper.
References
- Anisimova M., Bielawski J. P., Yang Z. (2001). Accuracy and power of the likelihood ratio test in detecting adaptive molecular evolution. Mol Biol Evol 18, 1585–1592 10.1093/oxfordjournals.molbev.a003945 [DOI] [PubMed] [Google Scholar]
- Bandín I., Dopazo C. (2011). Host range, host specificity and hypothesized host shift events among viruses of lower vertebrates. Vet Res 42, 67 10.1186/1297-9716-42-67 [DOI] [PMC free article] [PubMed] [Google Scholar]
- Bayley A. E., Hill B. J., Feist S. W. (2013). Susceptibility of the European common frog Rana temporaria to a panel of ranavirus isolates from fish and amphibian hosts. Dis Aquat Organ 103, 171–183 10.3354/dao02574 [DOI] [PubMed] [Google Scholar]
- Bhatt S., Lam T. T., Lycett S. J., Leigh Brown A. J., Bowden T. A., Holmes E. C., Guan Y., Wood J. L., Brown I. H. & other authors (2013). The evolutionary dynamics of influenza A virus adaptation to mammalian hosts. Philos Trans R Soc Lond B Biol Sci 368, 20120382 10.1098/rstb.2012.0382 [DOI] [PMC free article] [PubMed] [Google Scholar]
- Chen G., Ward B. M., Yu K. H., Chinchar V. G., Robert J. (2011). Improved knockout methodology reveals that frog virus 3 mutants lacking either the 18K immediate-early gene or the truncated vIF-2α gene are defective for replication and growth in vivo. J Virol 85, 11131–11138 10.1128/JVI.05589-11 [DOI] [PMC free article] [PubMed] [Google Scholar]
- Chinchar V. G. (2002). Ranaviruses (family Iridoviridae): emerging cold-blooded killers. Arch Virol 147, 447–470 10.1007/s007050200000 [DOI] [PubMed] [Google Scholar]
- Chinchar V. G., Hyatt A., Miyazaki T., Williams T. (2009). Family Iridoviridae: poor viral relations no longer. Curr Top Microbiol Immunol 328, 123–170 10.1007/978-3-540-68618-7_4 [DOI] [PubMed] [Google Scholar]
- Choe H., Jemielity S., Abraham J., Radoshitzky S. R., Farzan M. (2011). Transferrin receptor 1 in the zoonosis and pathogenesis of New World hemorrhagic fever arenaviruses. Curr Opin Microbiol 14, 476–482 10.1016/j.mib.2011.07.014 [DOI] [PMC free article] [PubMed] [Google Scholar]
- Collins J., Storfer A. (2003). Global amphibian declines: sorting the hypotheses. Divers Distrib 9, 89–98 10.1046/j.1472-4642.2003.00012.x [DOI] [Google Scholar]
- Daszak P., Berger L., Cunningham A. A., Hyatt A. D., Green D. E., Speare R. (1999). Emerging infectious diseases and amphibian population declines. Emerg Infect Dis 5, 735–748 10.3201/eid0506.990601 [DOI] [PMC free article] [PubMed] [Google Scholar]
- Delport W., Poon A. F., Frost S. D., Kosakovsky Pond S. L. (2010). Datamonkey 2010: a suite of phylogenetic analysis tools for evolutionary biology. Bioinformatics 26, 2455–2457 10.1093/bioinformatics/btq429 [DOI] [PMC free article] [PubMed] [Google Scholar]
- Demogines A., Farzan M., Sawyer S. L. (2012a). Evidence for ACE2-utilizing coronaviruses (CoVs) related to severe acute respiratory syndrome CoV in bats. J Virol 86, 6350–6353 10.1128/JVI.00311-12 [DOI] [PMC free article] [PubMed] [Google Scholar]
- Demogines A., Truong K. A., Sawyer S. L. (2012b). Species-specific features of DARC, the primate receptor for Plasmodium vivax and Plasmodium knowlesi. Mol Biol Evol 29, 445–449 10.1093/molbev/msr204 [DOI] [PMC free article] [PubMed] [Google Scholar]
- Demogines A., Abraham J., Choe H., Farzan M., Sawyer S. L. (2013). Dual host-virus arms races shape an essential housekeeping protein. PLoS Biol 11, e1001571 10.1371/journal.pbio.1001571 [DOI] [PMC free article] [PubMed] [Google Scholar]
- Do J. W., Moon C. H., Kim H. J., Ko M. S., Kim S. B., Son J. H., Kim J. S., An E. J., Kim M. K. & other authors (2004). Complete genomic DNA sequence of rock bream iridovirus. Virology 325, 351–363 10.1016/j.virol.2004.05.008 [DOI] [PubMed] [Google Scholar]
- Eaton H., Metcalf J., Penny E., Tcherepanove V., Upton C., Brunetti C. R. (2007). Comparative genomic analysis of the family Iridoviridae: re-annotating and defining the core set of iridovirus genes. Virol J 4, 11–17 10.1186/1743-422X-4-11 [DOI] [PMC free article] [PubMed] [Google Scholar]
- Elde N. C., Child S. J., Eickbush M. T., Kitzman J. O., Rogers K. S., Shendure J., Geballe A. P., Malik H. S. (2012). Poxviruses deploy genomic accordions to adapt rapidly against host antiviral defenses. Cell 150, 831–841 10.1016/j.cell.2012.05.049 [DOI] [PMC free article] [PubMed] [Google Scholar]
- Endo T., Ikeo K., Gojobori T. (1996). Large-scale search for genes on which positive selection may operate. Mol Biol Evol 13, 685–690 10.1093/oxfordjournals.molbev.a025629 [DOI] [PubMed] [Google Scholar]
- Gifford R. J. (2011). Viral evolution in deep time: lentiviruses and mammals. Trends Genet 28, 89–100 10.1016/j.tig.2011.11.003 [DOI] [PubMed] [Google Scholar]
- Goldman N., Yang Z. (1994). A codon-based model of nucleotide substitution for protein-coding DNA sequences. Mol Biol Evol 11, 725–736 [DOI] [PubMed] [Google Scholar]
- Grayfer L., Andino F. J., Chen G., Chinchar G. V., Robert J. (2012). Immune evasion strategies of ranaviruses and innate immune responses to these emerging pathogens. Viruses 4, 1075–1092 10.3390/v4071075 [DOI] [PMC free article] [PubMed] [Google Scholar]
- Harrison R. L., Bonning B. C. (2004). Application of maximum-likelihood models to selection pressure analysis of group I nucleopolyhedrovirus genes. J Gen Virol 85, 197–210 10.1099/vir.0.19556-0 [DOI] [PubMed] [Google Scholar]
- He J. G., Deng M., Weng S. P., Li Z., Zhou S. Y., Long Q. X., Wang X. Z., Chan S. M. (2001). Complete genome analysis of the mandarin fish infectious spleen and kidney necrosis iridovirus. Virology 291, 126–139 10.1006/viro.2001.1208 [DOI] [PubMed] [Google Scholar]
- He J. G., Lü L., Deng M., He H. H., Weng S. P., Wang X. H., Zhou S. Y., Long Q. X., Wang X. Z., Chan S. M. (2002). Sequence analysis of the complete genome of an iridovirus isolated from the tiger frog. Virology 292, 185–197 10.1006/viro.2001.1245 [DOI] [PubMed] [Google Scholar]
- Herfst S., Schrauwen E. J., Linster M., Chutinimitkul S., de Wit E., Munster V. J., Sorrell E. M., Bestebroer T. M., Burke D. F. & other authors (2012). Airborne transmission of influenza A/H5N1 virus between ferrets. Science 336, 1534–1541 10.1126/science.1213362 [DOI] [PMC free article] [PubMed] [Google Scholar]
- Hoelzer K., Shackelton L. A., Parrish C. R., Holmes E. C. (2008). Phylogenetic analysis reveals the emergence, evolution and dispersal of carnivore parvoviruses. J Gen Virol 89, 2280–2289 10.1099/vir.0.2008/002055-0 [DOI] [PMC free article] [PubMed] [Google Scholar]
- Huang Y., Huang X., Liu H., Gong J., Ouyang Z., Cui H., Cao J., Zhao Y., Wang X. & other authors (2009). Complete sequence determination of a novel reptile iridovirus isolated from soft-shelled turtle and evolutionary analysis of Iridoviridae. BMC Genomics 10, 224 10.1186/1471-2164-10-224 [DOI] [PMC free article] [PubMed] [Google Scholar]
- Jancovich J. K., Mao J., Chinchar V. G., Wyatt C., Case S. T., Kumar S., Valente G., Subramanian S., Davidson E. W. & other authors (2003). Genomic sequence of a ranavirus (family Iridoviridae) associated with salamander mortalities in North America. Virology 316, 90–103 10.1016/j.virol.2003.08.001 [DOI] [PubMed] [Google Scholar]
- Jancovich J. K., Davidson E. W., Parameswaran N., Mao J., Chinchar V. G., Collins J. P., Jacobs B. L., Storfer A. (2005). Evidence for emergence of an amphibian iridoviral disease because of human-enhanced spread. Mol Ecol 14, 213–224 10.1111/j.1365-294X.2004.02387.x [DOI] [PubMed] [Google Scholar]
- Jancovich J. K., Bremont M., Touchman J. W., Jacobs B. L. (2010). Evidence for multiple recent host species shifts among the ranaviruses (family Iridoviridae). J Virol 84, 2636–2647 10.1128/JVI.01991-09 [DOI] [PMC free article] [PubMed] [Google Scholar]
- Kaelber J. T., Demogines A., Harbison C. E., Allison A. B., Goodman L. B., Ortega A. N., Sawyer S. L., Parrish C. R. (2012). Evolutionary reconstructions of the transferrin receptor of Caniforms supports canine parvovirus being a re-emerged and not a novel pathogen in dogs. PLoS Pathog 8, e1002666 10.1371/journal.ppat.1002666 [DOI] [PMC free article] [PubMed] [Google Scholar]
- Kelley L. A., Sternberg M. J. (2009). Protein structure prediction on the Web: a case study using the Phyre server. Nat Protoc 4, 363–371 10.1038/nprot.2009.2 [DOI] [PubMed] [Google Scholar]
- Kosakovsky Pond S. L., Posada D., Gravenor M. B., Woelk C. H., Frost S. D. (2006). gard: a genetic algorithm for recombination detection. Bioinformatics 22, 3096–3098 10.1093/bioinformatics/btl474 [DOI] [PubMed] [Google Scholar]
- Kosiol C., Vinar T., da Fonseca R. R., Hubisz M. J., Bustamante C. D., Nielsen R., Siepel A. (2008). Patterns of positive selection in six mammalian genomes. PLoS Genet 4, e1000144 10.1371/journal.pgen.1000144 [DOI] [PMC free article] [PubMed] [Google Scholar]
- Larkin M. A., Blackshields G., Brown N. P., Chenna R., McGettigan P. A., McWilliam H., Valentin F., Wallace I. M., Wilm A. & other authors (2007). Clustal W and Clustal X version 2.0. Bioinformatics 23, 2947–2948 10.1093/bioinformatics/btm404 [DOI] [PubMed] [Google Scholar]
- Lei X. Y., Ou T., Zhu R. L., Zhang Q. Y. (2012). Sequencing and analysis of the complete genome of Rana grylio virus (RGV). Arch Virol 157, 1559–1564 10.1007/s00705-012-1316-9 [DOI] [PubMed] [Google Scholar]
- Lesbarrères D., Balseiro A., Brunner J., Chinchar V. G., Duffus A., Kerby J., Miller D. L., Robert J., Schock D. M. & other authors (2012). Ranavirus: past, present and future. Biol Lett 8, 481–483 10.1098/rsbl.2011.0951 [DOI] [PMC free article] [PubMed] [Google Scholar]
- Lü L., Zhou S. Y., Chen C., Weng S. P., Chan S. M., He J. G. (2005). Complete genome sequence analysis of an iridovirus isolated from the orange-spotted grouper, Epinephelus coioides. Virology 339, 81–100 10.1016/j.virol.2005.05.021 [DOI] [PubMed] [Google Scholar]
- Mao J., Green D. E., Fellers G., Chinchar V. G. (1999). Molecular characterization of iridoviruses isolated from sympatric amphibians and fish. Virus Res 63, 45–52 10.1016/S0168-1702(99)00057-X [DOI] [PubMed] [Google Scholar]
- Mavian C., López-Bueno A., Balseiro A., Casais R., Alcamí A., Alejo A. (2012a). The genome sequence of the emerging common midwife toad virus identifies an evolutionary intermediate within ranaviruses. J Virol 86, 3617–3625 10.1128/JVI.07108-11 [DOI] [PMC free article] [PubMed] [Google Scholar]
- Mavian C., López-Bueno A., Fernández Somalo M. P., Alcamí A., Alejo A. (2012b). Complete genome sequence of the European sheatfish virus. J Virol 86, 6365–6366 10.1128/JVI.00618-12 [DOI] [PMC free article] [PubMed] [Google Scholar]
- McLysaght A., Baldi P. F., Gaut B. S. (2003). Extensive gene gain associated with adaptive evolution of poxviruses. Proc Natl Acad Sci U S A 100, 15655–15660 10.1073/pnas.2136653100 [DOI] [PMC free article] [PubMed] [Google Scholar]
- Meyerson N., Sawyer S. (2011). Two-stepping through time: mammals and viruses. Trends Microbiol 9, 286–294 10.1073/pnas.2136653100 [DOI] [PMC free article] [PubMed] [Google Scholar]
- Miller D., Gray M., Storfer A. (2011). Ecopathology of ranaviruses infecting amphibians. Viruses 3, 2351–2373 10.3390/v3112351 [DOI] [PMC free article] [PubMed] [Google Scholar]
- Nielsen R., Yang Z. (1998). Likelihood models for detecting positively selected amino acid sites and applications to the HIV-1 envelope gene. Genetics 148, 929–936 [DOI] [PMC free article] [PubMed] [Google Scholar]
- Nilsson J., Grahn M., Wright A. P. (2011). Proteome-wide evidence for enhanced positive Darwinian selection within intrinsically disordered regions in proteins. Genome Biol 12, R65 10.1186/gb-2011-12-7-r65 [DOI] [PMC free article] [PubMed] [Google Scholar]
- Parrish C. R., Holmes E. C., Morens D. M., Park E. C., Burke D. S., Calisher C. H., Laughlin C. A., Saif L. J., Daszak P. (2008). Cross-species virus transmission and the emergence of new epidemic diseases. Microbiol Mol Biol Rev 72, 457–470 10.1128/MMBR.00004-08 [DOI] [PMC free article] [PubMed] [Google Scholar]
- Picco A. M., Collins J. P. (2008). Amphibian commerce as a likely source of pathogen pollution. Conserv Biol 22, 1582–1589 10.1111/j.1523-1739.2008.01025.x [DOI] [PubMed] [Google Scholar]
- Rachowicz L., Hero J., Alford R., Taylor J., Morgan J., Vredenburg V., Collins J., Briggs C. (2005). The novel and endemic pathogen hypotheses: competing explanations for the origin of emerging infectious diseases of wildlife. Conserv Biol 19, 1441–1448 10.1111/j.1523-1739.2005.00255.x [DOI] [Google Scholar]
- Ridenhour B., Storfer A. (2008). Geographically variable selection in Ambystoma tigrinum virus (Iridoviridae) throughout the western USA. J Evolution Biol 21, 1151–1159 10.1111/j.1523-1739.2005.00255.x [DOI] [PubMed] [Google Scholar]
- Sabeti P. C., Schaffner S. F., Fry B., Lohmueller J., Varilly P., Shamovsky O., Palma A., Mikkelsen T. S., Altshuler D., Lander E. S. (2006). Positive natural selection in the human lineage. Science 312, 1614–1620 10.1126/science.1124309 [DOI] [PubMed] [Google Scholar]
- Sawyer S. L., Elde N. C. (2012). A cross-species view on viruses. Curr Opin Virol 2, 561–568 10.1016/j.coviro.2012.07.003 [DOI] [PMC free article] [PubMed] [Google Scholar]
- Shackelton L. A., Parrish C. R., Truyen U., Holmes E. C. (2005). High rate of viral evolution associated with the emergence of carnivore parvovirus. Proc Natl Acad Sci U S A 102, 379–384 10.1073/pnas.0406765102 [DOI] [PMC free article] [PubMed] [Google Scholar]
- Slobedman B., Barry P. A., Spencer J. V., Avdic S., Abendroth A. (2009). Virus-encoded homologs of cellular interleukin-10 and their control of host immune function. J Virol 83, 9618–9629 10.1128/JVI.01098-09 [DOI] [PMC free article] [PubMed] [Google Scholar]
- Song W. J., Qin Q. W., Qiu J., Huang C. H., Wang F., Hew C. L. (2004). Functional genomics analysis of Singapore grouper iridovirus: complete sequence determination and proteomic analysis. J Virol 78, 12576–12590 10.1128/JVI.78.22.12576-12590.2004 [DOI] [PMC free article] [PubMed] [Google Scholar]
- Stamatakis A. (2006). RAxML-VI-HPC: maximum likelihood-based phylogenetic analyses with thousands of taxa and mixed models. Bioinformatics 22, 2688–2690 10.1093/bioinformatics/btl446 [DOI] [PubMed] [Google Scholar]
- Stuart S. N., Chanson J. S., Cox N. A., Young B. E., Rodrigues A. S., Fischman D. L., Waller R. W. (2004). Status and trends of amphibian declines and extinctions worldwide. Science 306, 1783–1786 10.1126/science.1103538 [DOI] [PubMed] [Google Scholar]
- Tan W. G., Barkman T. J., Gregory Chinchar V., Essani K. (2004). Comparative genomic analyses of frog virus 3, type species of the genus Ranavirus (family Iridoviridae). Virology 323, 70–84 10.1016/j.virol.2004.02.019 [DOI] [PubMed] [Google Scholar]
- Tidona C. A., Darai G. (1997). The complete DNA sequence of lymphocystis disease virus. Virology 230, 207–216 10.1006/viro.1997.8456 [DOI] [PubMed] [Google Scholar]
- Tidona C., Darai G. (2000). Iridovirus homologues of cellular genes: implications for the molecular evolution of large DNA viruses. Virus Genes 21, 77–81 10.1006/viro.1997.8456 [DOI] [PubMed] [Google Scholar]
- Tsai C. T., Ting J. W., Wu M. H., Wu M. F., Guo I. C., Chang C. Y. (2005). Complete genome sequence of the grouper iridovirus and comparison of genomic organization with those of other iridoviruses. J Virol 79, 2010–2023 10.1128/JVI.79.4.2010-2023.2005 [DOI] [PMC free article] [PubMed] [Google Scholar]
- Wain L. V., Bailes E., Bibollet-Ruche F., Decker J. M., Keele B. F., Van Heuverswyn F., Li Y., Takehisa J., Ngole E. M. & other authors (2007). Adaptation of HIV-1 to its human host. Mol Biol Evol 24, 1853–1860 10.1093/molbev/msm110 [DOI] [PMC free article] [PubMed] [Google Scholar]
- Williams T., Barbosa-Solomieu V., Chinchar V. G. (2005). A decade of advances in iridovirus research. Adv Virus Res 65, 173–248 10.1016/S0065-3527(05)65006-3 [DOI] [PubMed] [Google Scholar]
- Yang Z. (1998). Likelihood ratio tests for detecting positive selection and application to primate lysozyme evolution. Mol Biol Evol 15, 568–573 10.1093/oxfordjournals.molbev.a025957 [DOI] [PubMed] [Google Scholar]
- Yang Z. (2007). paml 4: phylogenetic analysis by maximum likelihood. Mol Biol Evol 24, 1586–1591 10.1093/molbev/msm088 [DOI] [PubMed] [Google Scholar]
- Yang Z., Swanson W. J., Vacquier V. D. (2000). Maximum-likelihood analysis of molecular adaptation in abalone sperm lysin reveals variable selective pressures among lineages and sites. Mol Biol Evol 17, 1446–1455 10.1093/oxfordjournals.molbev.a026245 [DOI] [PubMed] [Google Scholar]
- Zhang Q. Y., Xiao F., Xie J., Li Z. Q., Gui J. F. (2004). Complete genome sequence of lymphocystis disease virus isolated from China. J Virol 78, 6982–6994 10.1128/JVI.78.13.6982-6994.2004 [DOI] [PMC free article] [PubMed] [Google Scholar]