

Abstract
Genome-wide association studies (GWAS) in diverse populations are needed to reveal variants that are more common and/or limited to defined populations. We conducted a GWAS of breast cancer in women of African ancestry, with genotyping of > 1,000,000 SNPs in 3,153 African American cases and 2,831 controls, and replication testing of the top 66 associations in an additional 3,607 breast cancer cases and 11,330 controls of African ancestry. Two of the 66 SNPs replicated (p < 0.05) in stage 2, which reached statistical significance levels of 10−6 and 10−5 in the stage 1 and 2 combined analysis (rs4322600 at chromosome 14q31: OR = 1.18, p = 4.3×10⁻⁶; rs10510333 at chromosome 3p26: OR = 1.15, p = 1.5×10⁻⁵). These suggestive risk loci have not been identified in previous GWAS in other populations and will need to be examined in additional samples. Identification of novel risk variants for breast cancer in women of African ancestry will demand testing of a substantially larger set of markers from stage 1 in a larger replication sample.
Keywords: GWAS, breast cancer, African ancestry, common genetic variation
Introduction
Genome-wide association studies (GWAS) of breast cancer have been conducted almost exclusively in populations of European ancestry, and have firmly established associations with a number of common susceptibility loci that contribute modest effects (relative risks ≤ 1.3) (Ahmed et al. 2009; Antoniou et al. 2010; Easton et al. 2007; Fletcher et al. 2011; Ghoussaini et al. 2012; Haiman et al. 2011b; Hunter et al. 2007b; Kim et al. 2012; Long et al. 2012; Stacey et al. 2007; Stacey et al. 2008; Thomas et al. 2009; Turnbull et al. 2010; Zheng et al. 2009b). These discoveries provide support for the polygenic model of breast cancer susceptibility (Pharoah et al. 2002), as well as clues as to important biological pathways involved in the pathogenesis of breast cancer. For example, the most strongly associated risk locus for breast cancer revealed through GWAS has been the region containing the fibroblast growth factor receptor 2 (FGFR2) at chromosome 10q26 (Easton et al. 2007; Hunter et al. 2007a; Meyer et al. 2008). FGFR2 is a member of the FGFR family of receptor tyrosine kinases (RTKs) which regulate cell proliferation, differentiation and apoptosis (Tenhagen et al. 2012). The risk variant on chromosome 14q24 is located in intron 12 of RAD51B which is a member of the RAD51 protein family. RAD51 proteins are essential for DNA repair by homologous recombination (Tarsounas et al. 2004), a DNA repair pathway with an established and important role in breast cancer development. A more recent study, which included African American subject from the current study, revealed a risk marker at the telomerase reverse transcriptase (TERT) locus (Haiman et al. 2011b), a protein that controls telomere length and is also implicated in oncogenesis (Kim et al. 1994). Many of the risk variants identified by GWAS, however, are located in gene deserts, or near genes with roles in breast cancer etiology that are currently unknown.
The search for additional low penetrance alleles for breast cancer in specific racial/ethnic populations has revealed additional variants that are important globally or more common and/or limited to defined populations. For example, a GWAS conducted among Chinese women identified a novel risk locus for breast cancer near the gene for the estrogen receptor (ER) on chromosome 6 which had not been revealed in previous, well-powered GWAS in populations of European ancestry (Zheng et al. 2009b). A GWAS of prostate cancer in men of African ancestry also identified a novel risk variant at 17q12 that is not observed in other populations (Haiman et al. 2011a). In search for risk variants for breast cancer that may be important to women of African ancestry, we analyzed > 1 million common SNPs in 3,153 African American breast cancer cases and 2,831 African American controls, and examined the most statistically significant associations in a second stage of 3,607 cases and 11,330 controls of African ancestry.
Materials and Methods
Study Populations
Stage 1 of the GWAS included African American participants from 9 epidemiological studies of breast cancer, comprising a total of 3,153 cases and 2,831 controls (cases/controls: The Multiethnic Cohort study (MEC), 734/1,003; The Los Angeles component of The Women’s Contraceptive and Reproductive Experiences (CARE) Study, 380/224; The Women’s Circle of Health Study (WCHS), 272/240; The San Francisco Bay Area Breast Cancer Study (SFBCS), 172/231; The Northern California Breast Cancer Family Registry (NC-BCFR), 440/53; The Carolina Breast Cancer Study (CBCS), 656/608; The Prostate, Lung, Colorectal, and Ovarian Cancer Screening Trial (PLCO) Cohort, 64/133; The Nashville Breast Health Study (NBHS), 310/186; and, The Wake Forest University Breast Cancer Study (WFBC), 125/153). Replication testing was conducted in an independent sample of 3,607 breast cancer cases and 11,330 controls from 9 additional studies of breast cancer in women of African ancestry (The Black Women’s Health Study (BWHS), 826/1,167; The Women’s Insights and Shared Experiences study (WISE), 174/458; NBHS/Southern Community Cohort (SCCS), 981/851; The Nigerian Breast Cancer Study (NBCS), 681/282; The Barbados National Cancer Study (BNCS), 93/244; The Racial Variability in Genotypic Determinants of Breast Cancer Risk Study (RVGBC), 151/272; The Baltimore Breast Cancer Study (BBCS), 117/111; The Chicago Cancer Prone Study (CCPS), 268/261; and, The Women’s Health Initiative (WHI), 316/7,484).
Sample size and selected characteristics for these studies are summarized in Supplemental Tables 1 and 2 and detailed information about the design and organization of each study is provided in Supporting Information.
Genotyping and Quality Control
Genotyping in stage 1 was conducted using the Illumina Human1M-Duo BeadChip. Of the 5,984 samples from these studies (3,153 cases and 2,831 controls), we attempted genotyping of 5,932, removing samples (n = 52) with DNA concentrations < 20 ng/ul. Following genotyping, we removed samples based on the following exclusion criteria: 1) unexpected replicates (≥ 98.9% genetically identical) that we were able to confirm through discussions with study investigators (only one of each replicate was removed, n = 15); 2) unknown replicates that we were not able to confirm (pair or triplicate removed, n = 14);3) samples with call rates < 95% after a second genotyping attempt (n = 100); 4) samples with ≤ 5% African ancestry (n = 36) (discussed below); and 5) samples with < 15% mean heterozygosity of SNPs on the X chromosome and/or similar mean allele intensities of SNPs on the X and Y chromosomes (n = 6) as these are likely to be males.
We removed SNPs with < 95% call rate (n = 21,732) or minor allele frequencies (MAFs) < 1% (n = 80,193). To assess genotyping reproducibility we included 138 known replicate samples; the average concordance rate was 99.95% (> 99.93% for all pairs). We also eliminated SNPs with genotyping concordance rates < 98% based on the replicates (n = 11,701). The final analysis dataset included 1,043,036 SNPs genotyped on 3,016 cases and 2,745 controls, with an average SNP call rate of 99.7% and average sample call rate of 99.8%. Hardy-Weinberg equilibrium (HWE) was not used as a criterion for removing SNPs; none of the SNPs selected for replication deviated from HWE in controls in each study (based on a cut-off of p < 0.001).
We selected 66 SNPs with p-values < 2×10⁻⁴ in stage 1 for evaluation in the second stage. These SNPs were selected from 53 regions following linkage disequilibrium (LD) pruning of correlated SNPs. Two of these SNPs were located near a previously validated breast cancer risk locus [rs12355688 at 10q22, 241 kb downstream of rs704010, r2 = 0 in both CEU and YRI populations from 1000 Genomes Project (March 2010 release) (Turnbull et al. 2010); and rs3745185 at 19p13, 10kb downstream of rs2363956, r2 = 0.57 and 0.19 in the CEU and YRI populations from 1000 Genomes Project (March 2010 release), respectively (Antoniou et al. 2010)]. Genotyping in the replication studies was performed using the Sequenom platform (BWHS), OpenArray (WISE and NBHS/SCCS), the Affymetrix 6.0 SNP array (WHI) (Hutter et al. 2011) and Illumina GoldenGate (all other studies) (see Supporting Information). Blinded duplicate samples (5–10%) were included in the replication studies and concordance of these samples was ≥ 98% in all studies. The number of SNPs that were genotyped successfully in each stage 2 study ranged from 51 to 63. The average call rate for all SNPs in stage 2 was 98.8% (range for call rates of a SNP within study: 71.4–100%). Call rates by SNP and study are shown in Supplemental Table 3.
Estimation of African Ancestry
In stage 1, we utilized STRUCTURE (Pritchard et al. 2000) to infer percent African ancestry on an individual level. A total of 2,546 ancestry-informative SNPs from the Illumina array were selected based on low inter-marker correlation and ability to differentiate between samples of African and European descent. In evaluating the distribution of the fraction of African ancestry across the stage 1 populations, statistically significant differences (ANOVA p < 10−16) were noted (Supplemental Figure 1). We also applied principal components analysis (PCA) (Price et al. 2006) to estimate axes of variation among the 5,761 individuals using the same 2,546 ancestry informative markers. The first eigenvector accounted for 10.1% of the variation between subjects, and subsequent eigenvectors accounted for no more than 0.5%. Using input genotypes from the HapMap populations, CEU (CEPH Utah), YRI (Yoruba), and JPT (Japanese), we determined that the first eigenvector captures clearly differentiates between Europeans (CEU) and West Africans (YRI) in the HapMap samples (Supplemental Figure 2).
Statistical Analysis
We examined the observed versus the expected distribution of the Chi-squared test statistics using a 1-degree of freedom (df) trend test, comparing genotype counts for each SNP in cases versus controls. All tests of statistical significance were two-sided. To improve coverage, we augmented the set of SNPs tested for association through imputation using MACH (Li and Abecasis 2006). Phased haplotypes from the120 CEU and 120 YRI founders in HapMap Phase 2 were used to infer genotypes of all Phase 2 SNPs that were not available on the Illumina 1M Duo or did not pass our quality control (QC) criteria. Odds ratios (OR) and 95% confidence intervals (CI) for each SNP were estimated using unconditional logistic regression, adjusting for age, the first eigenvector and study. The SFBCS and NC-BCFR studies were conducted in the same San Francisco Bay Area population and were combined in all analyses.
In the replication studies, ORs and 95% CIs for each SNP were estimated using unconditional logistic regression, adjusting for age, region within the WHI and estimated genetic ancestry. Ancestry information was available for all stage 2 studies except WISE (Supporting Information). Overall testing of single SNP associations was conducted via meta-analyses of results from the stage 1 and stage 2 studies.
We also conducted combined GWAS and admixture-based statistical tests to assess the contribution of local ancestry on the SNP associations. For each subject in our analysis, we inferred local ancestry, which defines the proportion of European and African ancestry at each genotyped and imputed SNP. To infer local ancestry in our GWAS panel of 5,761 African American women, we applied the program HAPMIX (Price et al. 2009). HAPMIX builds a Hidden Markov Model (HMM) using phased haplotype data that are representative of the two source populations assumed to be ancestral to the admixed (study) data. In this case, we provided the same HapMap dataset that was used for imputation (i.e. 240 CEU + YRI founder haplotypes per chromosome) as input. HAPMIX reports posterior probabilities for each subject at each SNP of carrying 0, 1 and 2 copies of a European allele.
Combined GWAS and admixture-based statistical tests were conducted to make inferences about regions of the genome that explain not only case-control differences in disease risk based on SNP associations, but also risk differences based on local genetic ancestry. We utilized the MIXSCORE program (Pasaniuc et al. 2011) which takes as input results from a GWAS scan and an admixture scan (specifically HAPMIX output), computes several statistics that incorporate allele frequency information from both sources of evidence. The SUM score is a 2-df Chi squared test that simultaneously tests for association (i.e. a case-control difference in allele frequency) and admixture evidence (i.e. a deviation from the genome-wide proportion of European ancestry). The MIX score also tests for both evidence of admixture and association, but assumes the odds ratios for admixture and association are equal, which is potentially more powerful when this assumption is true since it is a 1-df test.
Results
The stage 1 analysis included 3,016 cases and 2,745 controls among African American women from 9 epidemiological studies of breast cancer. The age of the cases and controls in stage 1 ranged from 22 to 87 years with the median ages being 55 and 58 years, respectively (Supplemental Table 1). The analysis of the most statistically significant associations from stage 1 was conducted in 3,533 cases and 11,046 controls from an additional 9 studies. The age of the cases and controls in stage 2 ranged from 18 to 92 years with the median ages being 50 and 53 years, respectively (Supplemental Table 2).
We observed no evidence of inflation of the test statistic (λ = 1.01) for the 1,043,036 genotyped and 2,067,098 imputed SNPs analyzed in stage 1, and no excess of very small p-values beyond what was expected (Figure 1). We observed no SNP to be associated with disease status at a genome-wide level of significance (p < 5×10⁻⁸) in stage 1 (Figure 2). The most statistically significant association was noted with SNP rs7610073 located in intron 2 of the gene GRM7 (metabotropic glutamate receptor 7) on chromosome 3p26 (risk allele frequency 0.64; OR per allele = 1.22; p = 7.4×10⁻⁷). A second signal was also noted ~486 kb upstream of GRM7 (rs10510333: risk allele frequency = 0.18; OR per allele = 1.24; p = 8.2×10⁻⁶). The associations with these 2 markers were independent and remained statistically significant when both were included in the same model (p-values of 8.3×10⁻⁷ and 9.3×10⁻⁶, respectively). Shown in Table 1 are the genotyped SNPs with p-values < 10−5 in stage 1, as well as SNPs that replicated in stage 2 (discussed below).
Fig. 1.
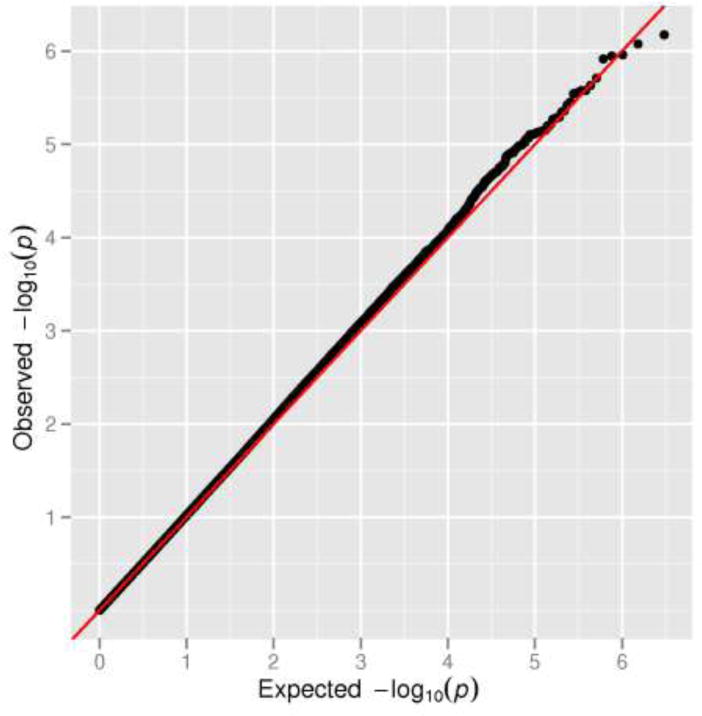
The distribution of observed versus expected -log10 p-values from stage 1 adjusted for age, study and the first principal component (PC1)
Fig. 2.
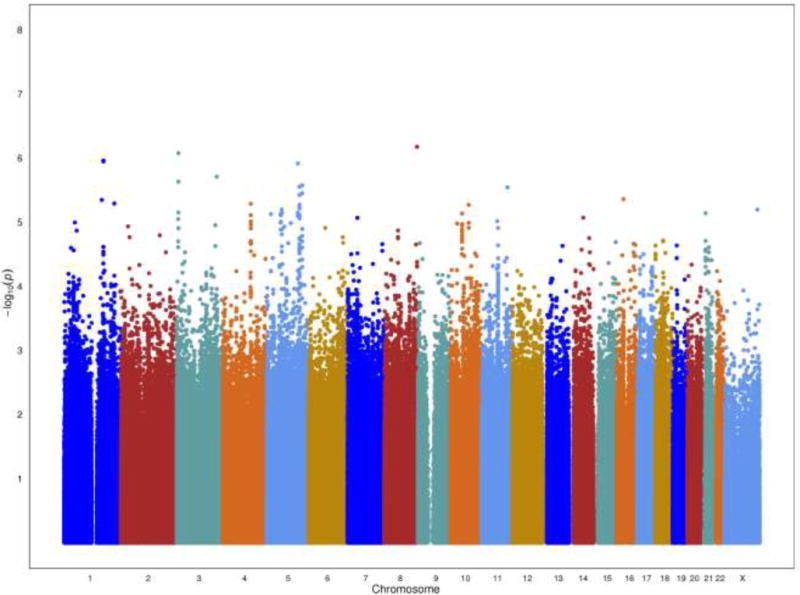
A Manhattan plot showing the -log10 p-values which test for case-control association to disease for genotyped and imputed SNPs by chromosome in stage 1
Table 1.
SNPs with p < 10−5 in stage 1 and SNPs that replicated at p < 0.05 in stage 2of the African American breast cancer GWAS
| Stage 1 3,016 cases, 2,745 controls |
Stage 2c 3,533 cases, 11,046 controls |
Stage 1 + Stage 2 6,549 cases, 13,791 controls |
||||||||
|---|---|---|---|---|---|---|---|---|---|---|
| SNP | Chr positiona | Nearest Genes | Risk Allele | RAFb | OR (95% CI) | p-value | OR (95% CI) | p-value | OR (95% CI) | p-value |
| rs7610073 | 3p26.1, 7275601 | GRM7 | A | 0.64 | 1.22 (1.13–1.32) | 7.5×10⁻⁷ | 0.95 (0.89–1.12) | 0.13 | 1.05 (1.00–1.11) | 0.045 |
| rs3861950 | 1q25.1, 171422915 | TNFSF4 | T | 0.22 | 1.27 (1.15–1.39) | 1.1×10⁻⁶ | 0.98 (0.91–1.06) | 0.63 | 1.09 (1.02–1.16) | 6.4×10⁻³ |
| rs6880837 | 5q31.2, 135424568 | TGFBI | C | 0.69 | 1.23 (1.13–1.34) | 1.8×10⁻⁶ | 0.96 (0.89–1.03) | 0.26 | 1.07 (1.01–1.13) | 0.027 |
| rs13074711 | 3q26.31, 173750497 | TNFSF10 | T | 0.68 | 1.22 (1.13–1.33) | 2.1×10⁻⁶ | 1.01 (0.93–1.10) | 0.78 | 1.11 (1.04–1.17) | 5.7×10⁻⁴ |
| rs2085421 | 11q23.2, 113395918 | HTR3A, ZBTB16 | A | 0.47 | 1.20 (1.11–1.29) | 3.4×10⁻⁶ | 0.99 (0.92–1.07) | 0.86 | 1.09 (1.03–1.15) | 1.7×10⁻³ |
| rs153170 | 5q31.3, 142257435 | ARHGAP26 | A | 0.71 | 1.22 (1.12–1.33) | 4.7×10⁻⁶ | 1.00 (0.93–1.07) | 0.94 | 1.09 (1.03–1.15) | 4.0×10⁻³ |
| rs13172733 | 5q31.3, 142351873 | ARHGAP26 | A | 0.69 | 1.22 (1.12–1.33) | 4.8×10⁻⁶ | 1.00 (0.91–1.08) | 0.92 | 1.10 (1.04–1.17) | 1.7×10⁻³ |
| rs12355688 | 10q22.3, 80725632 | ZMIZ1 | T | 0.20 | 1.24 (1.13–1.36) | 6.5×10⁻⁶ | 1.03 (0.95–1.12) | 0.43 | 1.12 (1.05–1.19) | 3.8×10⁻⁴ |
| rs10510333 | 3p26.1, 6391779 | GRM7 | T | 0.18 | 1.24 (1.13–1.36) | 8.2×10⁻⁶ | 1.08 (1.00–1.17) | 0.048 | 1.15 (1.08–1.22) | 1.5×10⁻⁵ |
| rs7727166 | 5q12.3 65676926 | SFRS12 | T | 0.16 | 1.25 (1.13–1.38) | 9.4×10⁻⁶ | 1.07 (0.98–1.17) | 0.11 | 1.15 (1.07–1.22) | 5.3×10⁻⁵ |
| rs4322600 | 14q31.3 87365353 | GALC | G | 0.78 | 1.22 (1.11–1.34) | 2.5×10⁻⁵ | 1.12 (1.01–1.25) | 0.036 | 1.18 (1.10–1.27) | 4.3×10⁻⁶ |
NCBI build 36.
Risk allele frequency (RAF) in stage 1.
The stage 2 studies contributing to the results for each SNP is shown in Supplemental Table 3.
We selected 66 genotyped SNPs with association p-values less than 2×10⁻⁴ for replication testing in the stage 2 studies. None of these SNPs replicated with stage 2-wide significance of < 0.0008 (0.05/66), but 2 replicated with a p-value < 0.05 and an OR in the same direction as that observed in stage 1 (Table 1). Combining results from stages 1 and 2, no SNP achieved genome-wide significance. The smallest combined p-values were noted for the two SNPs that replicated in stage 2: rs4322600 located ~100 kb upstream of the gene GALC (galactosylceramidase) on chromosome 14q31 (risk allele frequency = 0.78, OR per allele = 1.18, p = 4.3×10⁻⁶) and rs10510333 located ~486 kb upstream of GRM7 on chromosome 3p26 (risk allele frequency = 0.18, OR per allele = 1.15, p = 1.5×10⁻⁵) (Table 1). We found no strong statistical evidence that the associations with these two loci differ by ER status (p-values for heterogeneity in case-only testing: rs10510333: p = 0.67; rs4322600: p = 0.85)
Using the MIXSCORE program, we simultaneously tested the null hypothesis of no association and admixture at each loci defined by the 66 most significant variants identified in Stage 1. SNP rs7610073, which had the largest MIX score of 24.5 (p = 7.5×10⁻⁷) also had the smallest p-value in the first stage (Supplemental Table 4). The risk allele (the “A” allele for rs7610073) was not strongly differentiated (60% in HapMap YRI versus 81% in HapMap CEU) and the MIX score p-value was almost identical to the p-value from our association scan. Association p-values were generally stronger than the SUM or MIX score, so admixture did not make a substantive contribution in joint evidence of admixture and association for these 66 SNPs, as indicated in Supplemental Table 4. All together, these findings seem to indicate that the associations at the most significant loci in Stage 1 are not influenced by differences in local ancestry between cases and controls, meaning that any causal variants in these regions are not appreciably differentiated in frequency between cases and controls.
Discussion
Genome-wide studies of common and rare genetic variation conducted in multiple populations will be required to reveal the complete spectrum of susceptibility alleles that contribute to risk of breast cancer globally. In a genome-wide scan of common genetic variation in > 3,000 African American cases and > 2,700 controls, followed by replication testing of the most significant associations (p < 2×10⁻⁴) in an independent set of > 3,500 cases and > 11,000 controls, we identified two suggestive associations with breast cancer risk that replicated in stage 2 at p < 0.05 [chromosome 14q31 (p = 4.3×10⁻⁶) and 3p26 (p = 1.5×10⁻⁵)]; however, these associations did not reach the standard level of genome-wide significance. These regions have not been highlighted in previous GWAS conducted in other racial/ethnic populations and each association requires further validation in additional studies.
Populations of African ancestry have greater genetic diversity and lower levels of LD among chromosomal loci (Campbell and Tishkoff 2008; Reed and Tishkoff 2006). Because of LD patterns and allele frequencies that differ from non-African populations, GWAS results from European or Asian populations are not always replicable in populations of African ancestry (Chen et al. 2010; Huo et al. 2012; Hutter et al. 2011; Ruiz-Narvaez et al. 2010; Zheng et al. 2009a). Fine-mapping of known breast cancer risk loci in populations of African ancestry have revealed risk-associated markers that are more relevant to African populations and contribute to modeling of genetic risk in this population (Chen et al. 2011; Ruiz-Narvaez et al. 2010; Udler et al. 2009). Large GWAS in populations of African ancestry, with proper control of population structure, will be required to discover additional disease susceptibility variants that better define the genetic profile of breast cancer in this population.
A strength of the present study is that it includes most existing case-control studies of breast cancer conducted in women of African ancestry. In this 2-stage design, we had 80% statistical power to identify a common risk variant (frequency of ≥ 10%) that conveys a risk per allele of 1.3 at genome-wide significance (p = 5×10⁻⁸). Thus, we were able to rule out variants with large effects if they were among the top 0.007% in stage 1 (and thus taken to stage 2) and were adequately tagged by the common SNPs on the 1M array. However, we are likely to have missed some milder associations. In previous GWAS of breast cancer in European ancestry populations, most risk variants eventually identified were not among the most statistically significant in stage 1 and were only revealed through testing of large numbers of SNPs in additional replication stages. To identify novel risk loci for breast cancer in African ancestry populations will require continued collaborative efforts and investigators willing to test larger numbers of SNPs in their respective studies.
Our attempt to apply joint admixture and association mapping, using MIXSCORE, did not provide additional suggestive risk variants beyond those found using association methods alone. This suggests that the associations observed at the most significant regions in Stage 1 are not weakened by ancestry differences between cases and controls, and thus, the biologically functional alleles are unlikely to be highly differentiated in frequency between cases and controls. Because of the limited number of ER-negative cases in stage 1 (n = 988) and stage 2 (n = 423) the statistical power to look at subtypes with rate differences (e.g. ER-negative disease, more common in African American than European American women) was limited and not attempted for GWAS or admixture testing. However, in collaboration with GWAS of ER-negative breast cancer in European ancestry populations, which have substantially larger numbers of ER-negative cases, we have identified a novel locus for ER-negative breast cancer at 5p15 (TERT) (Haiman et al. 2011b). Genetic variation at this locus may contribute in part to the higher incidence of ER-negative disease subtypes in women of African ancestry (frequency of 0.56 in African Americans and frequency of 0.26 in Whites) (Haiman et al. 2011b). As for the analysis of overall breast cancer, larger studies of breast cancer in women of African ancestry will be needed to search for novel risk loci for ER-negative disease subtypes that are important for and may be limited to this population.
This study is the first genome-wide investigation of common genetic variation in relationship with breast cancer risk in women of African ancestry. The suggestive associations noted with risk variants at 14q31 and 3p26 require further validation in additional samples of African ancestry as well as in other populations. Identification of common risk variants for breast cancer in African ancestry populations will require testing a larger number of the most statistically significant SNPs from stage 1 in additional samples.
Supplementary Material
Acknowledgments
This work was supported by a Department of Defense Breast Cancer Research Program Era of Hope Scholar Award to CAH [W81XWH-08-1-0383] and the Norris Foundation. Each of the participating studies was supported by the following grants: MEC (National Institutes of Health grants R01-CA63464 and R37-CA54281); CARE (National Institute for Child Health and Development grant NO1-HD-3-3175, K05 CA136967); WCHS (U.S. Army Medical Research and Material Command (USAMRMC) grant DAMD-17-01-0-0334, the National Institutes of Health grant R01-CA100598, and the Breast Cancer Research Foundation); SFBCS (National Institutes of Health grant R01-CA77305 and United States Army Medical Research Program grant DAMD17-96-6071); NC-BCFR (National Institutes of Health grant U01-CA69417); CBCS (National Institutes of Health Specialized Program of Research Excellence in Breast Cancer, grant number P50-CA58223, and Center for Environmental Health and Susceptibility National Institute of Environmental Health Sciences, National Institutes of Health, grant number P30-ES10126); PLCO (Intramural Research Program, National Cancer Institute, National Institutes of Health); NBHS (National Institutes of Health grantR01-CA100374); SCCS (National Institutes of Health grant R01-CA092447), WFBC (National Institutes of Health grant R01-CA73629); BWHS (National Institutes of Health grants R01-CA58420 and R01-CA98663) and WISE (National Institutes of Health grant P01-CA77596). OI Olopade and D Huo were supported by National Institutes of Health Specialized Program of Research Excellence in Breast Cancer, grant number P50-CA125183 and National Cancer Institute R01-CA141712. BBCS is supported by the Intramural Research Program of the NIH, National Cancer Institute, Center for Cancer Research. The Breast Cancer Family Registry (BCFR) was supported by the National Cancer Institute, National Institutes of Health under RFA-CA-06-503 and through cooperative agreements with members of the Breast Cancer Family Registry and Principal Investigators. The content of this manuscript does not necessarily reflect the views or policies of the National Cancer Institute or any of the collaborating centers in the BCFR, nor does mention of trade names, commercial products, or organizations imply endorsement by the U.S. Government or the BCFR. The WHI program is funded by the National Heart, Lung, and Blood Institute, National Institute of Health, U.S. Department of Health and Human Services through contracts N01WH22110, 24152, 32100-2, 32105-6, 32108-9, 32111-13, 32115, 32118-32119, 32122, 42107-26, 42129-32, and 44221. Funding for WHI SHARe genotyping was provided by NHLBI Contract N02-HL-64278.
We thank the women who volunteered to participate in each study. We also thank Madhavi Eranti, Andrea Holbrook, Paul Poznaik, David Wong and Lucy Xia from the University of Southern California for their technical support. We would also like to acknowledge co-investigators from the WCHS study: Dana H. Bovbjerg (University of Pittsburgh), Lina Jandorf (Mount Sinai School of Medicine) and Gregory Ciupak, Warren Davis, Gary Zirpoli, Song Yao and Michelle Roberts from Roswell Park Cancer Institute.
Footnotes
Ethnical statement: The experiments done in this manuscript comply with the current laws of the country of USA.
Conflict of interest: The authors declare that they have no conflict of interest.
References
- Ahmed S, Thomas G, Ghoussaini M, Healey CS, Humphreys MK, Platte R, Morrison J, Maranian M, Pooley KA, Luben R, Eccles D, Evans DG, Fletcher O, Johnson N, dos Santos Silva I, Peto J, Stratton MR, Rahman N, Jacobs K, Prentice R, Anderson GL, Rajkovic A, Curb JD, Ziegler RG, Berg CD, Buys SS, McCarty CA, Feigelson HS, Calle EE, Thun MJ, Diver WR, Bojesen S, Nordestgaard BG, Flyger H, Dork T, Schurmann P, Hillemanns P, Karstens JH, Bogdanova NV, Antonenkova NN, Zalutsky IV, Bermisheva M, Fedorova S, Khusnutdinova E, Kang D, Yoo KY, Noh DY, Ahn SH, Devilee P, van Asperen CJ, Tollenaar RA, Seynaeve C, Garcia-Closas M, Lissowska J, Brinton L, Peplonska B, Nevanlinna H, Heikkinen T, Aittomaki K, Blomqvist C, Hopper JL, Southey MC, Smith L, Spurdle AB, Schmidt MK, Broeks A, van Hien RR, Cornelissen S, Milne RL, Ribas G, Gonzalez-Neira A, Benitez J, Schmutzler RK, Burwinkel B, Bartram CR, Meindl A, Brauch H, Justenhoven C, Hamann U, Chang-Claude J, Hein R, Wang-Gohrke S, Lindblom A, Margolin S, Mannermaa A, Kosma VM, Kataja V, Olson JE, Wang X, Fredericksen Z, Giles GG, Severi G, Baglietto L, English DR, Hankinson SE, Cox DG, Kraft P, Vatten LJ, Hveem K, Kumle M, et al. Newly discovered breast cancer susceptibility loci on 3p24 and 17q23.2. Nat Genet. 2009;41:585–90. doi: 10.1038/ng.354. doi: ng.354 [pii] 10.1038/ng.354. [DOI] [PMC free article] [PubMed] [Google Scholar]
- Antoniou AC, Wang X, Fredericksen ZS, McGuffog L, Tarrell R, Sinilnikova OM, Healey S, Morrison J, Kartsonaki C, Lesnick T, Ghoussaini M, Barrowdale D, Peock S, Cook M, Oliver C, Frost D, Eccles D, Evans DG, Eeles R, Izatt L, Chu C, Douglas F, Paterson J, Stoppa-Lyonnet D, Houdayer C, Mazoyer S, Giraud S, Lasset C, Remenieras A, Caron O, Hardouin A, Berthet P, Hogervorst FB, Rookus MA, Jager A, van den Ouweland A, Hoogerbrugge N, van der Luijt RB, Meijers-Heijboer H, Gomez Garcia EB, Devilee P, Vreeswijk MP, Lubinski J, Jakubowska A, Gronwald J, Huzarski T, Byrski T, Gorski B, Cybulski C, Spurdle AB, Holland H, Goldgar DE, John EM, Hopper JL, Southey M, Buys SS, Daly MB, Terry MB, Schmutzler RK, Wappenschmidt B, Engel C, Meindl A, Preisler-Adams S, Arnold N, Niederacher D, Sutter C, Domchek SM, Nathanson KL, Rebbeck T, Blum JL, Piedmonte M, Rodriguez GC, Wakeley K, Boggess JF, Basil J, Blank SV, Friedman E, Kaufman B, Laitman Y, Milgrom R, Andrulis IL, Glendon G, Ozcelik H, Kirchhoff T, Vijai J, Gaudet MM, Altshuler D, Guiducci C, Loman N, Harbst K, Rantala J, Ehrencrona H, Gerdes AM, Thomassen M, Sunde L, Peterlongo P, Manoukian S, Bonanni B, Viel A, Radice P, et al. A locus on 19p13 modifies risk of breast cancer in BRCA1 mutation carriers and is associated with hormone receptor-negative breast cancer in the general population. Nat Genet. 2010;42:885–92. doi: 10.1038/ng.669. doi: ng.669 [pii] 10.1038/ng.669. [DOI] [PMC free article] [PubMed] [Google Scholar]
- Campbell MC, Tishkoff SA. African genetic diversity: implications for human demographic history, modern human origins, and complex disease mapping. Annu Rev Genomics Hum Genet. 2008;9:403–33. doi: 10.1146/annurev.genom.9.081307.164258. [DOI] [PMC free article] [PubMed] [Google Scholar]
- Chen F, Chen GK, Millikan RC, John EM, Ambrosone CB, Bernstein L, Zheng W, Hu JJ, Ziegler RG, Deming SL, Bandera EV, Nyante S, Palmer JR, Rebbeck TR, Ingles SA, Press MF, Rodriguez-Gil JL, Chanock SJ, Le Marchand L, Kolonel LN, Henderson BE, Stram DO, Haiman CA. Fine-mapping of breast cancer susceptibility loci characterizes genetic risk in African Americans. Hum Mol Genet. 2011;20:4491–503. doi: 10.1093/hmg/ddr367. doi: ddr367 [pii] 10.1093/hmg/ddr367. [DOI] [PMC free article] [PubMed] [Google Scholar]
- Chen F, Stram DO, Le Marchand L, Monroe KR, Kolonel LN, Henderson BE, Haiman CA. Caution in generalizing known genetic risk markers for breast cancer across all ethnic/racial populations. Eur J Hum Genet. 2010;19:243–245. doi: 10.1038/ejhg.2010.185. [DOI] [PMC free article] [PubMed] [Google Scholar]
- Easton DF, Pooley KA, Dunning AM, Pharoah PD, Thompson D, Ballinger DG, Struewing JP, Morrison J, Field H, Luben R, Wareham N, Ahmed S, Healey CS, Bowman R, Meyer KB, Haiman CA, Kolonel LK, Henderson BE, Le Marchand L, Brennan P, Sangrajrang S, Gaborieau V, Odefrey F, Shen CY, Wu PE, Wang HC, Eccles D, Evans DG, Peto J, Fletcher O, Johnson N, Seal S, Stratton MR, Rahman N, Chenevix-Trench G, Bojesen SE, Nordestgaard BG, Axelsson CK, Garcia-Closas M, Brinton L, Chanock S, Lissowska J, Peplonska B, Nevanlinna H, Fagerholm R, Eerola H, Kang D, Yoo KY, Noh DY, Ahn SH, Hunter DJ, Hankinson SE, Cox DG, Hall P, Wedren S, Liu J, Low YL, Bogdanova N, Schurmann P, Dork T, Tollenaar RA, Jacobi CE, Devilee P, Klijn JG, Sigurdson AJ, Doody MM, Alexander BH, Zhang J, Cox A, Brock IW, MacPherson G, Reed MW, Couch FJ, Goode EL, Olson JE, Meijers-Heijboer H, van den Ouweland A, Uitterlinden A, Rivadeneira F, Milne RL, Ribas G, Gonzalez-Neira A, Benitez J, Hopper JL, McCredie M, Southey M, Giles GG, Schroen C, Justenhoven C, Brauch H, Hamann U, Ko YD, Spurdle AB, Beesley J, Chen X, Mannermaa A, Kosma VM, Kataja V, Hartikainen J, Day NE, et al. Genome-wide association study identifies novel breast cancer susceptibility loci. Nature. 2007;447:1087–93. doi: 10.1038/nature05887. doi: nature05887 [pii] 10.1038/nature05887. [DOI] [PMC free article] [PubMed] [Google Scholar]
- Fletcher O, Johnson N, Orr N, Hosking FJ, Gibson LJ, Walker K, Zelenika D, Gut I, Heath S, Palles C, Coupland B, Broderick P, Schoemaker M, Jones M, Williamson J, Chilcott-Burns S, Tomczyk K, Simpson G, Jacobs KB, Chanock SJ, Hunter DJ, Tomlinson IP, Swerdlow A, Ashworth A, Ross G, dos Santos Silva I, Lathrop M, Houlston RS, Peto J. Novel breast cancer susceptibility locus at 9q31.2: results of a genome-wide association study. J Natl Cancer Inst. 2011;103:425–35. doi: 10.1093/jnci/djq563. doi: djq563 [pii] 10.1093/jnci/djq563. [DOI] [PubMed] [Google Scholar]
- Ghoussaini M, Fletcher O, Michailidou K, Turnbull C, Schmidt MK, Dicks E, Dennis J, Wang Q, Humphreys MK, Luccarini C, Baynes C, Conroy D, Maranian M, Ahmed S, Driver K, Johnson N, Orr N, dos Santos Silva I, Waisfisz Q, Meijers-Heijboer H, Uitterlinden AG, Rivadeneira F, Hall P, Czene K, Irwanto A, Liu J, Nevanlinna H, Aittomaki K, Blomqvist C, Meindl A, Schmutzler RK, Muller-Myhsok B, Lichtner P, Chang-Claude J, Hein R, Nickels S, Flesch-Janys D, Tsimiklis H, Makalic E, Schmidt D, Bui M, Hopper JL, Apicella C, Park DJ, Southey M, Hunter DJ, Chanock SJ, Broeks A, Verhoef S, Hogervorst FB, Fasching PA, Lux MP, Beckmann MW, Ekici AB, Sawyer E, Tomlinson I, Kerin M, Marme F, Schneeweiss A, Sohn C, Burwinkel B, Guenel P, Truong T, Cordina-Duverger E, Menegaux F, Bojesen SE, Nordestgaard BG, Nielsen SF, Flyger H, Milne RL, Alonso MR, Gonzalez-Neira A, Benitez J, Anton-Culver H, Ziogas A, Bernstein L, Dur CC, Brenner H, Muller H, Arndt V, Stegmaier C, Justenhoven C, Brauch H, Bruning T, Wang-Gohrke S, Eilber U, Dork T, Schurmann P, Bremer M, Hillemanns P, Bogdanova NV, Antonenkova NN, Rogov YI, Karstens JH, Bermisheva M, Prokofieva D, Khusnutdinova E, Lindblom A, Margolin S, Mannermaa A, et al. Genome-wide association analysis identifies three new breast cancer susceptibility loci. Nat Genet. 2012;44:312–8. doi: 10.1038/ng.1049ng.1049[pii]. [DOI] [PMC free article] [PubMed] [Google Scholar]
- Haiman CA, Chen GK, Blot WJ, Strom SS, Berndt SI, Kittles RA, Rybicki BA, Isaacs WB, Ingles SA, Stanford JL, Diver WR, Witte JS, Hsing AW, Nemesure B, Rebbeck TR, Cooney KA, Xu J, Kibel AS, Hu JJ, John EM, Gueye SM, Watya S, Signorello LB, Hayes RB, Wang Z, Yeboah E, Tettey Y, Cai Q, Kolb S, Ostrander EA, Zeigler-Johnson C, Yamamura Y, Neslund-Dudas C, Haslag-Minoff J, Wu W, Thomas V, Allen GO, Murphy A, Chang BL, Zheng SL, Leske MC, Wu SY, Ray AM, Hennis AJ, Thun MJ, Carpten J, Casey G, Carter EN, Duarte ER, Xia LY, Sheng X, Wan P, Pooler LC, Cheng I, Monroe KR, Schumacher F, Le Marchand L, Kolonel LN, Chanock SJ, Berg DV, Stram DO, Henderson BE. Genome-wide association study of prostate cancer in men of African ancestry identifies a susceptibility locus at 17q21. Nat Genet. 2011a;43:570–3. doi: 10.1038/ng.839. doi: ng.839 [pii] 10.1038/ng.839. [DOI] [PMC free article] [PubMed] [Google Scholar]
- Haiman CA, Chen GK, Vachon CM, Canzian F, Dunning A, Millikan RC, Wang X, Ademuyiwa F, Ahmed S, Ambrosone CB, Baglietto L, Balleine R, Bandera EV, Beckmann MW, Berg CD, Bernstein L, Blomqvist C, Blot WJ, Brauch H, Buring JE, Carey LA, Carpenter JE, Chang-Claude J, Chanock SJ, Chasman DI, Clarke CL, Cox A, Cross SS, Deming SL, Diasio RB, Dimopoulos AM, Driver WR, Dunnebier T, Durcan L, Eccles D, Edlund CK, Ekici AB, Fasching PA, Feigelson HS, Flesch-Janys D, Fostira F, Forsti A, Fountzilas G, Gerty SM, Giles GG, Godwin AK, Goodfellow P, Graham N, Greco D, Hamann U, Hankinson SE, Hartmann A, Hein R, Heinz J, Holbrook A, Hoover RN, Hu JJ, Hunter DJ, Ingles SA, Irwanto A, Ivanovich J, John EM, Johnson N, Jukkola-Vuorinen A, Kaaks R, Ko YD, Kolonel LN, Konstantopoulou I, Kosma VM, Kulkarni S, Lambrechts D, Lee AM, Marchand LL, Lesnick T, Liu J, Lindstrom S, Mannermaa A, Margolin S, Martin NG, Miron P, Montgomery GW, Nevanlinna H, Nickels S, Nyante S, Olswold C, Palmer J, Pathak H, Pectasides D, Perou CM, Peto J, Pharoah PD, Pooler LC, Press MF, Pylkas K, Rebbeck TR, Rodriguez-Gil JL, Rosenberg L, Ross E, Rudiger T, Silva I dos S, et al. A common variant at the TERT-CLPTM1L locus is associated with estrogen receptor-negative breast cancer. Nat Genet. 2011b;43:1210–4. doi: 10.1038/ng.985ng.985[pii]. [DOI] [PMC free article] [PubMed] [Google Scholar]
- Hunter DJ, Kraft P, Jacobs KB, Cox DG, Yeager M, Hankinson SE, Wacholder S, Wang Z, Welch R, Huntchinson A, Wang J. A genome-wide association study identifies alleles in FGFR2 associated with risk of sporadic postmenopausal breast cancer. Nat Genet. 2007a;39:870–874. doi: 10.1038/ng2075. [DOI] [PMC free article] [PubMed] [Google Scholar]
- Hunter DJ, Kraft P, Jacobs KB, Cox DG, Yeager M, Hankinson SE, Wacholder S, Wang Z, Welch R, Hutchinson A, Wang J, Yu K, Chatterjee N, Orr N, Willett WC, Colditz GA, Ziegler RG, Berg CD, Buys SS, McCarty CA, Feigelson HS, Calle EE, Thun MJ, Hayes RB, Tucker M, Gerhard DS, Fraumeni JF, Jr, Hoover RN, Thomas G, Chanock SJ. A genome-wide association study identifies alleles in FGFR2 associated with risk of sporadic postmenopausal breast cancer. Nat Genet. 2007b;39:870–4. doi: 10.1038/ng2075. [DOI] [PMC free article] [PubMed] [Google Scholar]
- Huo D, Zheng Y, Ogundiran TO, Adebamowo C, Nathanson KL, Domchek SM, Rebbeck TR, Simon MS, John EM, Hennis A, Nemesure B, Wu SY, Leske MC, Ambs S, Niu Q, Zhang J, Cox NJ, Olopade OI. Evaluation of 19 susceptibility loci of breast cancer in women of African ancestry. Carcinogenesis. 2012;33:835–40. doi: 10.1093/carcin/bgs093. doi: bgs093 [pii] 10.1093/carcin/bgs093. [DOI] [PMC free article] [PubMed] [Google Scholar]
- Hutter CM, Young AM, Ochs-Balcom HM, Carty CL, Wang T, Chen CT, Rohan TE, Kooperberg C, Peters U. Replication of breast cancer GWAS susceptibility loci in the Women’s Health Initiative African American SHARe Study. Cancer Epidemiol Biomarkers Prev. 2011;20:1950–9. doi: 10.1158/1055-9965.EPI-11-0524. doi: 1055-9965.EPI-11-0524 [pii] 10.1158/1055-9965.EPI-11-0524. [DOI] [PMC free article] [PubMed] [Google Scholar]
- Kim HC, Lee JY, Sung H, Choi JY, Park SK, Lee KM, Kim YJ, Go MJ, Li L, Cho YS, Park M, Kim DJ, Oh JH, Kim JW, Jeon JP, Jeon SY, Min H, Kim HM, Park J, Yoo KY, Noh DY, Ahn SH, Lee MH, Kim SW, Lee JW, Park BW, Park WY, Kim EH, Kim MK, Han W, Lee SA, Matsuo K, Shen CY, Wu PE, Hsiung CN, Kim HL, Han BG, Kang D. A genome-wide association study identifies a breast cancer risk variant in ERBB4 at 2q34: results from the Seoul Breast Cancer Study. Breast Cancer Res. 2012;14:R56. doi: 10.1186/bcr3158. doi: bcr3158 [pii] 10.1186/bcr3158. [DOI] [PMC free article] [PubMed] [Google Scholar]
- Kim NW, Piatyszek MA, Prowse KR, Harley CB, West MD, Ho PL, Coviello GM, Wright WE, Weinrich SL, Shay JW. Specific association of human telomerase activity with immortal cells and cancer. Science. 1994;266:2011–5. doi: 10.1126/science.7605428. [DOI] [PubMed] [Google Scholar]
- Li Y, Abecasis GR. Mach 1.0: Rapid Haplotype Reconstruction and Missing Genotype Inference. Am J Hum Genet. 2006;S79:2290. [Google Scholar]
- Long J, Cai Q, Sung H, Shi J, Zhang B, Choi JY, Wen W, Delahanty RJ, Lu W, Gao YT, Shen H, Park SK, Chen K, Shen CY, Ren Z, Haiman CA, Matsuo K, Kim MK, Khoo US, Iwasaki M, Zheng Y, Xiang YB, Gu K, Rothman N, Wang W, Hu Z, Liu Y, Yoo KY, Noh DY, Han BG, Lee MH, Zheng H, Zhang L, Wu PE, Shieh YL, Chan SY, Wang S, Xie X, Kim SW, Henderson BE, Le Marchand L, Ito H, Kasuga Y, Ahn SH, Kang HS, Chan KY, Iwata H, Tsugane S, Li C, Shu XO, Kang DH, Zheng W. Genome-wide association study in east Asians identifies novel susceptibility loci for breast cancer. PLoS Genet. 2012;8:e1002532. doi: 10.1371/journal.pgen.1002532PGENETICS-D-11-01537[pii]. [DOI] [PMC free article] [PubMed] [Google Scholar]
- Meyer KB, Maia AT, O’Reilly M, Teschendorff AE, Chin SF, Caldas C, Ponder BA. Allele-specific up-regulation of FGFR2 increases susceptibility to breast cancer. PLoS Biol. 2008;6:e108. doi: 10.1371/journal.pbio.0060108. doi: 07-PLBI-RA-4229 [pii] 10.1371/journal.pbio.0060108. [DOI] [PMC free article] [PubMed] [Google Scholar]
- Pasaniuc B, Zaitlen N, Lettre G, Chen G, Tandon A, Kao L, Ruczinski I, Fornage M, Siscovick D, Zhu X, Larkin E, Lange L. Enhanced statistical tests for GWAS in admixed populations: assessment using African Americans from CARe and a breast cancer consortium. Under review. 2011 doi: 10.1371/journal.pgen.1001371. [DOI] [PMC free article] [PubMed] [Google Scholar]
- Pharoah PD, Antoniou A, Bobrow M, Zimmern RL, Easton DF, Ponder BA. Polygenic susceptibility to breast cancer and implications for prevention. Nat Genet. 2002;31:33–6. doi: 10.1038/ng853ng853[pii]. [DOI] [PubMed] [Google Scholar]
- Price AL, Patterson NJ, Plenge RM, Weinblatt ME, Shadick NA, Reich D. Principal components analysis corrects for stratification in genome-wide association studies. Nat Genet. 2006;38:904–9. doi: 10.1038/ng1847. doi: ng1847 [pii] 10.1038/ng1847. [DOI] [PubMed] [Google Scholar]
- Price AL, Tandon A, Patterson N, Barnes KC, Rafaels N, Ruczinski I, Beaty TH, Mathias R, Reich D, Myers S. Sensitive detection of chromosomal segments of distinct ancestry in admixed populations. PLoS Genet. 2009;5:e1000519. doi: 10.1371/journal.pgen.1000519. [DOI] [PMC free article] [PubMed] [Google Scholar]
- Pritchard JK, Stephens M, Donnelly P. Inference of population structure using multilocus genotype data. Genetics. 2000;155:945–59. doi: 10.1093/genetics/155.2.945. [DOI] [PMC free article] [PubMed] [Google Scholar]
- Reed FA, Tishkoff SA. African human diversity, origins and migrations. Curr Opin Genet Dev. 2006;16:597–605. doi: 10.1016/j.gde.2006.10.008. doi: S0959-437X(06)00207-3 [pii] 10.1016/j.gde.2006.10.008. [DOI] [PubMed] [Google Scholar]
- Ruiz-Narvaez EA, Rosenberg L, Cozier YC, Cupples LA, Adams-Campbell LL, Palmer JR. Polymorphisms in the TOX3/LOC643714 locus and risk of breast cancer in African-American women. Cancer Epidemiol Biomarkers Prev. 2010;19:1320–7. doi: 10.1158/1055-9965.EPI-09-1250. [DOI] [PMC free article] [PubMed] [Google Scholar]
- Stacey SN, Manolescu A, Sulem P, Rafnar T, Gudmundsson J, Gudjonsson SA, Masson G, Jakobsdottir M, Thorlacius S, Helgason A, Aben KK, Strobbe LJ, Albers-Akkers MT, Swinkels DW, Henderson BE, Kolonel LN, Le Marchand L, Millastre E, Andres R, Godino J, Garcia-Prats MD, Polo E, Tres A, Mouy M, Saemundsdottir J, Backman VM, Gudmundsson L, Kristjansson K, Bergthorsson JT, Kostic J, Frigge ML, Geller F, Gudbjartsson D, Sigurdsson H, Jonsdottir T, Hrafnkelsson J, Johannsson J, Sveinsson T, Myrdal G, Grimsson HN, Jonsson T, von Holst S, Werelius B, Margolin S, Lindblom A, Mayordomo JI, Haiman CA, Kiemeney LA, Johannsson OT, Gulcher JR, Thorsteinsdottir U, Kong A, Stefansson K. Common variants on chromosomes 2q35 and 16q12 confer susceptibility to estrogen receptor-positive breast cancer. Nat Genet. 2007;39:865–9. doi: 10.1038/ng2064. doi: ng2064 [pii] 10.1038/ng2064. [DOI] [PubMed] [Google Scholar]
- Stacey SN, Manolescu A, Sulem P, Thorlacius S, Gudjonsson SA, Jonsson GF, Jakobsdottir M, Bergthorsson JT, Gudmundsson J, Aben KK, Strobbe LJ, Swinkels DW, van Engelenburg KC, Henderson BE, Kolonel LN, Le Marchand L, Millastre E, Andres R, Saez B, Lambea J, Godino J, Polo E, Tres A, Picelli S, Rantala J, Margolin S, Jonsson T, Sigurdsson H, Jonsdottir T, Hrafnkelsson J, Johannsson J, Sveinsson T, Myrdal G, Grimsson HN, Sveinsdottir SG, Alexiusdottir K, Saemundsdottir J, Sigurdsson A, Kostic J, Gudmundsson L, Kristjansson K, Masson G, Fackenthal JD, Adebamowo C, Ogundiran T, Olopade OI, Haiman CA, Lindblom A, Mayordomo JI, Kiemeney LA, Gulcher JR, Rafnar T, Thorsteinsdottir U, Johannsson OT, Kong A, Stefansson K. Common variants on chromosome 5p12 confer susceptibility to estrogen receptor-positive breast cancer. Nat Genet. 2008;40:703–6. doi: 10.1038/ng.131. doi: ng.131 [pii] 10.1038/ng.131. [DOI] [PubMed] [Google Scholar]
- Tarsounas M, Davies AA, West SC. RAD51 localization and activation following DNA damage. Philos Trans R Soc Lond B Biol Sci. 2004;359:87–93. doi: 10.1098/rstb.2003.1368. [DOI] [PMC free article] [PubMed] [Google Scholar]
- Tenhagen M, van Diest PJ, Ivanova IA, van der Wall E, van der Groep P. Fibroblast growth factor receptors in breast cancer: expression, downstream effects, and possible drug targets. Endocr Relat Cancer. 2012;19:R115–29. doi: 10.1530/ERC-12-0060. doi: ERC-12-0060 [pii] 10.1530/ERC-12-0060. [DOI] [PubMed] [Google Scholar]
- Thomas G, Jacobs KB, Kraft P, Yeager M, Wacholder S, Cox DG, Hankinson SE, Hutchinson A, Wang Z, Yu K, Chatterjee N, Garcia-Closas M, Gonzalez-Bosquet J, Prokunina-Olsson L, Orr N, Willett WC, Colditz GA, Ziegler RG, Berg CD, Buys SS, McCarty CA, Feigelson HS, Calle EE, Thun MJ, Diver R, Prentice R, Jackson R, Kooperberg C, Chlebowski R, Lissowska J, Peplonska B, Brinton LA, Sigurdson A, Doody M, Bhatti P, Alexander BH, Buring J, Lee IM, Vatten LJ, Hveem K, Kumle M, Hayes RB, Tucker M, Gerhard DS, Fraumeni JF, Jr, Hoover RN, Chanock SJ, Hunter DJ. A multistage genome-wide association study in breast cancer identifies two new risk alleles at 1p11.2 and 14q24.1 (RAD51L1) Nat Genet. 2009;41:579–84. doi: 10.1038/ng.353. doi: ng.353 [pii] 10.1038/ng.353. [DOI] [PMC free article] [PubMed] [Google Scholar]
- Turnbull C, Shahana A, Morrison J, Pernet D, Renwick A, Maranian M, Seal S, Ghoussaini M, Hines S, Healey CS, Hughes D. Genome-wide association study identifies five new breast cancer susceptibility loci. Nat Genet. 2010;42:504–507. doi: 10.1038/ng.586. [DOI] [PMC free article] [PubMed] [Google Scholar]
- Udler MS, Meyer KB, Pooley KA, Karlins E, Struewing JP, Zhang J, Doody DR, MacArthur S, Tyrer J, Pharoah PD, Luben R, Bernstein L, Kolonel LN, Henderson BE, Le Marchand L, Ursin G, Press MF, Brennan P, Sangrajrang S, Gaborieau V, Odefrey F, Shen CY, Wu PE, Wang HC, Kang D, Yoo KY, Noh DY, Ahn SH, Ponder BA, Haiman CA, Malone KE, Dunning AM, Ostrander EA, Easton DF. FGFR2 variants and breast cancer risk: fine-scale mapping using African American studies and analysis of chromatin conformation. Hum Mol Genet. 2009;18:1692–703. doi: 10.1093/hmg/ddp078. doi: ddp078 [pii] 10.1093/hmg/ddp078. [DOI] [PMC free article] [PubMed] [Google Scholar]
- Zheng W, Cai Q, Signorello LB, Long J, Hargreaves MK, Deming SL, Li G, Li C, Cui Y, Blot WJ. Evaluation of 11 breast cancer susceptibility loci in African-American women. Cancer Epidemiol Biomarkers Prev. 2009a;18:2761–4. doi: 10.1158/1055-9965.EPI-09-0624. doi: 1055-9965.EPI-09-0624 [pii] 10.1158/1055-9965.EPI-09-0624. [DOI] [PMC free article] [PubMed] [Google Scholar]
- Zheng W, Long J, Gao YT, Li C, Zheng Y, Xiang YB, Wen W, Levy S, Deming SL, Haines JL, Gu K, Fair AM, Cai Q, Lu W, Shu XO. Genome-wide association study identifies a new breast cancer susceptibility locus at 6q25.1. Nat Genet. 2009b;41:324–8. doi: 10.1038/ng.318. doi: ng.318 [pii] 10.1038/ng.318. [DOI] [PMC free article] [PubMed] [Google Scholar]
Associated Data
This section collects any data citations, data availability statements, or supplementary materials included in this article.