Abstract
Obesity is one of the leading causes of morbidity in the U.S. Accumulation of proinflammatory immune cells in adipose tissue (AT) contributes to the development of obesity-associated disorders. Weight loss is the ideal method to counteract the negative consequences of obesity; however, losses are rarely maintained, leading to bouts of weight cycling. Fluctuations in weight have been associated with worsened metabolic and cardiovascular outcomes; yet, the mechanisms explaining this potential correlation are not known. For determination of whether weight cycling modulates AT immune cell populations, inflammation, and insulin resistance, mice were subjected to a diet-switch protocol designed to induce weight cycling. Weight-cycled mice displayed decreased systemic glucose tolerance and impaired AT insulin sensitivity when compared with mice that gained weight but did not cycle. AT macrophage number and polarization were not modulated by weight cycling. However, weight cycling did increase the number of CD4+ and CD8+ T cells in AT. Expression of multiple T helper 1–associated cytokines was also elevated subsequent to weight cycling. Additionally, CD8+ effector memory T cells were present in AT of both obese and weight-cycled mice. These studies indicate that an exaggerated adaptive immune response in AT may contribute to metabolic dysfunction during weight cycling.
Obesity is associated with an increased risk for the development insulin resistance (IR), type 2 diabetes, and cardiovascular disease (1). Many of the metabolic consequences of obesity are the result of adipose tissue (AT) dysfunction. Recent findings have implicated immune cell accumulation in AT as a key contributor to obesity-associated inflammation. It is well established that innate immune cells, including macrophages, accumulate in AT during obesity and are a major source of AT-derived inflammatory cytokines/chemokines (2–4).
In addition to innate immune cells, recent evidence points to the involvement of the adaptive immune system in the initiation of AT inflammation during obesity. Upon high-fat diet (HFD) feeding, the proportion of AT-resident anti-inflammatory lymphocytes, including CD4+ regulatory T cells (5) and T helper (Th)2 cells (6), is decreased. Furthermore, obesity promotes the influx of proinflammatory lymphocytes such as B-2 cells (7), natural killer T cells (8,9), interferon-γ (IFN-γ)–secreting CD4+ Th1 (6,10–12), and CD8+ cytotoxic T cells (10,11,13,14) into AT. The accumulation of T-cells in AT appears to be antigen driven (6,14) and is also characterized by the formation of memory cells (10,11). Interestingly, preventing the accumulation of proinflammatory T-cell subsets in AT during obesity improves systemic glucose tolerance (6,14), indicating that a shift toward a Th1 immune response contributes to the development of AT inflammation and IR during obesity.
Weight loss is the ideal approach to counteract the negative consequences of obesity. Lifestyle or surgical interventions that promote weight loss decrease AT macrophage (ATM) number, reduce inflammation, and improve insulin sensitivity (15–17). However, even when weight loss is achieved, losses are rarely maintained (18). These bouts of weight regain lead to weight cycling. Although the literature regarding the impact of weight cycling on metabolic health remains controversial (19–22), multiple studies indicate that weight cycling increases the risk of developing type 2 diabetes and cardiovascular disease in humans (23–27). While the potentially deleterious effects of weight cycling are recognized, the mechanisms by which weight cycling increases metabolic dysfunction remain unknown. Additionally, it is not known whether weight cycling alters AT immune cell composition.
In this study, mice were cycled between HFD and low-fat diet (LFD) to determine if weight cycling alters metabolic and immunological parameters when compared with mice that gain weight in the absence of cycling. We show that weight cycling impairs systemic glucose tolerance and decreases AT insulin sensitivity. Weight cycling did not alter the HFD-induced increase in ATM number or M1 polarization. However, both CD4+ and CD8+ T-cell numbers were increased in AT during weight cycling. In addition, CD8+ effector memory T-cell populations were increased during obesity and weight cycling. This intensified T cell–driven inflammatory response may contribute to the metabolic abnormalities associated with weight cycling.
RESEARCH DESIGN AND METHODS
Animals.
Male C57Bl/6J mice were purchased from The Jackson Laboratory. At 8 weeks of age, mice were placed on a 60% HFD or a 10% LFD, both purchased from Research Diets (New Brunswick, NJ; HFD: D12492; LFD: D12450B). Mice were fed ad libitum and given free access to water. All animal procedures were performed with approval from the Institutional Animal Care and Usage Committee of Vanderbilt University.
Weight and body composition.
Body weight was measured weekly. Total lean and fat mass was measured by nuclear magnetic resonance using a Bruker Minispec instrument (Bruker, Woodlands, TX).
Plasma collection and measurements.
Mice were fasted for 5 h and bled from the retro-orbital venous plexus using heparinized collection tubes. Plasma was separated via centrifugation. Insulin was measured using a Rat/Mouse Insulin ELISA kit (Millipore, Billerica, MA).
Glucose tolerance tests.
Five-hour–fasted mice were bled by the tail vein, and baseline blood glucose was measured. Mice were then injected with 2 g/kg lean mass of dextrose (Hospira, Inc., Lake Forest, IL). Blood glucose was assessed at the times indicated.
Real-time RT-PCR.
RNA isolation and real-time RT-PCR were performed as previously described (28). All genes were analyzed using the Pfaffl method (29), normalized to glyceraldehyde-3-phosphate dehydrogenase, and presented as expression relative to the LF/LF/LF group.
Western blot analysis.
Fifteen minutes before sacrifice, 5-h–fasted mice were intraperitoneally injected with saline or 0.5 units human insulin/kg total body mass (Novo Nordisk, Princeton, NJ). Frozen epididymal AT, liver, and gastrocnemius muscle were sonicated in 2% SDS with 1 mmol/L sodium orthovanadate and 0.5 mmol/L phenylmethylsulfonyl fluoride. Protein was quantified using a BCA assay (Thermo Scientific, Rockford, IL). Membranes were immunoblotted with antibodies generated against AKT or phospho-AKT (Ser473), both purchased from Cell Signaling Technology (Danvers, MA). Band intensity was quantified using ImageJ software (National Institutes of Health, Bethesda, MD).
Stromal vascular fraction separation and flow cytometry.
Stromal vascular fraction (SVF) cells were collected as previously described (30). For flow cytometry, 1 million cells were incubated in Fc block for 5 min, followed by a 30-min incubation at 4°C with fluorophore-conjugated antibodies: F4/80-allophycocyanin (APC), CD11c-phycoerythrin (PE) (both from eBioscience, San Diego, CA), CD11b-APC–Cy7, T-cell receptor-β (TCR-β)–APC, CD4-A700, CD8-PE–Cy7, CD62L-PE, and CD44-FITC (all from BD Biosciences, San Jose, CA). DAPI (0.2 mg/mL) was added as a viability stain before flow cytometry was performed. Samples were processed on a five-laser LSRII flow cytometer in the Vanderbilt University Flow Cytometry Core. Data were analyzed using FlowJo software (Tree Star, Ashland, OR). The gating strategy for analysis of ATM and T-cell content is explained in Supplementary Fig. 1. Throughout the manuscript, flow cytometry data are displayed as the percent of fluorophore-positive cells relative to the total number of live cells. Fluorescence minus one control subjects for ATM and AT T-cell analysis are shown in Supplementary Figs. 2 and 3, and isotype controls for both ATM and AT T-cell markers are presented in Supplementary Fig. 4.
Statistics.
Prism 5.0 software (GraphPad) was used for all statistical analyses. Data were analyzed using a one-way ANOVA followed by a post hoc Student t test if the ANOVA was significant. A two-way ANOVA was used to compare measurements with two different variables. Outliers were excluded from the data for each individual parameter using the Grubbs outlier test (31). A P value of ≤0.05 was considered significant.
RESULTS
Study design.
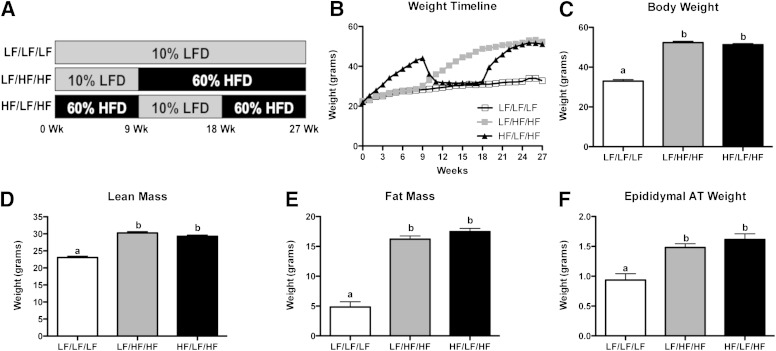
To determine if weight cycling alters metabolic parameters or AT immune cell populations, male C57Bl/6 mice were fed diets to induce alternating obese and lean states. The study consisted of three 9-week diet periods in which mice had ad libitum access to either a 10% LFD or a 60% HFD. Three groups of mice were used (Fig. 1A). The lean control group (designated LF/LF/LF in figures) was placed on LFD for the duration of the study (27 weeks). The weight gain group (designated LF/HF/HF in figures) was maintained on LFD for 9 weeks and then switched to HFD for the remaining 18 weeks of the study. The weight-cycling group (designated HF/LF/HF in figures) was placed on an HFD for 9 weeks to induce obesity and immune cell infiltration into AT, switched to an LFD for 9 weeks to promote weight loss, and placed on an HFD during the last 9-week period to induce subsequent obesity.
FIG. 1.
Metabolic characteristics of weight-cycling mice. Male C57Bl/6 mice were placed on a 10% LFD or a 60% HFD for three 9-week intervals. A: Study design. B–F: Body weight and composition were determined. Body weight timeline for the duration of the study (B). Body weight after 27 weeks (Wk) of diet (C). Nuclear magnetic resonance was used to determine lean mass (D) and fat mass (E) after 27 weeks of diet. F: Epididymal AT weight after 27 weeks of diet. Data are presented as mean ± SEM; n = 15–17/group. Groups not connected by the same letter are significantly different, P < 0.05 (e.g., the value for the group labeled “a” is significantly different from the group labeled “b”). White squares, LF/LF/LF (lean control group); gray squares, LF/HF/HF (weight-gain group); black triangles, HF/LF/HF (weight-cycling group).
Body weight and composition.
When placed on an HFD, mice gained weight as expected. After the mice in the weight-cycled group were switched to an LFD, their weight normalized (within 3 to 4 weeks) to the body weight of lean control mice. Upon subsequent HFD feeding, mice regained weight and were weight matched with the weight gain group for the final 5 weeks of the study (Fig. 1B). At the end of the study, both groups that had received HFD for 18 weeks total (weight gain and weight cycling groups) had significantly increased body weight when compared with lean control mice (Fig. 1C) (P < 0.05). However, there was no difference in body weight between the weight-gain group and the weight-cycling group. Additionally, lean body mass (Fig. 1D), fat mass (Fig. 1E), and epididymal AT weight (Fig. 1F) were increased by HFD feeding (P < 0.05) but were not modulated by weight cycling. Body weight and energy balance are key contributors to AT immune cell content and systemic glucose use (32,33). Because the weight gain and weight cycling mice were weight matched and weight stable for 5 weeks at the end of the study, the effects of weight cycling in the absence of altered body weight/composition could be analyzed.
Weight cycling impairs systemic glucose tolerance.
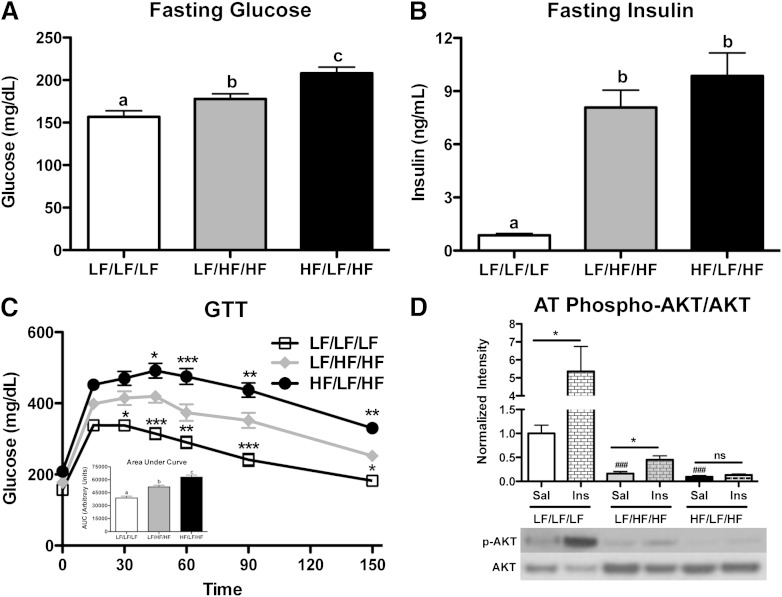
To determine the systemic metabolic consequences of weight cycling, fasting blood glucose and plasma insulin levels were measured and intraperitoneal glucose tolerance tests (GTT) performed. As expected, weight gain slightly increased blood glucose concentrations (Fig. 2A) (P < 0.05 compared with LF/LF/LF). Interestingly, weight cycling resulted in an additional increase in fasting blood glucose levels when compared with the weight-gain group (Fig. 2A) (P < 0.05). Fasting plasma insulin concentrations were increased by HFD feeding (P < 0.05) but did not differ between the weight-gain and weight-cycling groups (Fig. 2B). In agreement with previous literature, glucose tolerance was decreased in the weight-gain group when compared with lean control mice (Fig. 2C) (P < 0.05). Interestingly, weight cycling resulted in an additional impairment in glucose tolerance (Fig. 2C) (P < 0.05 compared with LF/HF/HF), indicating that weight cycling increases systemic metabolic dysfunction, even when compared with weight-matched obese mice.
FIG. 2.
Weight cycling worsens systemic glucose tolerance and impairs AT insulin sensitivity. A–C: Metabolic parameters were evaluated in lean control, weight-gain, and weight-cycling mice after a 5-h fast. Fasting blood glucose (A) and plasma insulin (B) concentrations. Groups not connected by the same letter are significantly different: P < 0.05. C: GTT (dose of 2 g/kg lean mass dextrose) and quantification of the area under the curve for the duration of the GTT (inset). *P < 0.05; **P < 0.01; ***P < 0.001 compared with the LF/HF/HF group. D: Mice were injected with saline (Sal) or insulin (Ins) (0.5 units/kg) 15 min before sacrifice. Protein was isolated from the epididymal AT. Western blot analysis of AT phospho-AKT (p-AKT; Ser473) protein levels (relative to total AKT). *P < 0.05 compared with saline-injected of same group; ###P < 0.001 compared with LF/LF/LF saline-injected group. Data are presented as mean ± SEM; n = 14–17 for glucose, insulin, and GTT; n = 4–6 for Western blots. White squares, LF/LF/LF (lean control group); gray diamonds, LF/HF/HF (weight-gain group); black circles, HF/LF/HF (weight-cycling group). AUC, area under the curve; ns, not significant; phospho, phosphorylated.
Weight loss reverses systemic metabolic dysfunction.
It is possible that the impaired glucose tolerance observed in the weight-cycling group at the end of the study (Fig. 2C) is the result of incomplete resolution of metabolic dysfunction during weight loss (weeks 9–18 of the study). To address this possibility, we completed metabolic analysis of mice at week 18 of the study (Supplementary Fig. 5). At this point, the weight-cycling group had been on an HFD for 9 weeks and then switched to an LFD for 9 weeks to promote weight loss. The mice in the weight-cycling group were weight matched with the lean control group (Supplementary Fig. 5A and B). Similar results were seen with lean body mass and fat mass (Supplementary Fig. 5C and D). Fasting blood glucose and serum insulin concentrations were identical in the lean control and weight-cycling group at this time point (Supplementary Fig. 5E and F). Additionally, a GTT revealed no difference in glucose tolerance between the two groups (Supplementary Fig. 5G and H). Therefore, incomplete resolution of metabolic defects during weight loss is not responsible for the worsened glucose tolerance observed in the weight-cycling group at the end of the 27-week study.
Weight cycling decreases AT insulin sensitivity.
To determine if weight cycling modulates insulin signaling in AT, mice were injected with saline or insulin prior to sacrifice. Insulin injection resulted in a significant increase in the phosphorylation of AKT at Ser473 in AT of lean control mice (P < 0.05 compared with LF/LF/LF saline) (Fig. 2D). As expected, HFD feeding decreased insulin-stimulated AKT phosphorylation in the weight-gain group; however, there remained a mild insulin response (P < 0.05 compared with LF/HF/HF saline) (Fig. 2D). In contrast, weight cycling resulted in a complete loss of insulin-stimulated AKT phosphorylation, indicating that weight cycling further impaired AT insulin sensitivity (Fig. 2D). Additionally, weight cycling impaired liver, but not muscle, insulin signaling (Supplementary Fig. 6).
Weight cycling does not alter ATM content.
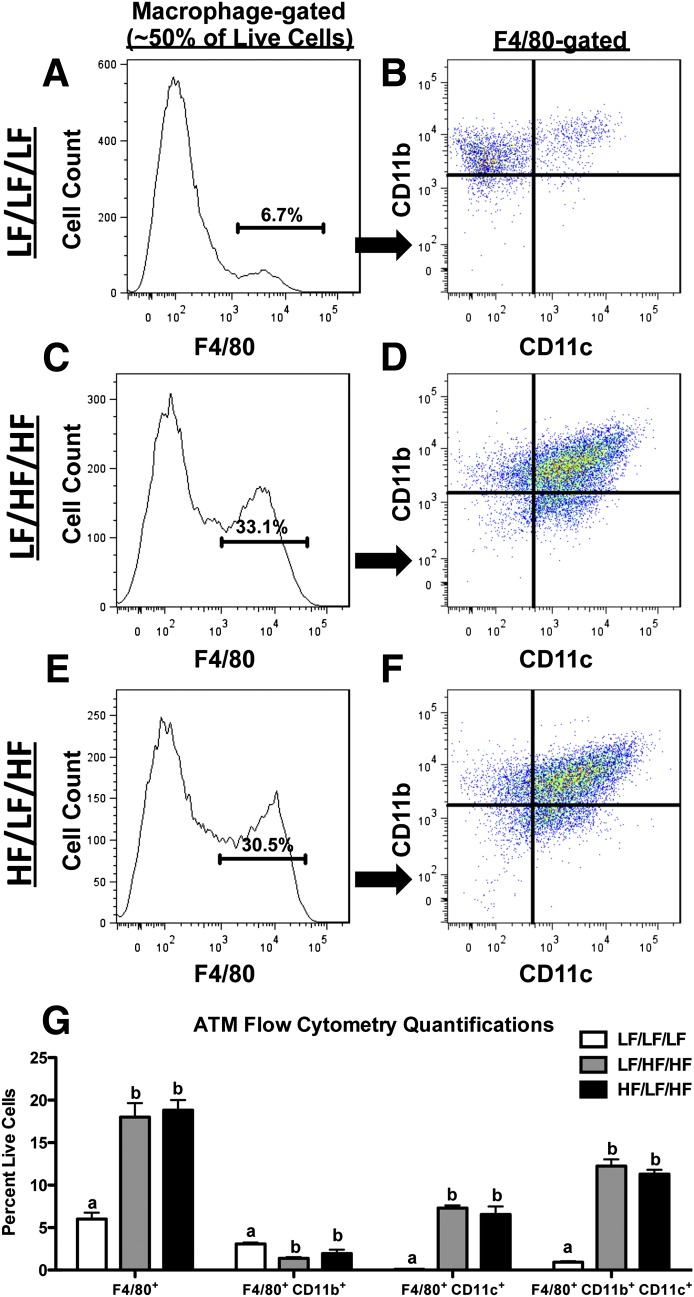
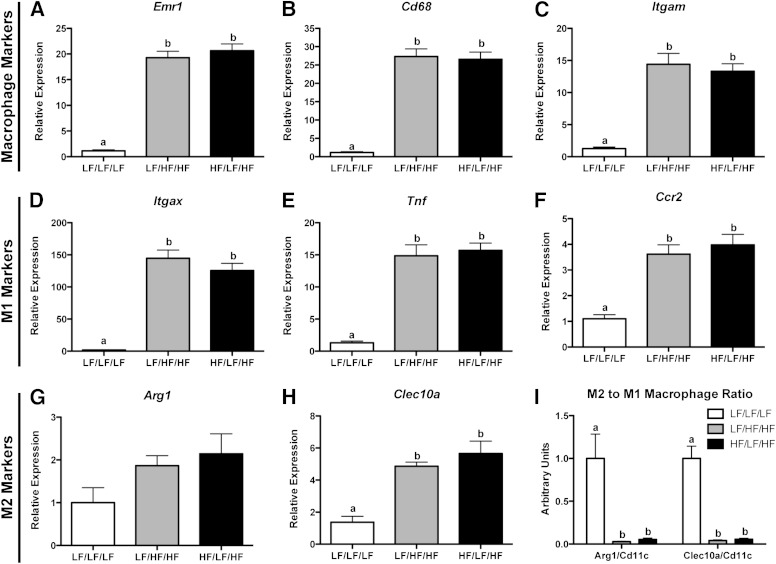
Because macrophage accumulation in obese AT contributes to the development of IR (1), we next performed flow cytometry on the SVF of the epididymal AT to determine if weight cycling impacts ATM content (Fig. 3A–G). For a detailed explanation of the gating strategy, please see Supplementary Fig. 1. As expected, the percentage of F4/80+ macrophages was increased by HFD feeding (P < 0.05 compared with LF/LF/LF) but did not differ between the weight-gain and weight-cycling groups (Fig. 3G). HFD significantly decreased the percentage of F4/80+CD11b+CD11c− macrophages in AT (P < 0.05 compared with LF/LF/LF), but there was no weight-cycling effect (Fig. 3G). Both F4/80+CD11b−CD11c+ and F4/80+CD11b+CD11c+ macrophages were increased in AT during obesity (P < 0.05 compared with LF/LF/LF) (Fig. 3G). Again, weight cycling did not modulate these immune cell populations. (All flow cytometry data are shown as cell number in Supplementary Fig. 7.) In addition to the flow cytometry data, real-time RT-PCR analysis demonstrates that weight cycling does not alter the HFD-induced increase in AT expression of the macrophage markers Emr1, Cd68, and Itgam (Fig. 4A–C).
FIG. 3.
Weight cycling does not modulate ATM content. SVF cells were isolated from the epididymal AT and analyzed by flow cytometry. A and B: LF/LF/LF (lean control) group. C and D: LF/HF/HF (weight gain) group. E and F: HF/LF/HF (weight cycling) group. Cells were gated for the macrophage population based upon forward and side scatter (Supplementary Fig. 1) and analyzed for macrophage markers. Representative flow cytometry histogram of F4/80 (A, C, and E). Percentages on histograms represent percent of macrophage-gated cells that are F4/80 positive. Flow cytometry dot plot of F4/80+ cells analyzed for CD11b and CD11c (B, D, and F). G: Quantification of ATM flow cytometry (shown as percent of fluorophore-positive cells relative to all live SVF cells) for all groups. Data are presented as mean ± SEM; n = 6–12/group. Groups not connected by the same letter within each cell population are significantly different; P < 0.05. HF/LF/HF, weight-cycling group; LF/HF/HF, weight-gain group; LF/LF/LF, lean control group.
FIG. 4.
Weight cycling does not modulate ATM phenotype. RNA was isolated from the epididymal AT and gene expression was analyzed by real-time RT-PCR. A: Emr1. B: Cd68. C: Itgam. D: Itgax. E: Tnf. F: Ccr2. G: Arg1. H: Clec10a. I: M2-to-M1 macrophage ratio calculated by dividing the relative expression of either Arg1 or Clec10a (M2 markers) by the relative expression of Itgax (M1 marker). Data are presented as mean ± SEM; n = 8–14/group. Groups not connected by the same letter are significantly different; P < 0.05. HF/LF/HF, weight-cycling group; LF/HF/HF, weight-gain group; LF/LF/LF, lean control group.
Weight cycling does not alter ATM phenotype.
To determine if weight cycling influences macrophage phenotype, gene expression of classical M1 and M2 macrophage markers was determined. AT expression of M1 (Itgax, Tnf, and Ccr2) and M2 (Arg1 and Clec10a) macrophage markers was increased during obesity (34) but not altered by weight cycling (Fig. 4D–H). Additionally, the M2-to-M1 macrophage ratio (calculated by dividing the relative expression of either Arg1 or Clec10a by the relative expression of Itgax) was decreased with HFD feeding but unchanged by weight cycling (Fig. 4I).
Weight cycling increases T-cell accumulation in AT.
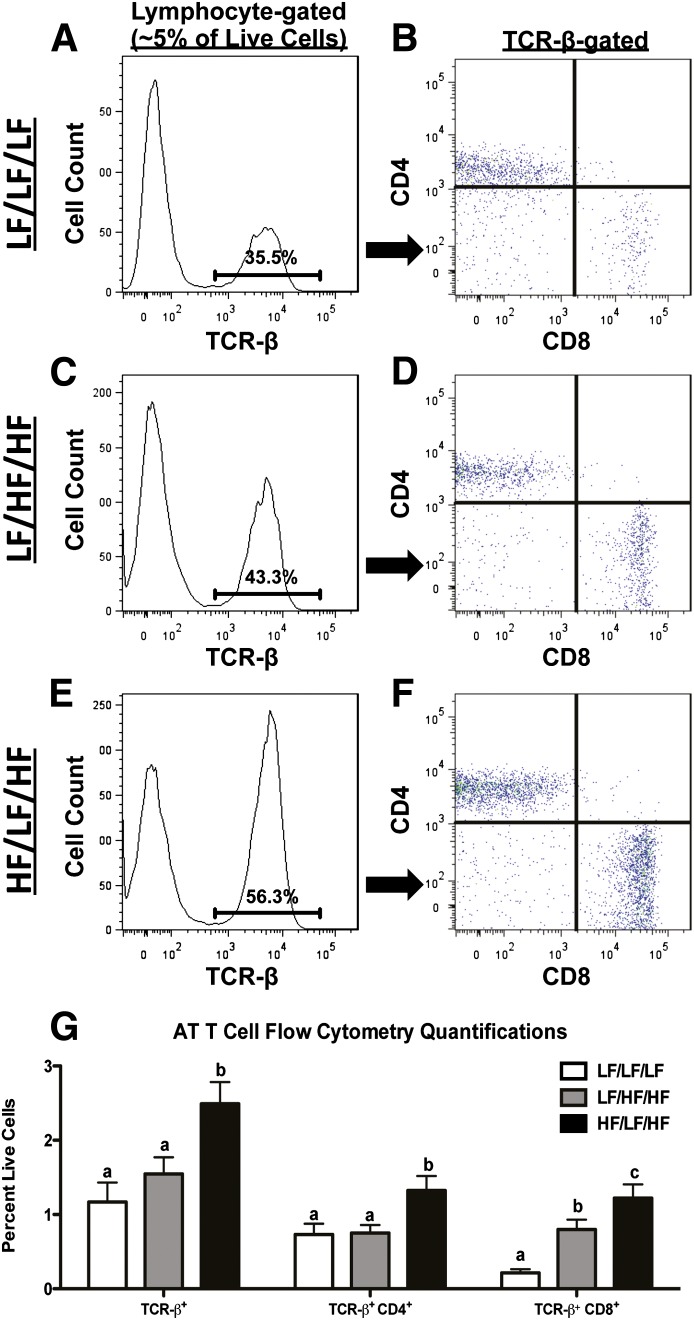
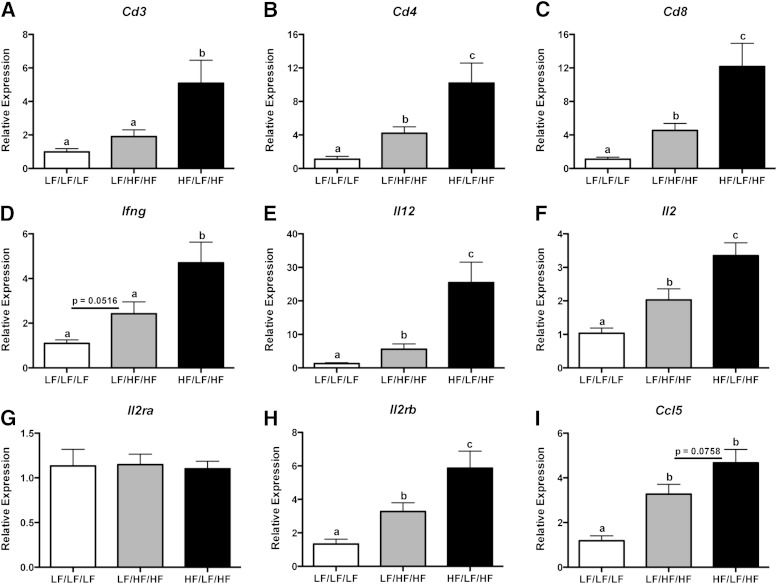
Recent evidence indicates that, in addition to macrophages, T cells also accumulate in AT during obesity and contribute to the development of IR (6,12–14,35). To determine if weight cycling modulates AT T-cell subsets, live cells in the lymphocyte population of the SVF were analyzed for TCR-β (see Supplementary Fig. 1D–F for gating strategy and Fig. 5 for data). The percentage of TCR-β+ cells was increased in AT of the weight-cycling group (Fig. 5G) (P < 0.05 compared with LF/LF/LF and LF/HF/HF). TCR-β+ cells were subsequently analyzed for CD4 and CD8 (Fig. 5B, D, and F). As previously reported (14), weight gain increased the percent of CD8+ T cells in AT. Interestingly, weight cycling resulted in an even further increase in the percentage of both CD4+ and CD8+ T cells in AT (P < 0.05 compared with LF/LF/LF and LF/HF/HF) (Fig. 5G). In addition, real-time RT-PCR analysis demonstrates an increase in the expression of Cd3, Cd4, and Cd8 in AT of the weight-cycled mice compared with both control groups (Fig. 6A–C) (P < 0.05).
FIG. 5.
Weight cycling increases AT T-cell populations. SVF cells were isolated from the epididymal AT and analyzed by flow cytometry. LF/LF/LF (lean control) group (A and B), LF/HF/HF (weight gain) group (C and D), HF/LF/HF (weight cycling) group (E and F). Cells were gated for the lymphocyte population based upon forward and side scatter (Supplementary Fig. 1) and analyzed for T-cell markers. Representative flow cytometry histogram of TCR-β (A, C, and E). Percentages on histograms represent percent of lymphocyte-gated cells that are TCR-β–positive. Flow cytometry dot plot of TCR-β+ cells analyzed for CD4 and CD8 (B, D, and F). G: Quantification of AT T-cell flow cytometry (shown as percent of fluorophore-positive cells relative to all live SVF cells) from all groups. Data are presented as mean ± SEM; n = 10–12/group. Groups not connected by the same letter within each cell population are significantly different; P < 0.05. HF/LF/HF, weight-cycling group; LF/HF/HF, weight-gain group; LF/LF/LF, lean control group.
FIG. 6.
Weight cycling increases AT gene expression of T-cell markers and CD4+ Th1 and CD8+ T cell–derived cytokines. RNA was isolated from the epididymal AT and gene expression was analyzed by real-time RT-PCR. A: Cd3. B: Cd4. C: Cd8. D: Ifng. E: Il12. F: Il2. G: Il2ra. H: Il2rb. I: Ccl5. Data are presented as mean ± SEM; n = 8–14/group. Groups not connected by the same letter are significantly different; P < 0.05. HF/LF/HF, weight-cycling group; LF/HF/HF, weight-gain group; LF/LF/LF, lean control group.
Weight cycling increases gene expression of CD4+ Th1- and CD8+ T cell–derived cytokines in AT.
Next, we determined the expression of genes relevant to T-cell function and inflammatory status. Th1-polarized CD4+ T cells and cytotoxic CD8+ T cells secrete high levels of the inflammatory cytokine IFN-γ (36). Real-time RT-PCR analysis demonstrates that weight cycling further augments the HFD-induced increase in Ifng gene expression (Fig. 6D) (P < 0.05 compared with LF/HF/HF). Weight cycling results in a striking 4.5-fold increase in the expression of the Th1-stimulating cytokine (37), Il12, when compared with weight gain in the absence of cycling (Fig. 6E) (P < 0.05). In addition, gene expression of Il2, a Th1-derived cytokine required for the growth, differentiation, and survival of CD8+ T cells (38), was increased twofold compared with the weight-gain group (Fig. 6F) (P < 0.05). Expression of the low-affinity interleukin-1 receptor, Il2ra, was not modulated by diet (Fig. 6G). In contrast, the high-affinity interleukin-2 receptor, Il2rb, was increased during obesity, and an additional twofold increase in gene expression was seen during weight cycling (Fig. 6H) (P < 0.05 compared with LF/HF/HF). There was also a trend toward an increase in the gene expression of the T-cell chemokine, Ccl5, in AT of the weight-cycling group (Fig. 6I) (P = 0.076 compared with LF/HF/HF). Of note, weight cycling did not modulate the expression of the Th2-derived cytokines: Il4, Il10, and Il13 (Supplementary Fig. 8). Together, these flow cytometry and gene expression data demonstrate the novel finding that weight cycling induces an exaggerated proinflammatory T-cell response in AT.
Obesity increases CD8+ effector memory T-cell accumulation in AT.
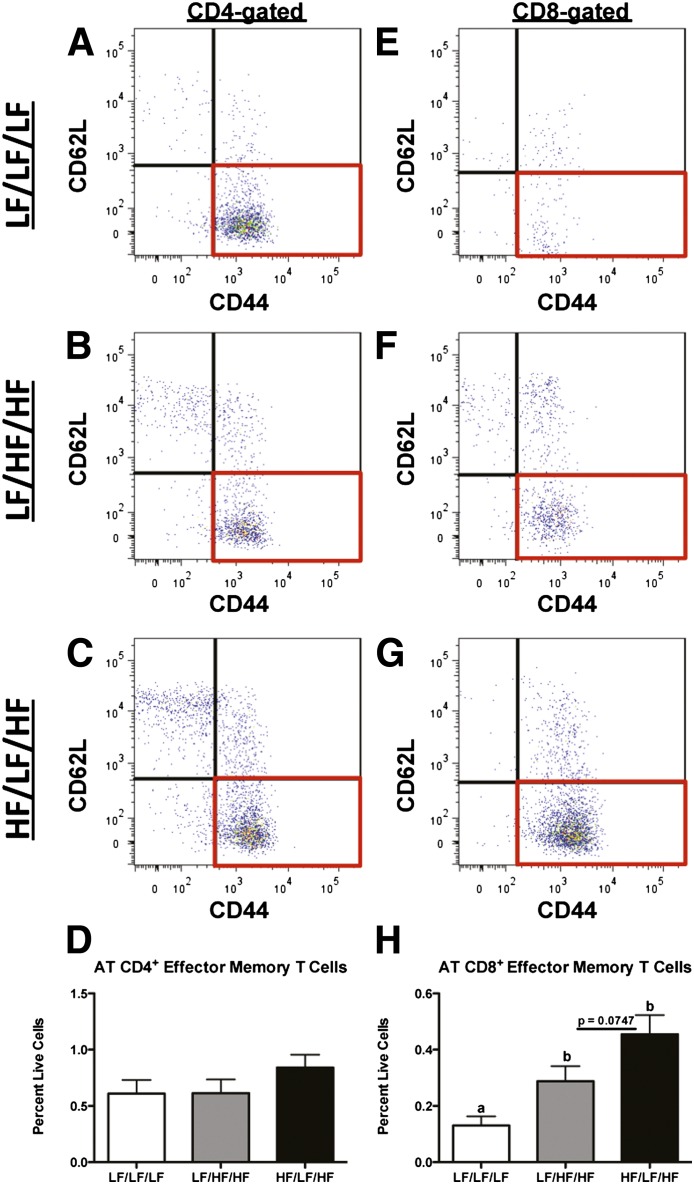
One of the distinguishing features of an adaptive immune response is the development of cellular memory against specific antigens (39). To determine if weight cycling is associated with an increase in effector memory T cells, CD4+ and CD8+ T cells were analyzed for CD62L and CD44. CD4+ effector memory T cells (CD62L−CD44+) were not modulated by either HFD feeding or weight cycling (Fig. 7A–D). However, in agreement with published literature (10,11), obesity increased the number of CD8+ effector memory T cells in AT (Fig. 7E and F) (P < 0.05 compared with LF/LF/LF). Additionally, there was a trend toward a further increase in CD8+ effector memory T-cell accumulation in AT of weight-cycled mice (Fig. 7F and G) (P = 0.075 compared with LF/HF/HF). The above data indicate that effector memory T cells accumulate in AT during obesity and that weight cycling may further increase this adaptive immune memory response.
FIG. 7.
Increased CD8+, but not CD4+, effector memory T-cell accumulation in AT during obesity. SVF cells were isolated from the epididymal AT and analyzed by flow cytometry. A and E: LF/LF/LF (lean control) group. B and F: LF/HF/HF (weight gain) group. C and G: HF/LF/HF (weight cycling) group. Cells were gated for the lymphocyte population based upon forward and side scatter (Supplementary Fig. 1), selected for expression of either CD4 (A–D) or CD8 (E–H) (Fig. 5) and then analyzed for memory T-cell markers. Representative flow cytometry dot plots of CD4+ cells analyzed for CD62L and CD44 (A–C). D: Quantification of CD4+ effector memory T cells (CD62L−CD44+) by flow cytometry. Representative flow cytometry dot plots of CD8+ cells analyzed for CD62L and CD44 (E–G). H: Quantification of CD8+ effector memory T cells (CD62L−CD44+) by flow cytometry. Data are presented as mean ± SEM; n = 6–12/group. Groups not connected by the same letter are significantly different; P < 0.05. HF/LF/HF, weight-cycling group; LF/HF/HF, weight-gain group; LF/LF/LF, lean control group.
DISCUSSION
Multiple studies indicate that weight cycling is associated with worsened metabolic and cardiovascular outcomes (23–27). However, the mechanism(s) by which weight cycling promotes metabolic dysfunction are not known. In this study, we show that weight cycling worsens obesity-associated systemic glucose intolerance and AT IR in mice. Accompanying these metabolic changes is a significant increase in CD8+ T cells, CD4+ T cells, and the expression of Th1 cell-derived cytokines in AT of weight-cycled mice. These novel findings suggest that an amplified T-cell response occurs in AT during weight cycling.
Previous reports have shown that weight cycling increases systemic IR in rats (40,41), and a recent study showed increased inflammatory cytokine levels in AT of weight-cycled mice when compared with lean control mice (42). Multiple human studies demonstrate that weight cycling increases the risk for development of cardiovascular disease and type 2 diabetes (23–27). One of the first studies addressing this issue reported a 10% increase in 25-year risk of coronary death in men who weight cycled when compared with those who gained weight but remained weight stable (24). Additionally, a recent study has shown that weight cycling is associated with increased incidence of type 2 diabetes in participants of the Framingham Heart Study (23).
In contrast to the above findings, other studies report no adverse effects of weight cycling (19–22). The controversy regarding the impact of weight cycling in humans may be due, in part, to variability of study design. Importantly, our data suggest that an exaggerated adaptive immune response in AT may contribute to the negative effects of weight cycling. Indeed, CD4+ Th1 and Th2 and CD8+ T cells are known to play a role in the pathogenesis of human obesity (43). Therefore, if the extent of weight cycling or the time between cycles (as defined by the study design) was not sufficient to induce AT immune cell infiltration, the weight-cycling effect on metabolism may not have been observed.
It was important to confirm that weight loss completely reversed obesity-associated metabolic dysfunction before subsequent weight gain. Metabolic phenotyping, performed at week 18 of the study, demonstrated that when mice in the weight-cycling group are switched to an LFD, they lose weight and exactly normalize to the body weight/composition and glucose tolerance of mice maintained on an LFD for the duration of the study (Supplementary Fig. 5). These data indicate that glucose intolerance does not precede weight regain during this weight-cycling protocol and suggest that weight cycling, per se, is responsible for the metabolic dysfunction observed at the end of the study.
In this study, we demonstrate that weight cycling increases the accumulation of CD4+ and CD8+ T cells in AT. Furthermore, gene expression of Th1-derived cytokines and cytokine receptors was increased in AT of weight-cycled mice when compared with mice maintained on an HFD (Fig. 6). Recent studies have shown that mice lacking certain T cell–derived cytokines or proinflammatory T-cell subsets are protected from many of the pathologies associated with obesity. For example, HFD-induced glucose intolerance and AT inflammation is ameliorated in IFN-γ–knockout mice (44). Additionally, deletion of CD8+ T cells improves systemic glucose tolerance and insulin sensitivity (14). Furthermore, knockout of T-bet decreases multiple lymphocyte cell populations within AT and ameliorates HFD-induced glucose intolerance and AT inflammation (45). These published studies suggest that increased T cell–mediated inflammation in AT may contribute to the impaired AT insulin sensitivity and systemic glucose intolerance observed during weight cycling.
In addition, we have performed regression analysis to determine if there is a correlation between AT T-cell content and glucose tolerance in the mice in our study. These analyses demonstrate that impaired glucose tolerance (increased area under the curve of GTT) is significantly and positively correlated with the percent of CD4+ and CD8+ T cells in AT, as well as the gene expression of the Th1-derived cytokines Ifng and Il2 (Supplementary Fig. 9). Furthermore, when these correlations were corrected for changes in ATM number, the association between impaired glucose tolerance and AT T-cell number remained significant (CD4, P = 0.002; CD8, P = 0.01). Therefore, these findings reinforce the conclusion that an increase in inflammatory T-cell subsets, but not macrophages, in AT contributes to impaired metabolic fitness during weight cycling.
Nishimura et al. (14) showed that CD8+ T-cell accumulation in AT preceded and was required for the infiltration of ATMs during obesity. However, subsequent findings have called this concept into question: two other studies have found that T cells actually accumulate in AT well after ATM infiltration is observed (7,46). The reason for these differential findings is not clear, but this controversy does challenge the hypothesis that T cells direct macrophage infiltration into obese AT. Nevertheless, it has been shown that CD8+ T-cell depletion decreases AT inflammation and macrophage content, although deletion of cytotoxic T cells does not completely normalize ATM content/inflammation to lean levels (14), suggesting that T cell–independent regulation of ATM accumulation may exist. Moreover, while T cell–derived cytokines have been shown to directly impact macrophages, these cytokines can also have an effect on other nonimmune cells. For example, T cell–derived IFN-γ induces IR in adipocytes (47), and recent findings indicate that antigen presented on adipocytes can activate AT T cells (48). Our data demonstrate that weight cycling increases AT IR and T-cell content in the absence of a change in ATM number or phenotype. Therefore, these findings support the recently emerging concept that alterations in AT T-cell populations may not always be accompanied by modulation of ATMs.
Adaptive immunity, in contrast to innate immunity, is characterized by an antigen-specific immune response that results in the formation and maintenance of memory cells. These long-lived memory cells are capable of mounting a more rapid and potent secondary immune response upon re-exposure to the same antigen (49). T cells in obese AT express a restricted TCR repertoire, suggesting that these immune cells may recognize self-antigen during obesity (5,6,14). Additionally, multiple studies, including our own (Fig. 7), have shown that effector memory T cells accumulate in AT during HFD feeding (10,11). While the identities of the obese AT antigens are not known, the concept of an antigen-specific T-cell response during obesity has great implications for our current findings. Weight cycling may re-expose T cells to obese AT antigens. Therefore, it is interesting to speculate that the increased accumulation of T cells observed in AT during weight cycling may be the result of a more potent and rapid memory cell–mediated secondary immune response. In fact, although the data did not reach significance, in our current study, the weight-cycled mice trended toward a further increase in AT CD8+ effector memory T cells (Fig. 7). Additional studies to establish whether effector memory T cells proliferate more rapidly during weight regain are needed to confirm this hypothesis.
IR in AT is a key contributor to systemic glucose intolerance during obesity; however, other metabolic tissues also play a significant role in maintaining glucose homeostasis. The ideal method to determine tissue-specific impairments in insulin signaling is the hyperinsulinemic-euglycemic metabolic clamp. However, due to the advanced age of the mice at the end of the current study, we elected to not perform these studies. Instead, we evaluated signaling pathways in various tissues after a bolus injection of insulin. As shown in Supplementary Fig. 6, weight cycling also impairs liver, but not muscle, insulin signaling. Therefore, it is probable that altered hepatic insulin sensitivity, in addition to immunometabolic changes in AT, contributes to the systemic metabolic dysfunction observed during weight cycle. While our current report focuses on AT immune composition and IR, the impact of weight cycling on the liver is an important area of future investigation.
Taken together, our studies show for the first time that weight cycling modulates AT T-cell, but not macrophage, composition. This increase in proinflammatory T-cell populations suggests that an exaggerated adaptive immune response in AT contributes to the negative metabolic consequences of weight cycling.
ACKNOWLEDGMENTS
This project was funded by National Institutes of Health Grant HL-089466. A.H.H. was also supported by an American Diabetes Association Career Development Award (1-07-CD-10) and an American Heart Association Established Investigator Award (12EIA827). E.K.A. was supported by the Cellular, Biochemical, and Molecular Sciences Training Program (National Institutes of Health Grant T32-GM-008554) and an American Heart Association Pre-doctoral Fellowship (12PRE11910047). D.A.G. was supported by an individual National Research Service Award (DK-091128), and A.K. was funded by an American Diabetes Association Postdoctoral Fellowship (7-10-MI-05). Flow cytometry experiments were performed in the Vanderbilt University Medical Center Flow Cytometry Shared Resources Core, supported by the Vanderbilt Digestive Disease Research Center (DK-058404).
No potential conflicts of interest relevant to this article were reported.
E.K.A. collected and analyzed the data and wrote the manuscript. D.A.G. and A.K. assisted with data collection and reviewed the manuscript. A.H.H. provided funding, assisted with data analysis, and edited the manuscript. A.H.H. is the guarantor of this work and, as such, had full access to all the data in the study and takes responsibility for the integrity of the data and the accuracy of the data analysis.
The authors thank the members of their laboratory for the careful reading of this manuscript. The authors also thank Drs. Ayumi Shitanti and Aihua Bian (Vanderbilt University) for statistical assistance. They are supported by NIH grants AR-056116, DK-020593-33.
Footnotes
This article contains Supplementary Data online at http://diabetes.diabetesjournals.org/lookup/suppl/doi:10.2337/db12-1076/-/DC1.
REFERENCES
- 1.Olefsky JM, Glass CK. Macrophages, inflammation, and insulin resistance. Annu Rev Physiol 2010;72:219–246 [DOI] [PubMed] [Google Scholar]
- 2.Weisberg SP, McCann D, Desai M, Rosenbaum M, Leibel RL, Ferrante AW, Jr. Obesity is associated with macrophage accumulation in adipose tissue. J Clin Invest 2003;112:1796–1808 [DOI] [PMC free article] [PubMed] [Google Scholar]
- 3.Xu H, Barnes GT, Yang Q, et al. Chronic inflammation in fat plays a crucial role in the development of obesity-related insulin resistance. J Clin Invest 2003;112:1821–1830 [DOI] [PMC free article] [PubMed] [Google Scholar]
- 4.Lumeng CN, Bodzin JL, Saltiel AR. Obesity induces a phenotypic switch in adipose tissue macrophage polarization. J Clin Invest 2007;117:175–184 [DOI] [PMC free article] [PubMed] [Google Scholar]
- 5.Feuerer M, Herrero L, Cipolletta D, et al. Lean, but not obese, fat is enriched for a unique population of regulatory T cells that affect metabolic parameters. Nat Med 2009;15:930–939 [DOI] [PMC free article] [PubMed] [Google Scholar]
- 6.Winer S, Chan Y, Paltser G, et al. Normalization of obesity-associated insulin resistance through immunotherapy. Nat Med 2009;15:921–929 [DOI] [PMC free article] [PubMed] [Google Scholar]
- 7.Winer DA, Winer S, Shen L, et al. B cells promote insulin resistance through modulation of T cells and production of pathogenic IgG antibodies. Nat Med 2011;17:610–617 [DOI] [PMC free article] [PubMed] [Google Scholar]
- 8.Ohmura K, Ishimori N, Ohmura Y, et al. Natural killer T cells are involved in adipose tissues inflammation and glucose intolerance in diet-induced obese mice. Arterioscler Thromb Vasc Biol 2010;30:193–199 [DOI] [PubMed] [Google Scholar]
- 9.Mantell BS, Stefanovic-Racic M, Yang X, Dedousis N, Sipula IJ, O’Doherty RM. Mice lacking NKT cells but with a complete complement of CD8+ T-cells are not protected against the metabolic abnormalities of diet-induced obesity. PLoS ONE 2011;6:e19831. [DOI] [PMC free article] [PubMed] [Google Scholar]
- 10.Duffaut C, Zakaroff-Girard A, Bourlier V, et al. Interplay between human adipocytes and T lymphocytes in obesity: CCL20 as an adipochemokine and T lymphocytes as lipogenic modulators. Arterioscler Thromb Vasc Biol 2009;29:1608–1614 [DOI] [PubMed] [Google Scholar]
- 11.Yang H, Youm YH, Vandanmagsar B, et al. Obesity increases the production of proinflammatory mediators from adipose tissue T cells and compromises TCR repertoire diversity: implications for systemic inflammation and insulin resistance. J Immunol 2010;185:1836–1845 [DOI] [PMC free article] [PubMed] [Google Scholar]
- 12.Kintscher U, Hartge M, Hess K, et al. T-lymphocyte infiltration in visceral adipose tissue: a primary event in adipose tissue inflammation and the development of obesity-mediated insulin resistance. Arterioscler Thromb Vasc Biol 2008;28:1304–1310 [DOI] [PubMed] [Google Scholar]
- 13.Rausch ME, Weisberg S, Vardhana P, Tortoriello DV. Obesity in C57BL/6J mice is characterized by adipose tissue hypoxia and cytotoxic T-cell infiltration. Int J Obes (Lond) 2008;32:451–463 [DOI] [PubMed] [Google Scholar]
- 14.Nishimura S, Manabe I, Nagasaki M, et al. CD8+ effector T cells contribute to macrophage recruitment and adipose tissue inflammation in obesity. Nat Med 2009;15:914–920 [DOI] [PubMed] [Google Scholar]
- 15.Li P, Lu M, Nguyen MT, et al. Functional heterogeneity of CD11c-positive adipose tissue macrophages in diet-induced obese mice. J Biol Chem 2010;285:15333–15345 [DOI] [PMC free article] [PubMed] [Google Scholar]
- 16.Kosteli A, Sugaru E, Haemmerle G, et al. Weight loss and lipolysis promote a dynamic immune response in murine adipose tissue. J Clin Invest 2010;120:3466–3479 [DOI] [PMC free article] [PubMed] [Google Scholar]
- 17.Cancello R, Henegar C, Viguerie N, et al. Reduction of macrophage infiltration and chemoattractant gene expression changes in white adipose tissue of morbidly obese subjects after surgery-induced weight loss. Diabetes 2005;54:2277–2286 [DOI] [PubMed] [Google Scholar]
- 18.Wing RR, Hill JO. Successful weight loss maintenance. Annu Rev Nutr 2001;21:323–341 [DOI] [PubMed] [Google Scholar]
- 19.Stevens VL, Jacobs EJ, Sun J, et al. Weight cycling and mortality in a large prospective US study. Am J Epidemiol 2012;175:785–792 [DOI] [PubMed] [Google Scholar]
- 20.Schotte DE, Cohen E, Singh SP. Effects of weight cycling on metabolic control in male outpatients with non-insulin-dependent diabetes mellitus. Health Psychol 1990;9:599–605 [DOI] [PubMed] [Google Scholar]
- 21.Jeffery RW, Wing RR, French SA. Weight cycling and cardiovascular risk factors in obese men and women. Am J Clin Nutr 1992;55:641–644 [DOI] [PubMed] [Google Scholar]
- 22.Li Z, Hong K, Wong E, Maxwell M, Heber D. Weight cycling in a very low-calorie diet programme has no effect on weight loss velocity, blood pressure and serum lipid profile. Diabetes Obes Metab 2007;9:379–385 [DOI] [PubMed] [Google Scholar]
- 23.Waring ME, Eaton CB, Lasater TM, Lapane KL. Incident diabetes in relation to weight patterns during middle age. Am J Epidemiol 2010;171:550–556 [DOI] [PMC free article] [PubMed] [Google Scholar]
- 24.Hamm P, Shekelle RB, Stamler J. Large fluctuations in body weight during young adulthood and twenty-five-year risk of coronary death in men. Am J Epidemiol 1989;129:312–318 [DOI] [PubMed] [Google Scholar]
- 25.Olson MB, Kelsey SF, Bittner V, et al. Women’s Ischemia Syndrome Evaluation Study Group . Weight cycling and high-density lipoprotein cholesterol in women: evidence of an adverse effect: a report from the NHLBI-sponsored WISE study. J Am Coll Cardiol 2000;36:1565–1571 [DOI] [PubMed] [Google Scholar]
- 26.Blair SN, Shaten J, Brownell K, Collins G, Lissner L. Body weight change, all-cause mortality, and cause-specific mortality in the Multiple Risk Factor Intervention Trial. Ann Intern Med 1993;119:749–757 [DOI] [PubMed] [Google Scholar]
- 27.Folsom AR, French SA, Zheng W, Baxter JE, Jeffery RW. Weight variability and mortality: the Iowa Women’s Health Study. Int J Obes Relat Metab Disord 1996;20:704–709 [PubMed] [Google Scholar]
- 28.Surmi BK, Webb CD, Ristau AC, Hasty AH. Absence of macrophage inflammatory protein-1alpha does not impact macrophage accumulation in adipose tissue of diet-induced obese mice. Am J Physiol Endocrinol Metab 2010;299:E437–E445 [DOI] [PMC free article] [PubMed] [Google Scholar]
- 29.Pfaffl MW. A new mathematical model for relative quantification in real-time RT-PCR. Nucleic Acids Res 2001;29:e45. [DOI] [PMC free article] [PubMed] [Google Scholar]
- 30.Gutierrez DA, Kennedy A, Orr JS, et al. Aberrant accumulation of undifferentiated myeloid cells in the adipose tissue of CCR2-deficient mice delays improvements in insulin sensitivity. Diabetes 2011;60:2820–2829 [DOI] [PMC free article] [PubMed] [Google Scholar]
- 31.Grubbs F. Procedures for detecting outlying observations in samples. Technometrics 1969;11:1–21 [Google Scholar]
- 32.Coenen KR, Gruen ML, Chait A, Hasty AH. Diet-induced increases in adiposity, but not plasma lipids, promote macrophage infiltration into white adipose tissue. Diabetes 2007;56:564–573 [DOI] [PubMed] [Google Scholar]
- 33.Deopurkar R, Ghanim H, Friedman J, et al. Differential effects of cream, glucose, and orange juice on inflammation, endotoxin, and the expression of Toll-like receptor-4 and suppressor of cytokine signaling-3. Diabetes Care 2010;33:991–997 [DOI] [PMC free article] [PubMed] [Google Scholar]
- 34.Fujisaka S, Usui I, Bukhari A, et al. Regulatory mechanisms for adipose tissue M1 and M2 macrophages in diet-induced obese mice. Diabetes 2009;58:2574–2582 [DOI] [PMC free article] [PubMed] [Google Scholar]
- 35.Wu H, Ghosh S, Perrard XD, et al. T-cell accumulation and regulated on activation, normal T cell expressed and secreted upregulation in adipose tissue in obesity. Circulation 2007;115:1029–1038 [DOI] [PubMed] [Google Scholar]
- 36.Schoenborn JR, Wilson CB. Regulation of interferon-gamma during innate and adaptive immune responses. Adv Immunol 2007;96:41–101 [DOI] [PubMed] [Google Scholar]
- 37.Gately MK, Renzetti LM, Magram J, et al. The interleukin-12/interleukin-12-receptor system: role in normal and pathologic immune responses. Annu Rev Immunol 1998;16:495–521 [DOI] [PubMed] [Google Scholar]
- 38.Kim HP, Imbert J, Leonard WJ. Both integrated and differential regulation of components of the IL-2/IL-2 receptor system. Cytokine Growth Factor Rev 2006;17:349–366 [DOI] [PubMed] [Google Scholar]
- 39.Woodland DL, Kohlmeier JE. Migration, maintenance and recall of memory T cells in peripheral tissues. Nat Rev Immunol 2009;9:153–161 [DOI] [PubMed] [Google Scholar]
- 40.Stein LJ. Repeated weight fluctuation increases plasma insulin in the obese Wistar fatty diabetic rat. Physiol Behav 1992;52:345–350 [DOI] [PubMed] [Google Scholar]
- 41.Lu H, Buison A, Uhley V, Jen KL. Long-term weight cycling in female Wistar rats: effects on metabolism. Obes Res 1995;3:521–530 [DOI] [PubMed] [Google Scholar]
- 42.Barbosa-da-Silva S, Fraulob-Aquino JC, Lopes JR, Mandarim-de-Lacerda CA, Aguila MB. Weight cycling enhances adipose tissue inflammatory responses in male mice. PLoS ONE 2012;7:e39837. [DOI] [PMC free article] [PubMed] [Google Scholar]
- 43.Zeyda M, Huber J, Prager G, Stulnig TM. Inflammation correlates with markers of T-cell subsets including regulatory T cells in adipose tissue from obese patients. Obesity (Silver Spring) 2011;19:743–748 [DOI] [PubMed] [Google Scholar]
- 44.Rocha VZ, Folco EJ, Sukhova G, et al. Interferon-gamma, a Th1 cytokine, regulates fat inflammation: a role for adaptive immunity in obesity. Circ Res 2008;103:467–476 [DOI] [PMC free article] [PubMed] [Google Scholar]
- 45.Stolarczyk E, Vong CT, Perucha E, et al. Improved insulin sensitivity despite increased visceral adiposity in mice deficient for the immune cell transcription factor T-bet. Cell Metab 2013;17:520–533 [DOI] [PMC free article] [PubMed] [Google Scholar]
- 46.Strissel KJ, DeFuria J, Shaul ME, Bennett G, Greenberg AS, Obin MS. T-cell recruitment and Th1 polarization in adipose tissue during diet-induced obesity in C57BL/6 mice. Obesity (Silver Spring) 2010;18:1918–1925 [DOI] [PMC free article] [PubMed] [Google Scholar]
- 47.McGillicuddy FC, Chiquoine EH, Hinkle CC, et al. Interferon gamma attenuates insulin signaling, lipid storage, and differentiation in human adipocytes via activation of the JAK/STAT pathway. J Biol Chem 2009;284:31936–31944 [DOI] [PMC free article] [PubMed] [Google Scholar]
- 48.Deng T, Lyon CJ, Minze LJ, et al. Class II major histocompatibility complex plays an essential role in obesity-induced adipose inflammation. Cell Metab 2013;17:411–422 [DOI] [PMC free article] [PubMed] [Google Scholar]
- 49.Ojdana D, Safiejko K, Lipska A, Radziwon P, Dadan J, Tryniszewska E. Effector and memory CD4+ and CD8+ T cells in the chronic infection process. Folia Histochem Cytobiol 2008;46:413–417 [DOI] [PubMed] [Google Scholar]


