Abstract
Elevated p53 expression is associated with several kidney diseases including diabetic nephropathy (DN). However, the mechanisms are unclear. We report that expression levels of transforming growth factor-β1 (TGF-β), p53, and microRNA-192 (miR-192) are increased in the renal cortex of diabetic mice, and this is associated with enhanced glomerular expansion and fibrosis relative to nondiabetic mice. Targeting miR-192 with locked nucleic acid–modified inhibitors in vivo decreases expression of p53 in the renal cortex of control and streptozotocin-injected diabetic mice. Furthermore, mice with genetic deletion of miR-192 in vivo display attenuated renal cortical TGF-β and p53 expression when made diabetic, and have reduced renal fibrosis, hypertrophy, proteinuria, and albuminuria relative to diabetic wild-type mice. In vitro promoter regulation studies show that TGF-β induces reciprocal activation of miR-192 and p53, via the miR-192 target Zeb2, leading to augmentation of downstream events related to DN. Inverse correlation between miR-192 and Zeb2 was observed in glomeruli of human subjects with early DN, consistent with the mechanism seen in mice. Our results demonstrate for the first time a TGF-β–induced feedback amplification circuit between p53 and miR-192 related to the pathogenesis of DN, and that miR-192–knockout mice are protected from key features of DN.
Diabetic nephropathy (DN) is a microvascular complication that leads to kidney dysfunction and end-stage renal disease. DN is characterized by renal glomerular hypertrophy, basement membrane thickening, and fibrosis due to accumulation of extracellular matrix (ECM) proteins like collagen (1–4). Transforming growth factor-β1 (TGF-β) expression is increased in renal mesangial cells (MCs) in DN and acts as a profibrotic agent inducing ECM accumulation, hypertrophy, and cell survival. Clinical features of DN include proteinuria, albuminuria, and progressive glomerular dysfunction (5–8).
Evidence suggests that the tumor suppressor p53 plays a role in several kidney diseases, and its inhibition confers a protective phenotype (9–14). It is also implicated in the pathogenesis of DN (15,16), although the specific mechanisms are not clear. p53 has been shown to mediate podocyte apoptosis related to DN (14). p53 also acts in concert with TGF-β–responsive Smads to promote the expression of profibrotic genes such as plasminogen activator inhibitor-1 (12). In cancer cells, p53 binds to a p53 response element (p53-RE) in the promoter of microRNA-192 (miR-192) to induce its expression, and miR-192 in turn mediates tumor-suppressive functions of p53 (17–19). miR-192 also regulates the MDM2-p53 autoregulatory axis in multiple myeloma cells (20). However, it is not known whether miR-192 regulates p53 or vice versa in the kidney and in MCs.
miRNAs are short noncoding RNAs that bind to the 3′ untranslated region of target genes to repress their expression via posttranscriptional mechanisms (21,22). Increasing evidence suggests that miRNAs can play a key role in the development of diabetes complications, especially DN (23). miR-192 is a key player downstream of TGF-β that increases collagen gene expression in MCs by targeting E-box repressors Zeb1/2 (5). TGF-β also triggers miRNA circuits involving miR-192 and miR-200b/c to increase TGF-β expression itself and accelerate DN (24). miR-192 expression is augmented by TGF-β or high-glucose (HG) treatment of MCs, podocytes, and tubular cells (5,25–27). Glomeruli from mouse models of diabetes and obstructive kidney disease and renal biopsies from patients with certain kidney diseases have increased miR-192 expression that is related to fibrosis and renal complications (25,28–31). TGF-β also induces an miRNA circuit involving miR-192 and miR-216a/217 that targets PTEN and activates Akt kinase (32). Inhibition of miR-192 in diabetic mice with locked nucleic acid–modified anti–miR-192 (LNA-anti-miR-192) oligonucleotides (oligos) reduces proteinuria and renal fibrosis associated with DN (33). Inhibition of TGF-β signaling by paclitaxel reduces miR-192 expression and associated renal fibrosis (34). Therefore several lines of evidence suggest that controlling miR-192 expression and its downstream pathways may be beneficial for treating DN (23).
We used in vivo and in vitro models to evaluate whether there is cross talk regulation between miR-192 and p53 in the pathogenesis of DN. The proximal p53 promoter has an E-box (35) whose function has not been systematically examined. Since miR-192 targets Zeb2, we hypothesized that the p53 promoter E-box could be regulated by Zeb1/2, and consequently by miR-192. We report the operation of a feedback amplification circuit between p53 and miR-192 downstream of TGF-β signaling in MCs related to the pathogenesis of DN. Furthermore, we generated miR-192–knockout (KO) mice and found that they have decreased p53 levels and increased Zeb2 levels in renal glomeruli, and also display protection from key features of DN relative to wild-type (WT) mice.
RESEARCH DESIGN AND METHODS
Animal studies.
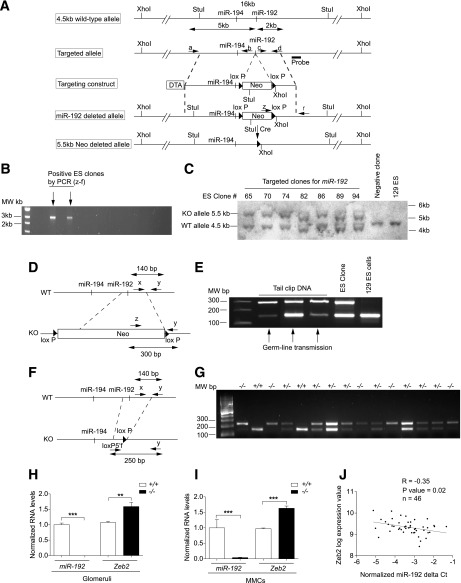
All animal studies were performed according to a protocol approved by the Institutional Animal Care and Use Committee at the Beckman Research Institute of the City of Hope. C57BL/6 mice, miR-192–KO mice, and littermate WT controls were made diabetic with multiple low-dose streptozotocin (STZ) injections. Renal cortical sections from 2-week STZ-injected diabetic mice injected with LNA oligos were obtained as previously described (33). Kidneys from p53-KO mice were provided by Dr. Keigo Machida (University of Southern California, Los Angeles, CA). db/db and genetic control db/+ mice (10–12 weeks of age) were from Jackson Laboratories (Bar Harbor, ME). Primers used for generating miR-192–KO mice (Fig. 3A) were as follows: a, 5′-GGTATCGATCAAGGGTTCCGGGACCTGCTGTGGCTACC-3′; b, 5′-CGAAATCGATCTTGGCAGCCTGCTGACAACCCACCATTCG-3′; c, 5′-TTGACTCGAGAGTCAGGGTGGGGGAGGGTATCAAAGTCAA-3′; d, 5′-TGTGAAGCTTCCTGCATACATGACTGCATGCACACCCACA-3′; z, 5′-GATTGGGAAGACAATAGCAGGCA-3′; f, 5′-GCCAAAGCTTACCTGAGGGTATCTAACCTTACCTTCTGGC-3′; x, 5′-CCCACTCGAGAGCCATAACGACTCGAAGGAGCAGGGTGGG-3′; y, 5′-TTGACAGGTGTCCTGAAGGGCAGTCAGGCAA-3′; LoxP5′f, 5′-AATTCCTGCAGCCCAATTCCGATCATAT-3′; Southern blot probe F, 5′-ACATACAGGTGCCTCCTTGTGAAGAGCAGCATGT-3′; and Southern blot probe R, 5′-TAGTGTAAGGTCTGGGCCCAAGAGTGTCAGACTA-3′.
FIG. 3.
Generation of miR-192–KO mice. A: Schematic diagram showing design of the targeting vector used to generate miR-192-KO mice. B: Gel picture showing PCR screening for targeted miR-192–KO alleles from Neo-resistant ES clones. Arrows, positive clones identified by PCR screening. C: Southern blot confirming recombinant clones. D: Schematic diagram showing genomic structures of WT and KO alleles and PCR approach. E: Gel picture confirming germline transmission of the miR-192–deleted allele. F: Schematic genomic structures of Neo-deleted allele and PCR approach for identification of the deletion. G: Gel picture showing PCR analysis for genotyping performed using tail DNA. +/+, WT mice; +/−, heterozygous mice; −/−, homozygous mice. H and I: qRT-PCR analysis of miR-192 and Zeb2 in +/+ or −/− glomeruli (H) and MMCs (I); n = 3. **P < 0.01; ***P < 0.001. J: Scatter plot showing miR-192 and Zeb2 expression in glomeruli of type 2 diabetic human patients; n = 46. Patient information is provided in the RESULTS. R = −0.35; P value = 0.02.
Cell culture and materials.
Primary mouse MCs (MMCs) were cultured from renal glomeruli (5). Recombinant human TGF-β1 was from R&D Systems, Inc. (Minneapolis, MN). miR-192 mimics (192-M), negative control mimics (NC), Zeb2 siRNA (si-Zeb2) ON-TARGETplus SMART pool, and ON-TARGETplus Nontargeting pool (Ctrl pool) were obtained from Dharmacon (Lafayette, CO). Cells were serum depleted for 48 h and then treated with TGF-β for the indicated time periods.
Quantitative RT-PCR.
Real-time quantitative RT-PCR (qRT-PCR) analysis was performed as previously described (5). 18sII primers (Ambion) or cyclophilin-A (CypA) were used as internal controls, and quantitative analysis was performed using the ∆Ct method. The sequence-specific PCR primers used were as follows: miR-192, 5′-CTGACCTATGAATTGACAGCC-3′; p53 forward, 5′-CGAAAGAAGACAGGCAGACTTTTCG-3′; p53 reverse, 5′-GAAGGTAAGGATAGGTCGGCGGTTC-3′; Col1a2 forward, 5′-CAGAACATCACCTACCACTGCAA-3′; Col1a2 reverse, 5′-TTCAACATCGTTGGAACCCTG-3′; Col4a1 forward, 5′-GCCTTCCGGGCTCCTCAG-3′; Col4a1 reverse, 5′-TTATCACCAGTGGGTCCG-3′; CypA forward, 5′-ATGGTCAACCCCACCGTGT-3′; CypA reverse, 5′-TTCTTGCTGTCTTTGGAACTTTGTC-3′.
Western blot analysis.
Protein extraction and subsequent analysis was performed as previously described (32). The antibodies used were p53 and CypA (Cell Signaling Technology, Beverly, MA) and α-tubulin (Santa Cruz Biotechnology).
Urine protein and albumin assays.
Urine collection (24 h) from mice and protein measurements were performed as previously described (33). Albumin-creatinine ratios (ACRs) in mouse urine samples were analyzed using Exocell Albuwell M and Creatinine companion kits (Exocell, Inc., Philadelphia, PA).
Human study subjects.
Kidney tissue was collected by biopsy from 46 Southwestern American Indians with type 2 diabetes who were enrolled in a randomized, placebo-controlled, clinical trial (clinicaltrials.gov reg. no. NCT00340678) (36,37). This study was approved by the review board of the National Institute of Diabetes and Digestive and Kidney Diseases. Each participant gave informed consent. Subjects were at least 18 years of age at enrollment in the trial and underwent percutaneous kidney biopsy at the end of the randomized treatment period (∼6 years) (37). Specimens were placed into RNAlater and stored at −20°C until glomeruli were microdissected from biopsy cores (38).
Small RNA preparation and quantification of miRNAs from human renal biopsies.
Total RNA was isolated from microdissected glomeruli using RNeasy kits (QIAGEN) to obtain the large RNA and flowthrough small RNA fractions as per the manufacturer’s protocols. To recover the small RNA fraction, the flowthrough was further applied to RNeasy MiniElute Cleanup kit (QIAGEN) as per the manufacturer’s protocol.
miRNA expression was obtained from TaqMan miRNA assays (Applied Biosystems). Small RNA from human glomeruli were reverse transcribed using TaqMan Megaplex RT primers and further amplified by Megaplex PreAmp primers (Applied Biosystems) prior to qRT-PCR. miRNA expression (Ct values; threshold cycle) were normalized by U6 small nuclear RNA and RNU44 and RNU48 small nucleolar RNA (snoRNA). The normalized ΔCt was calculated by subtracting miRNA Ct from the geometric mean of small nuclear RNA and small nucleolar RNA Ct.
mRNA microarray profiling and analysis (human glomeruli).
Total RNA isolated from microdissected glomeruli as previously described (39,40) was reverse transcribed and linearly amplified to be hybridized to Affymetrix HG-U133A microarrays for profiling mRNA expression using Affymetrix protocols. The microarray analysis was described before, and robust multichip average was used to normalize the data (41).
Correlation analysis (human glomeruli miRNA and mRNA).
Pearson correlation was performed in the correlation analysis. miRNA ΔCt was correlated with mRNA hybridization log2-transformed intensity. Arbitrary fold change of miRNAs was calculated from 2ΔCt.
Immunohistochemistry.
Immunostaining of paraffin-embedded renal cortical sections was performed as previously described (33). The antibodies used were p53 (Novus Biological; Cell Signaling) and TGF-β (Santa Cruz Biotechnology). Hematoxylin and eosin, periodic acid–Schiff (PAS), and Masson’s trichrome staining were performed to analyze kidney structural function and ECM deposition (33).
Plasmids and promoters.
miR-192 promoter constructs were provided by Dr. Carlo Croce (Ohio State University, Columbus, OH). The 0.7-kb p53 promoter construct was provided by Dr. David Reisman (University of South Carolina, Columbia, SC). The WT mouse p53 promoter was made by amplifying the p53 genome region using primers p53 forward 5′-CTGAGATCTTACTTGTTATGGCGACTATCCAG-3′ and p53 reverse 5′-GGCAAGCTTCTGTAGTCGCTACCTACAGCC-3′ cloned into BglII and HindIII sites. The E-box mutant p53 promoter was made by site-directed mutagenesis using the primers p53 forward 5′-TTTCCCCTCCTACGAGCTCACCCTGG-3′ and p53 reverse 5′-CCAGGGTGAGCTCGTAGGAGGGGAAA-3′. The p53 expression vector was from Dr. Emily Wang and the pCEP4 empty vector from Dr. David Ann (Beckman Research Institute of the City of Hope).
Luciferase assays.
MMCs were transfected with reporter plasmids NC, 192-M, or si-Zeb2 using a Nucleofector and Basic Nucleofector Kit (Lonza) as previously described (5). Ratios of firefly/renilla were calculated, and values were normalized to control conditions.
Cell number and cellular protein levels.
MMCs were trypsinized and counted using a Coulter Counter with 100-µm aperture (Beckman Coulter). Cells were lysed and total protein content measured using the Bio-Rad Protein Assay (Bio-Rad) (32).
Statistical analyses.
PRISM Software (Graphpad, San Diego, CA) was used for data analysis. Results are expressed as mean ± SEM from multiple experiments. Student t tests were used to compare two groups. Statistical significance was detected at the 0.05 level.
RESULTS
Increased p53 expression in the renal cortex of diabetic db/db mice relative to control db/+ mice.
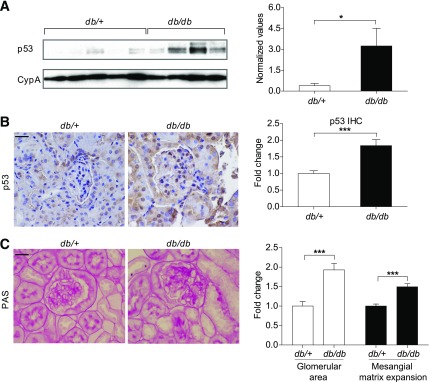
We examined expression of p53 in Leprdb/db mice (model of type 2 diabetes) (db/db). Renal cortical lysates from 10–12-week-old db/db mice showed a significant increase in p53 compared with lysates from control db/+ mice, as examined by Western blot (Fig. 1A) and immunostaining (Fig. 1B). Glomerular area was also significantly increased in db/db mice compared with control db/+ mice (Fig. 1C). PAS staining showed a significant increase in mesangial matrix expansion in db/db compared with control db/+ mice (Fig. 1C). These results demonstrate that p53 expression is increased in cortical lysates and glomeruli of type 2 diabetic mice relative to control mice, and this is associated with glomerular hypertrophy and fibrosis.
FIG. 1.
Increased p53 expression in the renal cortex of diabetic db/db mice relative to control db/+ mice. A: Western blot and quantification of p53 expression from renal cortical lysates of 10–12-week-old db/+ (n = 5) and db/db mice (n = 4). Representative immunostaining and quantification for p53 (B) and PAS (C) staining from cortical sections of db/+ and db/db mice; n = 4 per group. *P < 0.05; ***P < 0.001. Error bars, SEM. Scale bar, 20 μm.
miR-192 regulates p53 expression in the renal cortex of control and STZ-diabetic mice.
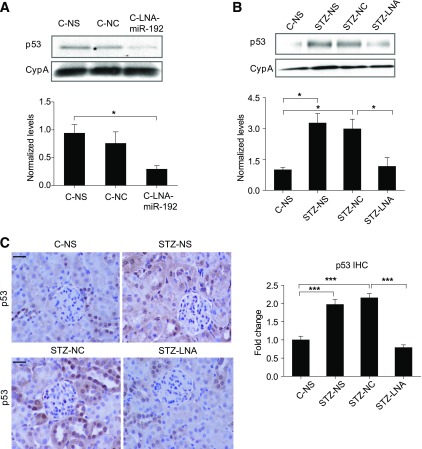
We next examined p53 expression in STZ-injected mice (model of type 1 diabetes). Since we hypothesized that p53 may be regulated by miR-192 by downregulation of Zeb2 to confer derepression at the E-box in the p53 promoter, we examined the effect of inhibiting miR-192 in vivo on p53 expression. We recently showed that inhibition of renal miR-192 with LNA-anti-miR-192 in nondiabetic and STZ-diabetic mice targets downstream signaling molecules and decreases profibrotic gene expression, renal fibrosis, hypertrophy, and proteinuria (32,33). We now found that cortical lysates of nondiabetic mice injected with LNA-anti-miR-192 (C-LNA) showed significantly lower p53 expression compared with controls injected with normal saline (C-NS) (Fig. 2A). Cortical lysates of 2-week STZ-diabetic mice (STZ-NS) had significantly higher p53 expression compared with nondiabetic controls (C-NS), and this was significantly attenuated in lysates from STZ-diabetic mice injected with LNA-anti-miR-192 (STZ-LNA) compared with control LNA (STZ-NC) (Fig. 2B). Immunostaining also revealed that p53 expression was significantly higher in glomeruli of STZ-NS and STZ-NC mice than C-NS mice, and this was significantly attenuated in glomeruli of STZ-LNA mice compared with STZ-NC (Fig. 2C), with a similar trend in renal tubules of these mice. These results demonstrate that p53 expression is increased in cortical lysates and glomeruli of STZ-diabetic mice relative to respective control mice, and that inhibition of miR-192 decreases p53 expression in these mice.
FIG. 2.
miR-192 regulates p53 expression in the renal cortex of control and STZ-diabetic mice. A: Representative Western blot and quantification of p53 expression in cortical lysates of nondiabetic mice injected with normal saline (C-NS), negative control oligos LNA-anti-miR-239b (C-NC), or LNA-anti-miR-192 oligos (C-LNA) (2 mg/kg) for 6 h; n = 3 per group. B: Representative Western blot and quantification of p53 expression in cortical lysates of control mice injected with normal saline (C-NS, n = 2) and STZ-diabetic for 2 weeks injected with normal saline (STZ-NS, n = 3), negative control oligos LNA-anti-miR-239b (STZ-NC, n = 3), or LNA-anti-miR-192 (STZ-LNA, n = 4). C: Representative immunostaining and quantification of glomerular p53 from cortical sections of C-NS and STZ-NS mice (n = 5 per group) and STZ-NC (n = 6) and STZ-LNA mice (n = 7). *P < 0.05; ***P < 0.001. Error bars, SEM. Scale bar, 20 μm.
Generation of miR-192–KO mice.
In order to further determine the in vivo functional role of miR-192 expression under normal and diabetic conditions and evaluate cross talk with p53, we generated mice deficient in miR-192 (miR-192–KO) and also examined whether miR-192 regulation of p53 is lost in these mice. The miR-192 gene was deleted in 129/SvJ embryonic stem (ES) cells with a neomycin (Neo)-resistant gene cassette and diphtheria toxin A. A 5-kb upstream long arm of miR-192 was cloned between diphtheria toxin A and Neo. A short 2-kb arm of miR-192 was cloned downstream of Neo (Fig. 3A). 129/SvJ ES cells were electroporated with the targeting vector. Out of 168 Neo-resistant colonies, 18 clones were homologous recombinants (Fig. 3B) and confirmed by Southern blot analysis. Digestion of genomic DNA at the StuI restriction site resulted in a 5.5-kb KO allele and a 4.5-kb WT allele band, whereas only the WT band was observed in negative controls (Fig. 3C). Three ES clones out of six recombinant clones yielded chimeric mice, and germline transmission was obtained from one of these clones (Fig. 3D and E). Chimeric miR-192–KO mice were crossed with WT 129/SvJ Cre mice to generate Neo-deleted heterozygotes (+/−), which were crossed again to generate homozygous (−/−) mice. Genotyping was performed using tail DNA and primers specific for the WT allele (x), a common allele (y), and a deleted allele-specific primer (loxP5′f) (Fig. 3F and G). The miR-192–KO mice were healthy and viable and showed loss of miR-192 and also a reciprocal increase in the expression of its target Zeb2 in the kidney glomeruli (Fig. 3H) and MMCs (Fig. 3I) and no renal abnormalities relative to the genetic control WT mice.
Relevance to human DN.
Southwestern American Indians have a high incidence and prevalence of type 2 diabetes, and those with diabetes often develop DN (42). To test the relevance of the miR-192–Zeb1/2 relationship in human DN, we profiled miR-192 levels in RNA isolated from the glomeruli of kidney biopsies from 46 Southwestern American Indians with type 2 diabetes (37). The mean (SD) age of the patients was 44.7 years (9.89), 80% were female, median GFR was 145.8 mL/min (IQR 112.74–183.1), and median ACR was 42.0 mg/g (IQR 13.6–158.3). Interestingly, miR-192 expression was negatively correlated with the expression of its known targets, Zeb2 (R = −0.35, P value = 0.02) (Fig. 3J) and Zeb1 (R = −0.30, P value = 0.04), in these patients, consistent with our findings in mice and MMCs that miR-192 represses Zeb1/2 (5,33) and in the miR-192–KO mice above.
Reduced p53 expression in kidneys of miR-192–KO diabetic mice.
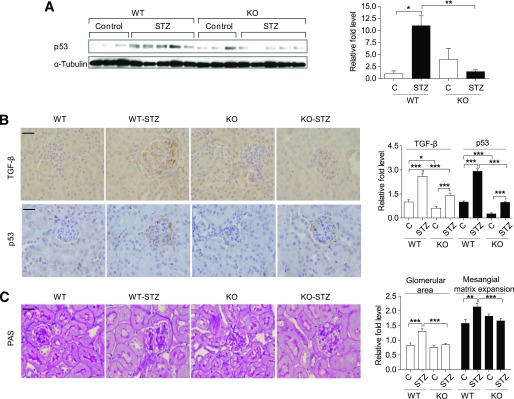
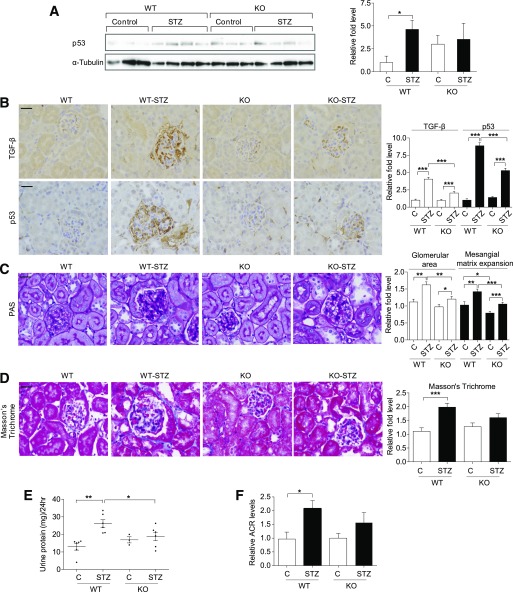
To determine the effect of miR-192–KO on p53 expression in normal and diabetic mice, we analyzed cortical lysates from 2-week control and STZ-diabetic mice (WT and miR-192–KO). Cortical lysates from WT STZ-diabetic mice showed significantly higher p53 expression compared with WT controls, whereas cortical lysates from miR-192-KO STZ-diabetic mice did not show a significant increase in p53 expression compared with non-diabetic miR-192-KO controls (Fig. 4A). Since TGF-β signaling is activated under diabetic conditions and miR-192 increases TGF-β expression (24), we performed immunostaining for TGF-β and p53 using cortical sections of these mice. Glomeruli of both WT STZ-diabetic and miR-192–KO STZ-diabetic mice showed increased TGF-β and p53 expression compared with nondiabetic controls (Fig. 4B). However, miR-192–KO nondiabetic and miR-192–KO STZ-diabetic mice showed significantly lower TGF-β and p53 expression compared with WT mice (Fig. 4B). In addition, a significant increase in glomerular area was observed in WT STZ-diabetic mice but not in the miR-192–KO STZ-diabetic mice (Fig. 4C). Quantification of PAS-positive staining in glomeruli revealed increased mesangial matrix levels in WT STZ-diabetic mice but not in the miR-192–KO STZ-diabetic mice (Fig. 4C). Increases in glomerular area and mesangial matrix expansion were also significantly attenuated in miR-192–KO STZ-diabetic mice compared with WT STZ-diabetic mice (Fig. 4C). These results indicate that kidneys of miR-192–KO STZ-diabetic mice have lower expression levels of TGF-β and p53 along with reduced glomerular area and mesangial matrix expansion relative to WT STZ-diabetic mice.
FIG. 4.
Reduced p53 expression in kidneys of miR-192–KO diabetic mice. A: Western blot and quantification of p53 expression in cortical lysates of WT or miR-192-KO mice (control or STZ-diabetic for 2 weeks). Control mice, n = 3 per group; diabetic mice, n = 5 per group. Representative immunostaining and quantification of TGF-β and p53 (B) and PAS (C) staining from cortical sections of WT or miR-192-KO mice (control or STZ-diabetic). Control mice, n = 3–5 per group; diabetic mice, n = 3–6 per group. Bar graph adjacent to C shows glomerular area and mesangial matrix expansion. *P < 0.05; **P < 0.01; ***P < 0.001. Error bars, SEM. Scale bar, 20 μm.
Attenuation of key features of DN at 22 weeks in diabetic miR-192–KO mice.
Accumulation of ECM proteins, progressive proteinuria, and albuminuria are more clearly evident at later stages of DN compared with early stages. Therefore, we examined diabetic mice at 22 weeks post–diabetes onset. Similar to the 2-week STZ mice, cortical lysates from 22-week WT STZ-diabetic mice showed significantly higher p53 expression compared with nondiabetic controls (Fig. 5A). However, lysates from miR-192–KO STZ-diabetic mice did not show an increase in p53 expression compared with nondiabetic KO controls (Fig. 5A). Immunostaining showed that glomeruli from both WT STZ-diabetic and miR-192–KO STZ-diabetic mice had significantly higher TGF-β and p53 expression compared with respective controls from each group (Fig. 5B). However, the magnitude of increase in TGF-β and p53 expression was significantly lower in miR-192–KO STZ-diabetic than in WT STZ-diabetic mice. Whereas WT diabetic mice showed significant increases in glomerular area, mesangial matrix expansion (PAS-positive mesangial area), and interstitial fibrosis (trichrome-positive area) compared with WT nondiabetic mice, at 22 weeks, all these parameters were ameliorated in miR-192–KO STZ-diabetic mice compared with WT STZ-diabetic mice (Fig. 5C and D). WT STZ-diabetic mice showed a significant increase in urine protein and albumin levels compared with WT controls at 19 weeks; however, both these parameters were attenuated in miR-192–KO STZ-diabetic mice compared with WT STZ-diabetic mice (Fig. 5E and F). Overall, these results indicate that TGF-β and p53 expression is attenuated at 22 weeks in miR-192–KO STZ-diabetic mice, and these mice show reduced severity in key pathophysiological parameters of DN.
FIG. 5.
Attenuation of key features of DN at 22 weeks in diabetic miR-192–KO mice. A: Western blot and quantification of p53 expression in cortical lysates of WT or miR-192-KO mice (control or STZ-diabetic for 22 weeks). Control mice, n = 3 per group; diabetic mice, n = 4 per group. Representative immunostaining and quantification of TGF-β and p53(B), PAS staining (C), and Masson’s trichrome staining (D) from cortical sections of WT and miR-192–KO control or STZ-diabetic mice; n = 3–6 mice per group. E: Urine protein levels at 19 weeks post–diabetes induction from WT and miR-192–KO control or STZ-injected mice (WT-C, n = 6; WT STZ-diabetic, n = 6; KO-C, n = 3; KO-STZ, n = 6). F: Bar graph showing relative ACR levels at 19 weeks post–diabetes induction from urine samples of WT or miR-192-KO mice (control or STZ-diabetic) (WT-C, n = 5; WT STZ-diabetic, n = 5; KO-C, n = 3; KO-STZ, n = 5). *P < 0.05; **P < 0.01; ***P < 0.001. Error bars, SEM. Scale bar, 20 μm.
TGF-β induces transcriptional activation of p53 through miR-192 in MMCs.
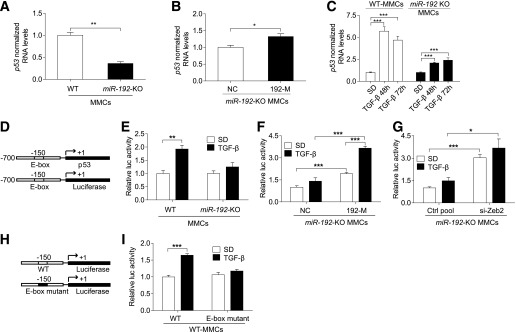
TGF-β treatment increases miR-192 expression in MMCs (5,24,32) and miR-192 regulates p53 expression in certain cancer cells (20). However, it is not known whether miR-192 regulates p53 expression in the kidney and in MMCs. To test this, we used MMCs isolated from WT and miR-192–KO mice. miR-192–KO MMCs showed significantly lower p53 expression compared with WT MMCs (Fig. 6A). Reconstitution with 192-M increased p53 expression compared with NC in miR-192–KO MMCs (Fig. 6B). Furthermore, TGF-β–induced p53 expression was lower in miR-192–KO MMCs compared with WT MMCs (Fig. 6C).
FIG. 6.
TGF-β induces transcriptional activation of p53 through miR-192 in MMCs. qRT-PCR analysis of p53 in WT and miR-192-KO MMCs under basal conditions (n = 4) (A), after transfection of miR-192–KO MMCs with control oligos (NC, 10 nmol/L) or miR-192 mimic oligos (192-M, 10 nmol/L, n = 3) (B), and in WT and miR-192–KO MMCs after TGF-β treatment (10 ng/mL, n = 3) (C). D: Schematic genome structure of the p53 promoter region and the p53 promoter luciferase reporter construct. Luciferase assay results showing p53 promoter activity ± TGF-β (5 ng/mL) in WT and miR-192–KO MMCs (n = 4) (E), in miR-192–KO MMCs after transfection with negative control (NC, 10 nmol/L) or miR-192 mimic oligos (192-M, 10 nmol/L, n = 3) (F), and in miR-192–KO MMCs after transfection with control siRNA pool (Ctrl pool, 10 nmol/L) or Zeb2 siRNA pool (si-Zeb2, 10 nmol/L, n = 3) (G). H: Schematic genome structure of the WT and E-box mutant p53 promoter constructs. I: Luciferase assay results showing WT and E-box mutant p53 promoter activity in WT MMCs; n = 3. SD, serum depletion. *P < 0.05; **P < 0.01; ***P < 0.001. Error bars, SEM.
The p53 promoter has an E-box and can be potentially repressed by E-box binding transcriptional repressors like Zeb2. Since miR-192 targets and downregulates Zeb2 expression, we tested whether TGF-β can induce p53 promoter activity via miR-192. We performed luciferase assays in WT and miR-192–KO MMCs using a 700-bp p53 promoter reporter construct (Fig. 6D). TGF-β significantly increased basal p53 promoter activity in WT MMCs but not in miR-192–KO MMCs (Fig. 6E). Reconstitution with 192-M (Fig. 6F) or inhibition of Zeb2 (si-Zeb2) (Fig. 6G) in miR-192–KO MMCs significantly increased p53 promoter activity compared with respective control oligos. The effect of TGF-β on the p53 promoter was also restored by transfecting 192-M or si-Zeb2 in miR-192–KO MMCs (Fig. 6F and G), supporting the notion that miR-192 or its target Zeb2 plays an important role in TGF-β–induced p53 promoter activation. Next, we performed luciferase assays in WT MMCs transfected with a WT or an E-box mutant p53 promoter construct (Fig. 6H). TGF-β increased activity of the WT p53 promoter but not the E-box mutant p53 promoter (Fig. 6I), indicating that the E-box region plays an important role in regulating p53 promoter activity. These results demonstrate that TGF-β induces transcriptional activation of p53, which can be mediated by miR-192 targeting Zeb2 in MMCs.
TGF-β induces transcriptional activation of miR-192 through p53 in MMCs.
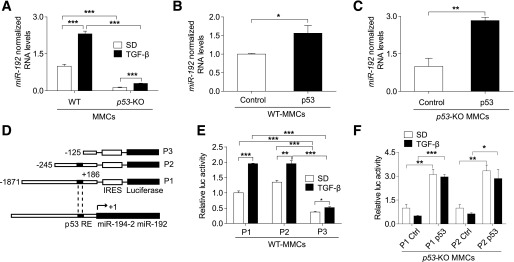
The molecular pathway(s) by which TGF-β regulates miR-192 expression in MMCs remain unclear. p53 regulates miR-192 expression by binding to its promoter (17–19,43). We examined whether p53 regulates miR-192 expression in MMCs by using WT and p53-KO MMCs. p53-KO MMCs showed significantly lower basal as well as TGF-β–induced miR-192 expression compared with WT MMCs (Fig. 7A). Reconstitution with a p53 expression vector (p53) significantly increased miR-192 expression compared with a control vector in both WT (Fig. 7B) and p53-KO MMCs (Fig. 7C). To further verify the involvement of p53, we tested the effect of TGF-β on three miR-192 promoter constructs, namely P1 (1,871 bp), P2 (245 bp) (both with an intact p53-RE), and P3 (125 bp) with a p53-RE deletion (Fig. 7D). TGF-β increased luciferase activity of all three promoter constructs in WT MMCs (Fig. 7E). However, basal and TGF-β–induced activity of P3 was significantly lower compared with P1 and P2 (Fig. 7E). Reconstitution of p53-KO MMCs with p53 significantly increased P1 and P2 promoter activity (Fig. 7F). Exogenous p53 also restored the effect of TGF-β on the miR-192 promoters (Fig. 7F). However, there was no further enhancement with TGF-β relative to the untreated control, possibly due to a saturation effect of exogenous p53. These results demonstrate that TGF-β–induced transcriptional activation of miR-192 is significantly regulated by p53 in MMCs.
FIG. 7.
TGF-β induces transcriptional activation of miR-192 through p53 in MMCs. qRT-PCR analysis of miR-192 in WT and p53-KO MMCs, under basal and TGF-β–treated (10 ng/mL) conditions; n = 3 (A). miR-192 expression after exogenous p53 expression in WT MMCs (n = 3) (B) and p53-KO MMCs (n = 3) (C). Control, control vector; p53, p53 expression vector (100–200 ng/mL). D: Schematic genome structure of the miR-192 promoter region and the three miR-192 promoter reporter constructs used: P1 (1,871 bp) and P2 (245 bp), miR-192 promoter constructs with a p53-RE, and P3 (125 bp), a p53-RE deletion mutant miR-192 promoter construct. Luciferase assay results showing miR-192 promoter activity ± TGF-β (5 ng/mL) in WT MMCs (n = 4) (E) and after transfection of p53-KO MMCs with a control vector or p53 expression vector (100–200 ng/mL, n = 4) (F). SD, serum depletion. *P < 0.05; **P < 0.01; ***P < 0.001. Error bars, SEM.
Attenuation in key features associated with DN in MMCs from miR-192–KO and p53-KO mice.
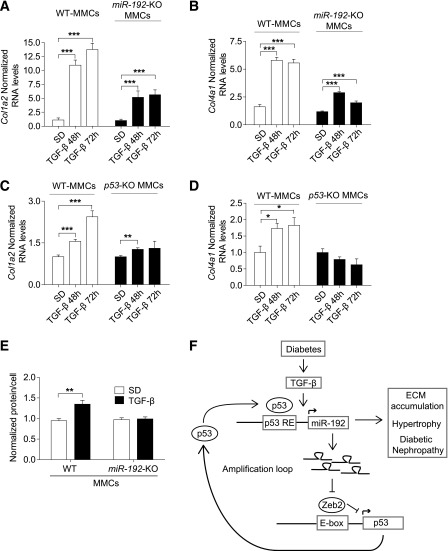
We next tested the in vitro functional significance of our identified mechanism of reciprocal upregulation of miR-192 and p53 by examining the expression of key ECM genes in WT, miR-192–KO MMCs, and p53-KO MMCs. Compared with WT MMCs, both miR-192–KO MMCs and p53-KO MMCs showed significantly lower or attenuated Col1a2 and Col4a1 gene induction after TGF-β treatment compared with WT MMCs (Fig. 8A–D). TGF-β–induced MC hypertrophy is another characteristic feature of DN. In WT MMCs, TGF-β treatment significantly increased cellular hypertrophy (total cellular protein levels per total cell number) (Fig. 8E). However, this increase in hypertrophy was not observed in miR-192–KO MMCs (Fig. 8E). Together, these results indicate that fibrosis and hypertrophy are attenuated in p53-KO MMCs and miR-192–KO MMCs, suggesting that reciprocal upregulation of p53 and miR-192 after TGF-β treatment can amplify downstream functional events associated with DN (Fig. 8F).
FIG. 8.
Attenuation in key features associated with DN in MMCs from miR-192–KO and p53-KO mice. qRT-PCR analysis of Col1a2 and Col4a1 in WT or miR-192-KO MMCs treated ± TGF-β (10 ng/mL, n = 3) (A and B) and in WT or p53-KO MMCs treated ± TGF-β (10 ng/mL, n = 3) (C and D). E: Cellular hypertrophy levels ± TGF-β treatment (10 ng/mL for 24h) of WT and miR-192–KO MMCs (n = 4). F: A schematic model of the mechanism of reciprocal regulation of miR-192 and p53 under diabetic conditions, which can lead to hypertrophy and ECM accumulation associated with the pathogenesis of DN. *P < 0.05; **P < 0.01; ***P < 0.001. Error bars, SEM.
DISCUSSION
Reports indicate that p53 induces miR-192 expression in cancer cells, and miR-192 in turn regulates some of the tumor-suppressive roles of p53 (17–19,43). Evidence also shows that miR-192 is upregulated in glomeruli of diabetic mice and in MCs treated with TGF-β or HG and plays a role in the pathogenesis of kidney diseases, including DN (3,5,24–27,32–34). We demonstrate for the first time that miR-192 and p53 are coregulated by a common pathway downstream of TGF-β signaling under diabetic conditions. We observed significantly higher p53 expression in the renal cortex of WT STZ-diabetic and db/db mice compared with respective controls. p53 expression was lower in kidneys of LNA-anti-miR-192–injected or miR-192–KO diabetic mice. On the other hand, miR-192 expression was lower in p53-KO MMCs. These data suggest that miR-192 and p53 upregulate each other’s expression under diabetic conditions. Notably, proteinuria, albuminuria, and increases in glomerular area, mesangial matrix expansion, and fibrosis were significantly attenuated in miR-192–KO STZ-diabetic mice compared with WT STZ-diabetic mice. To our knowledge, this represents the first study of DN in a mouse model deficient in a key miRNA known to have a functional role in renal cells. It is also known that p53 induces epithelial cell cycle arrest, podocyte apoptosis, kidney fibrosis, and insulin resistance and promotes kidney disease. Short-term inhibition of p53 has protective effects in many of these models (9–14). Our current studies suggest that reciprocal regulation of miR-192 and p53 might play a key role in the pathogenesis of DN. Translation elongation factor-1α is upregulated by p53 in some cancer cell lines (44), and enhanced protein synthesis by elongation factor-1α may be a key mechanism for the hypertrophy in kidney glomeruli from diabetic mice and MMCs treated with TGF-β. Since mesangial matrix expansion correlates with renal dysfunction, proteinuria, and albuminuria (2,45), miR-192-p53–induced hypertrophy and fibrosis of glomerular MMCs may contribute to renal dysfunction during early stages of DN.
Our in vitro mechanistic studies using MMCs cultured from miR-192–KO and p53-KO mice elucidate a more direct signaling mechanism between TGF-β, miR-192, and p53 under diabetic conditions. Basal and TGF-β–induced p53 expression were lower in miR-192–KO MMCs. Our results also showed that p53 is upregulated by miR-192 via targeting of Zeb2. This mechanism (Zeb1/2 targeted by miR-192) leads to the induction of collagen genes (Col1a2 and Col4a1) and other miRNAs (miR-216a/217 and miR-200 family) (5,24,32). Importantly, our results from microdissected glomeruli of biopsies from human patients with early DN show a significant inverse correlation between glomerular miR-192 expression and its direct target, Zeb2, confirming that Zeb2 is a target of miR-192 even in human tissues. To our knowledge this is the first report demonstrating the inverse correlation between miR-192 and Zeb2 in human glomeruli samples. We found that basal and TGF-β–induced miR-192 expressions were lower in p53-KO MMCs and that miR-192 was upregulated by p53 through the p53-RE in the miR-192 promoter region. TGF-β–mediated ECM gene induction was significantly attenuated in both miR-192–KO MMCs and p53-KO MMCs, highlighting the mechanistic and functional significance of this reciprocal regulation of miR-192 and p53 on downstream effects in MMCs related to DN. Figure 8F summarizes a novel mechanism by which TGF-β signaling induces reciprocal induction of miR-192 and p53 expression to create an amplification loop (via Zeb2 repression) that accelerates progression of DN.
We observed attenuation in proteinuria and albuminuria in miR-192–KO diabetic mice compared with WT diabetic mice. These results are consistent with previous results showing reduced proteinuria and albuminuria in diabetic mice injected with LNA-anti-miR-192 (33), suggesting that reduction of miR-192 protects the kidney from injury caused by diabetes. Notably, the miR-192–KO mice did not depict any renal abnormalities or renal fibrosis, suggesting that loss of miR-192 has no adverse effects in vivo. These results strongly support a key role for miR-192 in the progression of DN. Two studies showed that miR-192 expression was upregulated in renal biopsies obtained from patients with other kidney diseases (28,29). On the other hand, one study reported that miR-192 expression was decreased in RNA isolated from paraffin-embedded kidney biopsies of a small number of patients with severe DN and declining glomerular filtration rates, and this inversely correlated with fibrosis (46). Differences in the specific nature of biopsy tissues tested or the time of biopsy collection could be responsible for these variations (47). Further studies that include larger diabetic cohorts and comparisons with biopsies from normal nondiabetic volunteers are needed to determine whether miR-192 levels are increased in early stages of human DN and then decline at later stages due to tubular hypertrophy or apoptosis.
Hepatocyte nuclear factor and p53 are implicated for constitutive miR-192 promoter activity in proximal tubular cells, and TGF-β can decrease miR-192 expression in tubular cell lines (48,49). Kim et al. (18) also reported that p53 inhibits epithelial-mesenchymal transition of cancer cell lines through miR-192, suggesting p53 as a critical regulator. Mutations in tumor suppressors like p53 or other oncogenes might possibly alter the response to TGF-β in immortalized cell lines, or there are cell type–specific responses. We show here that p53 expression plays an important role in TGF-β–induced transcriptional activation of miR-192 in primary MCs with functional relevance to DN. Therefore, diabetic conditions (including TGF-β and HG) can induce a reciprocal upregulation of miR-192 and p53 in cells with WT miR-192 and p53 and lead to enhanced expression of ECM genes, fibrosis, and hypertrophy. Our findings also suggest that inhibition of miR-192 expression may be an approach worth evaluating to slow down the progression of DN.
ACKNOWLEDGMENTS
This work was supported by grants from the National Institutes of Health (R01-DK-081705 and R01-DK-058191 to R.N.) and by the Intramural Research Program of the National Institute of Diabetes and Digestive and Kidney Diseases (to R.G.N.).
No potential conflicts of interest relevant to this article were reported.
S.D.D. and M.K. designed experiments, researched data, and wrote the manuscript. S.P., L.L.L., and M.W. researched data. J.Y.L. and M.B. researched the human glomerular biopsies data. R.G.N. collected the human kidney tissue specimens, provided additional phenotypic data, and reviewed and edited the manuscript. R.N. designed experiments, wrote the manuscript, and supervised the project. R.N. is the guarantor of this work and, as such, had full access to all the data in the study and takes responsibility for the integrity of the data and the accuracy of the data analysis.
The authors are grateful to Dr. Matthias Kretzler (University of Michigan) for assistance with the human DN studies. The authors also thank Dr. Walter Tsark (City of Hope) for help with generating the miR-192–KO mice, the pathology core at City of Hope for the immunohistochemical staining, and Dr. Gregory Lawson (David Geffen School of Medicine at the University of California Los Angeles, Los Angeles, California) for histological analysis of the miR-192–KO mice.
REFERENCES
- 1.Ziyadeh FN. The extracellular matrix in diabetic nephropathy. Am J Kidney Dis 1993;22:736–744 [DOI] [PubMed] [Google Scholar]
- 2.Steffes MW, Osterby R, Chavers B, Mauer SM. Mesangial expansion as a central mechanism for loss of kidney function in diabetic patients. Diabetes 1989;38:1077–1081 [DOI] [PubMed] [Google Scholar]
- 3.Kato M, Park JT, Natarajan R. MicroRNAs and the glomerulus. Exp Cell Res 2012;318:993–1000 [DOI] [PMC free article] [PubMed] [Google Scholar]
- 4.Declèves AE, Sharma K. New pharmacological treatments for improving renal outcomes in diabetes. Nat Rev Nephrol 2010;6:371–380 [DOI] [PubMed] [Google Scholar]
- 5.Kato M, Zhang J, Wang M, et al. MicroRNA-192 in diabetic kidney glomeruli and its function in TGF-beta-induced collagen expression via inhibition of E-box repressors. Proc Natl Acad Sci USA 2007;104:3432–3437 [DOI] [PMC free article] [PubMed] [Google Scholar]
- 6.Yamamoto T, Nakamura T, Noble NA, Ruoslahti E, Border WA. Expression of transforming growth factor beta is elevated in human and experimental diabetic nephropathy. Proc Natl Acad Sci USA 1993;90:1814–1818 [DOI] [PMC free article] [PubMed] [Google Scholar]
- 7.Sharma K, Ziyadeh FN, Alzahabi B, et al. Increased renal production of transforming growth factor-beta1 in patients with type II diabetes. Diabetes 1997;46:854–859 [DOI] [PubMed] [Google Scholar]
- 8.Kato M, Yuan H, Xu ZG, et al. Role of the Akt/FoxO3a pathway in TGF-beta1-mediated mesangial cell dysfunction: a novel mechanism related to diabetic kidney disease. J Am Soc Nephrol 2006;17:3325–3335 [DOI] [PubMed] [Google Scholar]
- 9.Zhou L, Fu P, Huang XR, Liu F, Lai KN, Lan HY. Activation of p53 promotes renal injury in acute aristolochic acid nephropathy. J Am Soc Nephrol 2010;21:31–41 [DOI] [PMC free article] [PubMed] [Google Scholar]
- 10.Bhatt K, Zhou L, Mi QS, Huang S, She JX, Dong Z. MicroRNA-34a is induced via p53 during cisplatin nephrotoxicity and contributes to cell survival. Mol Med 2010;16:409–416 [DOI] [PMC free article] [PubMed] [Google Scholar]
- 11.Yang L, Besschetnova TY, Brooks CR, Shah JV, Bonventre JV. Epithelial cell cycle arrest in G2/M mediates kidney fibrosis after injury. Nat Med 2010;16:535–543 [DOI] [PMC free article] [PubMed]
- 12.Samarakoon R, Overstreet JM, Higgins SP, Higgins PJ. TGF-β1 → SMAD/p53/USF2 → PAI-1 transcriptional axis in ureteral obstruction-induced renal fibrosis. Cell Tissue Res 2012;347:117–128 [DOI] [PMC free article] [PubMed] [Google Scholar]
- 13.Molitoris BA, Dagher PC, Sandoval RM, et al. siRNA targeted to p53 attenuates ischemic and cisplatin-induced acute kidney injury. J Am Soc Nephrol 2009;20:1754–1764 [DOI] [PMC free article] [PubMed] [Google Scholar]
- 14.Niranjan T, Bielesz B, Gruenwald A, et al. The Notch pathway in podocytes plays a role in the development of glomerular disease. Nat Med 2008;14:290–298 [DOI] [PubMed] [Google Scholar]
- 15.Jung DS, Lee SH, Kwak SJ, et al. Apoptosis occurs differentially according to glomerular size in diabetic kidney disease. Nephrol Dial Transplant 2012;27:259–266 [DOI] [PubMed]
- 16.Tikoo K, Singh K, Kabra D, Sharma V, Gaikwad A. Change in histone H3 phosphorylation, MAP kinase p38, SIR 2 and p53 expression by resveratrol in preventing streptozotocin induced type I diabetic nephropathy. Free Radic Res 2008;42:397–404 [DOI] [PubMed] [Google Scholar]
- 17.Suzuki HI, Miyazono K. Dynamics of microRNA biogenesis: crosstalk between p53 network and microRNA processing pathway. J Mol Med (Berl) 2010;88:1085–1094 [DOI] [PubMed] [Google Scholar]
- 18.Kim T, Veronese A, Pichiorri F, et al. p53 regulates epithelial-mesenchymal transition through microRNAs targeting ZEB1 and ZEB2. J Exp Med 2011;208:875–883 [DOI] [PMC free article] [PubMed] [Google Scholar]
- 19.Hermeking H. MicroRNAs in the p53 network: micromanagement of tumour suppression. Nat Rev Cancer 2012;12:613–626 [DOI] [PubMed] [Google Scholar]
- 20.Pichiorri F, Suh SS, Rocci A, et al. Downregulation of p53-inducible microRNAs 192, 194, and 215 impairs the p53/MDM2 autoregulatory loop in multiple myeloma development. Cancer Cell 2010;18:367–381 [DOI] [PMC free article] [PubMed] [Google Scholar] [Retracted]
- 21.Bartel DP. MicroRNAs: target recognition and regulatory functions. Cell 2009;136:215–233 [DOI] [PMC free article] [PubMed] [Google Scholar]
- 22.Mendell JT, Olson EN. MicroRNAs in stress signaling and human disease. Cell 2012;148:1172–1187 [DOI] [PMC free article] [PubMed] [Google Scholar]
- 23.Natarajan R, Putta S, Kato M. MicroRNAs and diabetic complications. J Cardiovasc Transl Res 2012;5:413–422 [DOI] [PMC free article] [PubMed] [Google Scholar]
- 24.Kato M, Arce L, Wang M, Putta S, Lanting L, Natarajan R. A microRNA circuit mediates transforming growth factor-β1 autoregulation in renal glomerular mesangial cells. Kidney Int 2011;80:358–368 [DOI] [PMC free article] [PubMed] [Google Scholar]
- 25.Chung AC, Huang XR, Meng X, Lan HY. miR-192 mediates TGF-beta/Smad3-driven renal fibrosis. J Am Soc Nephrol 2010;21:1317–1325 [DOI] [PMC free article] [PubMed] [Google Scholar]
- 26.Wang Q, Wang Y, Minto AW, et al. MicroRNA-377 is up-regulated and can lead to increased fibronectin production in diabetic nephropathy. FASEB J 2008;22:4126–4135 [DOI] [PMC free article] [PubMed] [Google Scholar]
- 27.Wang XX, Jiang T, Shen Y, et al. Diabetic nephropathy is accelerated by farnesoid X receptor deficiency and inhibited by farnesoid X receptor activation in a type 1 diabetes model. Diabetes 2010;59:2916–2927 [DOI] [PMC free article] [PubMed] [Google Scholar]
- 28.Wang G, Kwan BC, Lai FM, et al. Intrarenal expression of miRNAs in patients with hypertensive nephrosclerosis. Am J Hypertens 2010;23:78–84 [DOI] [PubMed] [Google Scholar]
- 29.Wang G, Kwan BC, Lai FM, et al. Intrarenal expression of microRNAs in patients with IgA nephropathy. Lab Invest 2010;90:98–103 [DOI] [PubMed] [Google Scholar]
- 30.Lorenzen JM, Haller H, Thum T. MicroRNAs as mediators and therapeutic targets in chronic kidney disease. Nat Rev Nephrol 2011;7:286–294 [DOI] [PubMed] [Google Scholar]
- 31.Long J, Wang Y, Wang W, Chang BH, Danesh FR. MicroRNA-29c is a signature microRNA under high glucose conditions that targets Sprouty homolog 1, and its in vivo knockdown prevents progression of diabetic nephropathy. J Biol Chem 2011;286:11837–11848 [DOI] [PMC free article] [PubMed] [Google Scholar]
- 32.Kato M, Putta S, Wang M, et al. TGF-beta activates Akt kinase through a microRNA-dependent amplifying circuit targeting PTEN. Nat Cell Biol 2009;11:881–889 [DOI] [PMC free article] [PubMed] [Google Scholar]
- 33.Putta S, Lanting L, Sun G, Lawson G, Kato M, Natarajan R. Inhibiting microRNA-192 ameliorates renal fibrosis in diabetic nephropathy. J Am Soc Nephrol 2012;23:458–469 [DOI] [PMC free article] [PubMed] [Google Scholar]
- 34.Sun L, Zhang D, Liu F, et al. Low-dose paclitaxel ameliorates fibrosis in the remnant kidney model by down-regulating miR-192. J Pathol 2011;225:364–377 [DOI] [PMC free article] [PubMed] [Google Scholar]
- 35.Roy B, Beamon J, Balint E, Reisman D. Transactivation of the human p53 tumor suppressor gene by c-Myc/Max contributes to elevated mutant p53 expression in some tumors. Mol Cell Biol 1994;14:7805–7815 [DOI] [PMC free article] [PubMed] [Google Scholar]
- 36.Weil EJ, Lemley KV, Yee B, et al. Podocyte detachment in type 2 diabetic nephropathy. Am J Nephrol 2011;33(Suppl. 1):21–24 [DOI] [PMC free article] [PubMed] [Google Scholar]
- 37.Weil EJ, Fufaa G, Jones LI, et al. Effect of losartan on prevention and progression of early diabetic nephropathy in American Indians with type 2 diabetes. Diabetes 2013;62:3224–3231 [DOI] [PMC free article] [PubMed] [Google Scholar]
- 38.Cohen CD, Frach K, Schlöndorff D, Kretzler M. Quantitative gene expression analysis in renal biopsies: a novel protocol for a high-throughput multicenter application. Kidney Int 2002;61:133–140 [DOI] [PubMed] [Google Scholar]
- 39.Lindenmeyer MT, Eichinger F, Sen K, et al. Systematic analysis of a novel human renal glomerulus-enriched gene expression dataset. PLoS ONE 2010;5:e11545. [DOI] [PMC free article] [PubMed] [Google Scholar]
- 40.Hodgin JB, Nair V, Zhang H, et al. Identification of cross-species shared transcriptional networks of diabetic nephropathy in human and mouse glomeruli. Diabetes 2013;62:299–308 [DOI] [PMC free article] [PubMed] [Google Scholar]
- 41.Cohen CD, Lindenmeyer MT, Eichinger F, et al. Improved elucidation of biological processes linked to diabetic nephropathy by single probe-based microarray data analysis. PLoS One 2008;3:e2937. [DOI] [PMC free article] [PubMed] [Google Scholar]
- 42.Pavkov ME, Knowler WC, Hanson RL, Nelson RG. Diabetic nephropathy in American Indians, with a special emphasis on the Pima Indians. Curr Diab Rep 2008;8:486–493 [DOI] [PMC free article] [PubMed] [Google Scholar]
- 43.Bueno MJ, Malumbres M. MicroRNAs and the cell cycle. Biochim Biophys Acta 2011;1812:592–601 [DOI] [PubMed]
- 44.Kato MV, Sato H, Nagayoshi M, Ikawa Y. Upregulation of the elongation factor-1alpha gene by p53 in association with death of an erythroleukemic cell line. Blood 1997;90:1373–1378 [PubMed] [Google Scholar]
- 45.El Mesallamy HO, Ahmed HH, Bassyouni AA, Ahmed AS. Clinical significance of inflammatory and fibrogenic cytokines in diabetic nephropathy. Clin Biochem 2012;45:646–650 [DOI] [PubMed] [Google Scholar]
- 46.Krupa A, Jenkins R, Luo DD, Lewis A, Phillips A, Fraser D. Loss of MicroRNA-192 promotes fibrogenesis in diabetic nephropathy. J Am Soc Nephrol 2010;21:438–447 [DOI] [PMC free article] [PubMed] [Google Scholar]
- 47.Kasinath BS, Feliers D. The complex world of kidney microRNAs. Kidney Int 2011;80:334–337 [DOI] [PubMed] [Google Scholar]
- 48.Jenkins RH, Martin J, Phillips AO, Bowen T, Fraser DJ. Transforming growth factor β1 represses proximal tubular cell microRNA-192 expression through decreased hepatocyte nuclear factor DNA binding. Biochem J 2012;443:407–416 [DOI] [PubMed] [Google Scholar]
- 49.Wang B, Herman-Edelstein M, Koh P, et al. E-cadherin expression is regulated by miR-192/215 by a mechanism that is independent of the profibrotic effects of transforming growth factor-beta. Diabetes 2010;59:1794–1802 [DOI] [PMC free article] [PubMed] [Google Scholar]


