

Abstract
Cachexia, defined as an involuntary weight loss ≥5%, is a serious and dose-limiting side effect of chemotherapy that decreases survival in cancer patients. Alterations in lipid metabolism are thought to cause the lipodystrophy commonly associated with cachexia. Ghrelin has been proposed to ameliorate the alterations in lipid metabolism due to its orexigenic and anabolic properties. However, the mechanisms of action through which ghrelin could potentially ameliorate chemotherapy-associated cachexia have not been elucidated. The objectives of this study were to identify mechanisms by which the chemotherapeutic agent cisplatin alters lipid metabolism and to establish the role of ghrelin in reversing cachexia. Cisplatin-induced weight and fat loss were prevented by ghrelin. Cisplatin increased markers of lipolysis in white adipose tissue (WAT) and of β-oxidation in liver and WAT and suppressed lipogenesis in liver, WAT, and muscle. Ghrelin prevented the imbalance between lipolysis, β-oxidation, and lipogenesis in WAT and muscle. Pair-feeding experiments demonstrated that the effects of cisplatin and ghrelin on lipogenesis, but not on lipolysis and β-oxidation, were due to a reduction in food intake. Thus, ghrelin prevents cisplatin-induced weight and fat loss by restoring adipose tissue functionality. An increase in caloric intake further enhances the anabolic effects of ghrelin.
Every year more than 1.5 million individuals in the United States are diagnosed with cancer. Abnormalities in energy metabolism are almost universal in this population and often lead to cachexia (an involuntary decrease in weight due to fat and muscle loss). Cachexia occurs in up to 80% of patients at the later stages of the disease and is often associated with decreased response to therapy, quality of life (QOL), and survival (1, 2).
Lipid metabolism plays a critical role in energy homeostasis and body weight regulation. Increased lipolysis contributes to weight loss during cancer-associated cachexia (3, 4). Conversely, inhibition of lipolysis protects mice from cancer-associated weight loss and muscle wasting (5). Also, decreased de novo lipogenesis has been proposed as an etiologic factor contributing to weight loss associated with cancer cachexia (4, 6). These abnormalities in lipid metabolism are often caused by the cancer itself, but paradoxically, many cytotoxic agents used in the treatment of cancer including cisplatin also lead to weight loss despite their anticancer effects.
Cisplatin is part of the standard of care for the treatment of cancers such as lung, head and neck, ovary, testicular, and bladder cancer (7). Cachexia is a dose-limiting side effect of cisplatin therapy, having a negative impact on QOL and the patients' return to productivity. Ameliorating cachexia in this setting would allow the use of higher, more effective doses of cisplatin that would likely increase the chance of cure, remission, and disease-free survival. However, the metabolic effects of cisplatin and the role of lipid metabolism in chemotherapy-induced cachexia are not well understood.
The hormone ghrelin is produced by the stomach and is believed to cause weight gain by increasing food intake and by food intake-independent mechanisms (8–10). Although ghrelin and ghrelin receptor (GHSR1a) agonists have been proposed for the treatment of cancer cachexia and anorexia previously (11–14), the molecular mechanisms through which ghrelin might ameliorate cachexia are not fully understood. Most animal models of cachexia developed to date have focused on the effects of different tumors on the host. However, the extent to which cytotoxic agents contribute to the abnormalities in energy metabolism has not been defined. The objectives of this study were to characterize the mechanisms by which cisplatin affects lipid metabolism in liver, white adipose tissue (WAT), and muscle and to establish the potential beneficial anabolic effects of ghrelin in this setting.
Materials and Methods
Experimental protocol
Adult C57Bl/6J male mice were used in all experiments. Animals were randomized to receive vehicle (saline), cisplatin, ghrelin+cisplatin, and ghrelin. Clinical-grade cisplatin was purchased from APP Pharmaceuticals (Schaumburg, Illinois). Rodent ghrelin was synthesized at Baylor College of Medicine, Department of Immunology and its purity confirmed by HPLC/mass spectrometry. The dose of cisplatin was 2.5 mg/kg given daily ip at 8:30 am, and ghrelin was injected ip (0.8 mg/kg) twice daily at 8 am and 5 pm. The morning dose of ghrelin was given 30 minutes before cisplatin. Cisplatin was administered on days 1–5, and days 26–30.This regimen was selected based on published work showing it was compatible with complete survival and not overt toxicity (15, 16), and after our own studies with ghrelin and cisplatin aimed at inducing a significant degree of weight loss without overt toxicity. The total cumulative dose of cisplatin (25 mg/kg) compared with the human clinical dose in mg/m2, was calculated using a factor of 3.3, which is the ratio of weight to surface area for an adult mouse (17), and is equal to a total human equivalent dose of 82.5 mg/m2, which is in the therapeutic range for cisplatin use in humans. Ghrelin was administered from days 1–18 and days 26–43. Ghrelin treatment was continued after the last dose of cisplatin had ended because the mice still had lower body weight than controls. This is also how GHSR1a agonists currently under development are being tested in human studies. Also, a clinical trial recently reported that ghrelin prevented cisplatin-induced anorexia, and in this study ghrelin was continued for 6 days after infusion of cisplatin ended (18).
Animals were individually housed, acclimated to their cages and human handling for 5 days before the experiments were initiated, and maintained on a 12-hour light-dark cycle (lights on at 6am). Food and water were given ad libitum except for pair-feeding experiments in which animals receiving vehicle, ghrelin, or cisplatin+ghrelin were pair-fed to a group of animals receiving cisplatin. All experiments were conducted with the approval of the Institutional Animal Care and Use Committee and were in compliance with the NIH Guidelines for Use and Care of Laboratory Animals.
Body weight and food consumption were assessed daily by weighing the food and the animals before the am injection. Body weight changes were expressed as percentage change from baseline, and food consumption was expressed cumulatively as grams consumed. A group of animals fed ad libitum (treated with vehicle, cisplatin, ghrelin, or cisplatin+ghrelin) and another group pair fed to cisplatin-treated animals (treated with vehicle, ghrelin, or cisplatin+ghrelin) were humanely destroyed on day 4, 24 hours after the last injection of cisplatin and 12 hours after the last ghrelin injection (when cisplatin-treated animals were actively losing weight). A third group of animals fed ad libitum (treated with vehicle, cisplatin, ghrelin, or cisplatin+ghrelin) were killed on day 44, 12 hours after the last ghrelin injection (after body weight was stable). All animals were killed in the morning.
Fat and lean body mass were measured by nuclear magnetic resonance (NMR) as previously described with a minispec mq NMR spectrometer (Bruker Optics, The Woodlands, Texas) (19) at baseline, and on days 4, 6, and 44. The fat represents total fat, independent of where it is localized. The intensities of the fat, muscle, and free fluid were calculated automatically from the time domain [1H] NMR signals by the instrument software and are expressed in grams.
RNA analysis (real-time PCR)
Total RNA was isolated from 40–60 mg white adipose and liver tissues using the RNase Mini Kit (Qiagen, Germantown, Maryland) and from 40–60 mg of muscle tissue using the guanidinium method (Trizol; Invitrogen, Carlsbad, Californa). Transcript levels were measured by real-time PCR (7000 Sequence Detection System; Applied Biosystems). Total RNA (500 ng) was reverse transcribed (QuantiTect Reverse Transcription Kit, Qiagen) to cDNA. Primers and probes for real-time PCR amplification used were selected using Primer Express Software (Applied Biosystems; Foster City, California; see Supplemental Table 1 published on The Endocrine Society's Journals Online web site at http://endo.endojournals.org). The probe for target genes was labeled at the 5′-end with a reported dye (6′-carboxyfluorescein) and at the 3′-end with a quencher dye TAMRA (6′-carboxytetramethylrhodamine). The reporter and quencher dyes are in close proximity on the probe, resulting in suppression of reporter fluorescence. The probe-exon is designed to hybridize to a specific sequence within the PCR product. The 5′- to 3′-cleave activity of the Taq DNA polymerase allows for separation of the reporter from the close proximity of the quencher dye, resulting in fluorescence of the reporter dye. The resulting signal is measured at each amplification cycle on the ABI Sequence Detection System (Applied Biosystems), thus allowing the measurement of sample abundance in the linear phase of amplification. Target genes were amplified using aliquots of the same cDNA sample, and final quantitation of each sample was achieved by a coamplified relative standard curve.
Western blot analyses
WAT was homogenized in 20 mM 3[N-morpholino]propanesulfonic acid, 2 mM EGTA, 5 mM EDTA, 30 mM sodium fluoride, 40 mM β-glycerophosphate, 10 mM sodium pyrophosphate, 2 mM sodium orthovanadate, 0.5% Nonidet P-40, and complete protease inhibitor cocktail (Roche, Nutley, New Jersey) and centrifuged at 13 000 × g for 20 minutes at −3°C. The supernatant was collected while carefully avoiding the lipid layer on top. Protein from liver was isolated using Tissue Lysis/extration Reagent (Sigma-Aldrich, St. Louis, Missouri) with protease inhibitor and phosphorylation protease inhibitor cocktail (Roche). Protein concentration was measured with a BCA protein quantification kit (Thermo Scientific, Waltham, Massachusetts). We separated protein extracts on 4%–12% NuPAGE gels (Invitrogen) and blotted them onto Immobilon FL polyvinylidene difluoride (Millipore, Billerica, Massachusetts). Membranes were blocked at room temperature for 1 hour in Odyssey LI-COR Blocking Buffer (LI-COR, Lincoln, Nebraska) 1:1 diluted in Tris-buffered saline (TBS) and incubated in primary antibodies in 1:1 Blocking Buffer/TBS-Tween 20 (TBS-T) overnight at 4°C. Primary antibodies against phospho-hormone-sensitive lipase (HSL) (Ser563 and Ser 660), glyceraldehydes 3-phosphate dehydrogenase (Cell Signaling Technology, Beverly Massachusetts), sirtuin 1 (SIRT1), peroxisome proliferator activated receptor γ-2 (PPARγ) coactivator-1α (PGC-1α), fatty acid synthase (FAS), aP2, carnitine palmitoyl transferase-1α (CPT-1α) (Sigma Aldrich), and β-actin (Abcam, Cambridge, Massachusetts) were used. After 3 consecutive 5-minute washes in TBS-T (0.1%), we incubated blots with Dylight 680-conjugated goat antirabbit IgG and Dylight 800-conjugated goat antimouse IgG (both Thermo Scientific, Waltham, Massachusetts) for 1 hour at room temperature in blocking buffer containing 0.1% TBS-T and 0.1% SDS. After 3 washes in TBS-T and a final wash in TBS, we scanned the blots with the LI-COR Odyssey (LI-COR) and quantified them with Odyssey 3.0 software on the basis of direct fluorescence measurement.
Statistical analysis
SPSS 12.00 software for Windows (SPSS, Inc Chicago, Illinois) was used for all statistical analyses. Parameters are expressed as mean ± SEM. Statistical comparisons for categorical data were performed using ANOVA. P values of .05 or smaller were considered statistically significant.
See supplemental materials for more details.
Results
Ghrelin prevents cisplatin-induced changes in body weight, body composition, and food intake
To analyze the effects of ghrelin and cisplatin on body weight and body composition, animals were treated with vehicle (V), ghrelin (G), cisplatin, (C) or ghrelin+cisplatin (GC). Administration of cisplatin reduced body weight, fat, and lean body mass, which were significantly attenuated by coadministration of ghrelin (Figure 1, A–C). Cisplatin also reduced adipocyte diameter at days 4 and 44, and this decrease in adipocyte size was partially prevented by ghrelin (Figure 1D). Ghrelin administration in the absence of cisplatin caused a nonsignificant increase in body weight compared with vehicle. Lean body mass was increased by ghrelin without affecting fat mass, whereas adipocyte diameter increased compared with vehicle.
Figure 1.
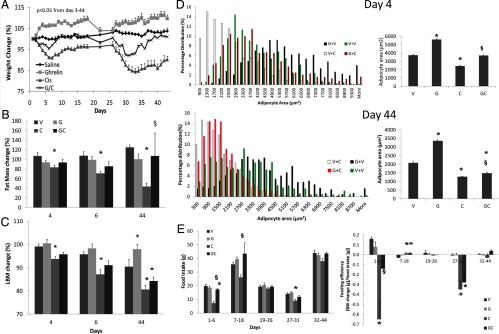
Body Weight, Body Composition, Food Intake, and Feeding Efficiency in Animals Fed ad Libitum. Body weight (A), fat mass measured by NMR (B), lean body mass measured by NMR (C), adipocyte diameter (D), and food intake and feeding efficiency (E). V, vehicle; G, ghrelin; C, cisplatin; GC, ghrelin+cisplatin (n = 8/group). Cisplatin was given on days 1 through 5 and days 26 through 30. Ghrelin was administered from days 1 through 18 and 26 through 43. *, P < .05 compared with vehicle-treated animals. §, P < .05 for cisplatin-treated animals vs ghrelin+cisplatin. ANOVA P < .05 from day 3 through day 44 on Figure 1A for V vs C only.
To establish the contribution of caloric intake on the weight/mass changes induced by cisplatin and ghrelin, we monitored daily food intake and calculated feed efficiency during (days 1–6 and 27–31) and after cisplatin administration when animals were still receiving ghrelin (days 7–18 and days 32–44), and between cycles (days 19–26) in ad libitum fed animals. Cisplatin significantly decreased food intake and feed efficiency compared with vehicle whereas coadministration of ghrelin partially prevented these changes (Figure 1E). Ghrelin alone did not induce a significant increase in food intake compared with vehicle. To further characterize the role of food intake changes induced by cisplatin and ghrelin, a group of animals receiving vehicle, ghrelin, and cisplatin+ghrelin were pair fed to animals receiving cisplatin for 4 days. Given that animals receiving cisplatin suffered anorexia, this regimen induced a caloric restriction of approximately 60% compared with vehicle-, ghrelin- or cisplatin+ghrelin-treated animals (Figure 1E) and, as expected, all groups lost weight as a result of reduced caloric intake. However, the cisplatin group lost more weight, which was partially ameliorated by ghrelin coadministration (vehicle, −10 ± 0.7%; ghrelin, −8 ± 1.8%; cisplatin, −16 ± 1%; and G+C, −13 ± 0.7% from baseline; P < .05 for vehicle vs cisplatin). A pair-fed experiment was not performed for 44 days because cisplatin did not induce anorexia chronically.
Lipid metabolism in WAT
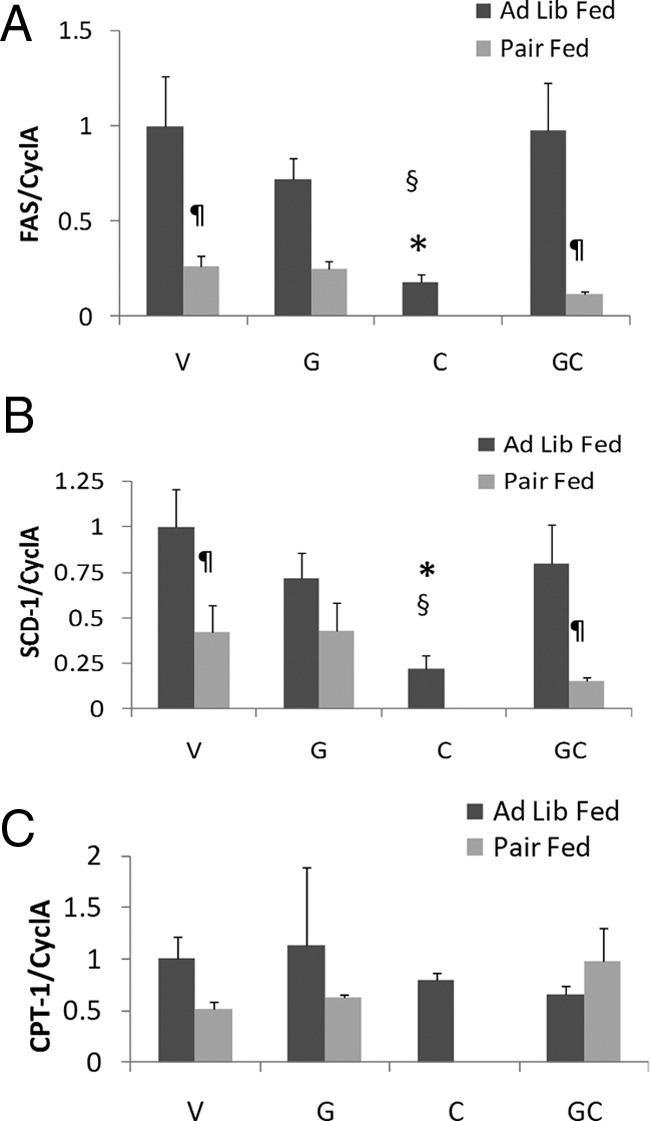
Adipose tissue was collected from animals humanely destroyed on day 4 of treatment to measure markers of lipid metabolism. Expression of mRNA encoding FAS, a key enzyme in de novo lipogenesis, was suppressed by cisplatin treatment, but this suppression did not occur when ghrelin was coadministered. Pair-fed animals were refractory to rescue of cisplatin suppression of FAS by ghrelin (Figure 2A). These findings were also confirmed at the protein level (Figure 3A). Stearoyl coenzyme A desaturase-1 (SCD-1) mRNA, encoding the enzyme that catalyzes the rate-limiting step in the biosynthesis of polyunsaturated fatty acids, was also suppressed by cisplatin administration. This decrease was prevented by coadministration of ghrelin, but ghrelin was ineffective in pair-fed animals. Lipoprotein lipase (LPL), the key enzyme for very low density lipoprotein hydrolysis and fatty acid uptake followed the same trend as SCD-1 and FAS, although the differences did not reach statistical significance (Figure 2, B and C). mRNA and protein levels of carnitine palmitoyl transferase-1α (CPT-1α), the key regulatory enzyme for fatty acid β-oxidation, were significantly increased by cisplatin administration, and this increase was prevented by ghrelin treatment. In pair-fed mice, ghrelin treatment increased CPT-1α protein levels in WAT (Figures 2D and 3A).
Figure 2.

Lipid Metabolism Gene Expression in WAT. Day 4 FAS (A), SCD-1 (B), LPL (C), CPT 1α (D), aP2 (E), PPAR γ2 (F), SIRT 1 (G), and PGC 1α (H) mRNA levels. V, vehicle; G, ghrelin; C, cisplatin; GC, ghrelin+cisplatin (n = 4–6/group). *, P < .05 compared with vehicle-treated animals. §, P < .05 for cisplatin-treated animals vs ghrelin+cisplatin. ¶, P < .05 for ad libitum fed vs pair-fed animals.
Figure 3.

A, Protein expression of SIRT 1, PGC 1 α, FAS, and aP2 in fat. *, P < .05 compared with vehicle-treated animals. §, P < .05 for cisplatin-treated animals vs ghrelin+cisplatin. ¶, P < .05 for ad libitum fed vs pair-fed animals. B, Protein expression of Ser563 and Ser 660 HSL. *, P < .05 compared with vehicle-treated animals. §, P < .05 for cisplatin-treated animals vs ghrelin+cisplatin. ¶, P < .05 for ad libitum fed vs pair-fed animals. PF, pair fed.
The molecular chaperone, fatty acid binding protein-4 (aP2), facilitates lipolysis and movement of fatty acids out of adipocytes by interacting with HSL and decreasing de novo lipogenesis (20). aP2 mRNA levels were increased by cisplatin treatment compared with ad libitum-fed vehicle-treated animals. Ghrelin administration did not affect aP2 mRNA levels, but pair feeding increased aP2 in vehicle and ghrelin-treated animals, suggesting that more free fatty acids (FFAs) were mobilized (Figure 2E). Nevertheless, the increase in aP2 protein levels by cisplatin treatment, which was prevented by ghrelin appear to be at least partially independent of changes in food intake because pair feeding only marginally increased aP2 levels (Figure 3A).
mRNA expression levels of transcription factors PPARγ2, SIRT1, and its target PGC-1α that mediate the adaptive response to caloric restriction by inducing lipolysis and preventing triglyceride accumulation in WAT (21) were not different between groups (Figure 2, F–H). However, Western blot analyses showed that both SIRT-1 and PGC-1α were significantly increased by cisplatin, but this was prevented by ghrelin coadministration (Figure 3A).
We monitored the effects of cisplatin and ghrelin on day 44 because cisplatin-treated animals remained significantly underweight compared with vehicle-treated animals even though body weights were stable and food intake comparable between groups. On day 44 (2 weeks after cisplatin administration was completed and once body weight was stable), the levels of FAS, SCD-1, LPL, CPT-1α, aP2, PPARγ, PGC-1α, or SIRT-1 mRNAs were not significantly different between groups (Supplemental Table 2).
Lipolysis is known to be altered in animals with tumor-induced cachexia (4). The key lipolytic enzyme HSL is activated through phosphorylation at Ser563 and Ser660 by either protein kinase A or the MAPKs p42 and p44 (22–24). To determine whether HSL is posttranslationally regulated by cisplatin and ghrelin, we measured levels of phosphorylated Ser563 HSL and Ser660 HSL (using phosphor-specific antibodies) in all groups of animals. We observed increased levels of phosphorylated HSL in cisplatin treated animals on day 4, and these changes were prevented by ghrelin coadministration (Figure 3B). Although pair feeding also caused an increase in HSL, these changes were much smaller than those induced by cisplatin administration, showing that increase in HSL phosphorylation is partially independent of changes in food intake. No changes were evident on day 44 (data not shown). Because HSL phosphorylation is a good indicator of sympathetic drive to WAT (22, 25), these observations indicate that cisplatin induces a sympathetic outflow to WAT whereas ghrelin exerts sympatholytic effects.
Lipid metabolism in the liver
Cisplatin-treated animals exhibited lower liver weights compared with vehicle-treated mice on days 4 and 44, whereas in mice treated with both cisplatin and ghrelin this was only observed on day 4. Pair feeding eliminated this difference. Cisplatin induced a decrease in hepatic fat content on days 4 and 44 although it only reached significance for day 4 when measured by NMR. Ghrelin coadministration did not prevent liver fat loss (Figure 4, A–C).
Figure 4.

Liver mass and composition and hepatic lipid gene expression. Liver mass on days 4 (A) and 44 (B), liver composition by NMR (C), FAS (D), SCD-1 (E), LPL (F), CPT-1α (G), SIRT 1 (H); PGC 1 α (I). Protein expression of SIRT 1, PGC 1 α, FAS, and CPT-1α in liver. *, P < .05 compared with vehicle-treated animals. §, P < .05 for cisplatin-treated animals vs ghrelin+cisplatin. ¶, P < .05 for ad libitum fed vs pair-fed animals (J). V, vehicle; G, ghrelin; C, cisplatin; GC, ghrelin+cisplatin (n = 4–6/group). *, P < .05 compared with vehicle-treated animals. §, P < .05 for cisplatin-treated animals vs ghrelin+cisplatin. ¶, P < .05 for ad libitum fed vs pair-fed animals.
On day 4, hepatic FAS and SCD-1 mRNA levels were attenuated by cisplatin, which was not prevented by coadministration of ghrelin. However, the cisplatin-induced decrease in FAS protein was partially prevented by ghrelin (Figure 4J). All pair-fed groups also showed reduced expression of these 2 enzymes. LPL mRNA levels followed similar trends, although the differences did not reach statistical significance (Figure 4, D–F). These data indicate that reversal of cisplatin-induced anorexia by ghrelin could prevent the decrease in de novo lipogenesis.
CPT-1α mRNA and protein concentrations were increased by cisplatin and prevented by ghrelin coadministration. When animals were pair fed, the differences between groups were not significant because pair feeding also increased CPT-1α (Figure 4, G and J). Taken together, these data suggest that cisplatin increases fatty acid oxidation in liver and WAT and that coadministration of ghrelin prevents these cisplatin-induced increases. The mRNA and protein levels of SIRT1 and PGC1-α were unaffected by cisplatin or ghrelin administration except for SIRT1 levels in pair-fed animals receiving ghrelin alone (Figure 4, H–J). On day 44, there were no significant differences in mRNA levels of FAS, SCD-1, SIRT1, or PGC-1α between groups (Supplemental Table 2).
FFA and triglyceride levels
On day 4, circulating triglycerides and FFA levels were significantly decreased in cisplatin-treated animals compared with vehicle-treated animals. Pair feeding did not significantly affect triglyceride levels, but it increased FFA in vehicle-treated animals (Figure 5, A and B). Liver triglycerides were not significantly lower in cisplatin-treated animals (Figure 5C). As expected, liver triglyceride concentrations were reduced by the caloric restriction caused by pair feeding. On day 44, there were no significant differences in circulating FFA, triglyceride, or liver triglyceride between groups (Figure 5, D–F).
Figure 5.

Circulating triglyceride and FFA and liver triglyceride levels. Day 4 circulating triglyceride levels (A), FFA levels (B), and liver triglyceride levels (C). Day 44 circulating triglyceride levels (D), FFA (E), and liver triglyceride levels (F). V, vehicle; G, ghrelin; C, cisplatin; GC, ghrelin+cisplatin (n = 4–6/group). *, P < .05 compared with vehicle-treated animals. §, P < .05 for cisplatin-treated animals vs ghrelin+cisplatin. ¶, P < .05 for ad libitum fed vs pair-fed animals.
Lipid metabolism in muscle
Similar to WAT, FAS and SCD-1 mRNA levels in gastrocnemius muscle decreased with cisplatin, and the decrease was prevented by ghrelin coadministration. Pair feeding eliminated all differences between groups because it also suppressed the expression of these lipogenic enzymes (Figure 6, A and B). This suggests that ghrelin restores lipogenesis in muscle by preventing anorexia. This is of significance because FFAs are not only an important source of energy in muscle but can also improve insulin action (26). Neither cisplatin nor ghrelin affected levels of CPT-1α (Figure 6C) SIRT1, and PGC-1 α mRNAs when compared with vehicle (data not shown). On day 44, there were no significant differences between groups on mRNA levels of FAS, SCD-1, LPL, CPT-1, PGC-1, or SIRT-1 despite the significant decrease in lean body mass induced by cisplatin on day 44 (Supplemental Table 2).
Figure 6.
Lipid metabolism gene expression in muscle. FAS (A), SCD-1 (B), and CPT-1α (C). V, vehicle; G, ghrelin; C, cisplatin; GC, ghrelin+cisplatin (n = 4–6/group). *, P < .05 compared with vehicle-treated animals. §, P < .05 for cisplatin-treated animals vs ghrelin+cisplatin. ¶, P < .05 for ad libitum fed vs pair-fed animals. PF, pair fed.
GHSR-1a expression in target tissues, plasma ghrelin, and serum IGF-1 levels
To determine whether the effects of ghrelin were locally mediated through its cognate receptor GHSR-1a in liver, fat, and gastrocnemius muscle, we measured mRNA expression of GHSR-1a in these tissues. As positive and negative controls we used the hypothalami of GHSR-1a wild-type and knockout animals, respectively. GHSR-1a mRNA was present in hypothalami, but not in liver, muscle, or fat of GHSR-1a wild-type experimental animals, or in the hypothalami of GHSR-1a knockout animals (data not shown). Ghrelin and desacyl ghrelin concentrations were measured in ad libitum fed mice on day 4. Ghrelin levels were increased following ghrelin administration, but surprisingly, desacyl ghrelin levels were only elevated by cisplatin (Supplemental Figure 1). Circulating IGF-1 levels were also not affected by ghrelin or cisplatin at day 4 in ad libitum-fed animals (Supplemental Figure 2). Samples were not available for measurements in the pair-fed or the day 44 groups.
Discussion
Cachexia, defined as an involuntary loss of muscle and fat mass, is a common and often dose-limiting side effect of chemotherapy that severely affects QOL in cancer patients. Cisplatin is a commonly used and effective treatment for many cancers; however, its use is limited by side effects that include development of anorexia and cachexia. Despite the clinical relevance of this problem, mechanisms mediating muscle and fat loss in this setting are not well characterized. There are currently no Food and Drug Administration-approved treatments for cachexia; therefore, a better understanding of cachexia could lead to development of desperately needed new therapies. Ghrelin ameliorates anorexia and cachexia in several preclinical models and is postulated to ameliorate the acute effects of cisplatin on food intake (27–29). More recently, a pilot clinical trial indicated that exogenous ghrelin administration improved food intake, QOL, nausea/vomiting, and anorexia in patients with esophageal cancer receiving cisplatin-based neo-adjuvant chemotherapy (30). However, its role in regulating fat metabolism in this context has not been well established.
The first aim of this study was to characterize the effects of the commonly used chemotherapeutic agent cisplatin on lipid metabolism in 3 main target peripheral organs: adipose tissue, liver. and muscle. Our data indicate that de novo lipogenesis was acutely decreased by cisplatin in all target organs. This attenuation is likely driven mainly by cisplatin-induced suppression of food intake, because animals receiving vehicle, ghrelin, or cisplatin and ghrelin in combination, exhibited similar decreases in expression of lipogenic markers when pair fed. SCD-1 is the rate-limiting enzyme catalyzing the synthesis of monounsaturated fatty acids from saturated fatty acids. A decrease in SCD-1 activity is associated with an increase in fatty acid oxidation and a decrease in lipid synthesis primarily in the liver (31). This effect is probably mediated through increased activation of AMP-activated protein kinase leading to the inactivation of acetyl-coA carboxylase (ACC) and a subsequent decrease in malonyl coenzyme A (CoA) levels that, in turn, allows for an increase in CPT-1α and β-oxidation. Hence, we postulated that CPT-1α would be increased by cisplatin; indeed, this was confirmed in adipose tissue and liver although not in muscle. Pair-fed animals showed an increase in CPT-1α in liver and fat, but not in muscle where CPT-1α mRNA levels decreased. Taken together, these data suggest that β-oxidation in WAT and liver is increased by cisplatin, which is regulated by changes in food intake and possibly by other factors in a tissue-specific manner.
Levels of SIRT-1 and PGC-1α proteins were significantly increased in WAT by cisplatin, but prevented by ghrelin coadministration. Although protein levels increased, mRNA concentrations were unaffected, suggesting posttranscriptional regulation. Caloric restriction has also been shown to increase SIRT-1 and PCC-1α (21); however, pair feeding increased PGC1α but not SIRT-1 in our study. Several factors could explain this lack of response including the fact that animals were not fasted before being humanely destroyed and that the degree of caloric restriction imposed by our pair-feeding design may not severe enough to mount a significant response. Future studies would be needed to establish the significance of these findings.
Several reports explored the effects of ghrelin on lipid metabolism under conditions that did not affect food intake. For instance, ghrelin administered centrally induced expression of lipogenic enzyme mRNAs and suppressed CPT-1α in WAT. In the liver, expression of SCD-1 mRNA increased, but ACC, FAS, and CPT-1α mRNAs were unchanged (32). In another report a low dose of ghrelin administered peripherally produced an increase in FAS and decrease in CPT-1α mRNAs expression in the liver. In gastrocnemius muscle, CPT-1α and ACC mRNAs were unaffected by ghrelin treatment (33). In our experimental model, ghrelin alone had no significant effect on food intake when compared with vehicle, but ghrelin coadministration with cisplatin prevented cisplatin-induced anorexia. This is not surprising given that cancer cachexia is associated with an increase in GHSR1a mRNA expression in the hypothalamus (34). Moreover, ghrelin also partially prevented weight loss induced by cisplatin even when animals were pair fed to cisplatin-treated animals, suggesting that food intake is only partially responsible for the beneficial effects of ghrelin.
Our experiments show that ghrelin alone, as used in this regimen, had no discernible effect on fat mass or fat metabolism either acutely (day 4), or chronically (day 44). Some (8, 32), but not all (35), previous studies report an increase in adiposity or lipogenesis following ghrelin administration. These discrepancies are likely related to: differences in age, strain/species of the animals; fat pad used for analyses; ghrelin dose and route of administration; duration of ghrelin treatment; and a factor frequently overlooked that has major effects on metabolism in mice, the ambient temperature in the vivarium.
In our study, the findings described as changes in mRNA concentrations were largely confirmed by Western blot. Discrepancies likely reflect posttranscriptional regulation, although a component of sample variability cannot be excluded.
Liver fat was not affected by ghrelin even after 44 days of treatment in this study. Although some reports have shown an increase in liver adiposity with ghrelin treatment (35), others have shown the opposite effect with ghrelin preventing fat accumulation and improving redox state in the liver of high fat-fed animals (36). All effects on the liver are probably indirect because the liver does not express GHSR1a. Indeed, in general, the chronic effects of ghrelin on peripheral tissues are regulated by the brain, inflammatory state, and nutritional status. Additional factors may also account for the differences in results reported by different groups: mouse age and strain, subchronic vs chronic ghrelin treatment, and mouse vivarium temperature.
Ghrelin administered over 44 days also caused an increase in LBM. We hypothesize that this is due to activation of the GH/IGF-1 axis and possibly other anabolic pathways in muscle as recently described by others (37). Although GH is released in response to ghrelin, circulating IGF-1 levels were not affected by ghrelin or cisplatin treatment on day 4. Nevertheless, these results do not completely exclude the possibility that activation of the GH axis plays a role in mediating the effects of ghrelin given that longer exposure than 4 days may be needed to see a significant effect, and that activation of the GH/IGF-1 axis may take place locally at the target organs and suppress myostatin production (38).
WAT plays a critical role in energy homeostasis both as an endocrine and a storage organ of energy-rich triglyceride and can dynamically switch from a fatty acid-storing to a fatty acid-releasing mode according to metabolic needs, and this metabolic flexibility is critical for energy homeostasis. Dysfunction of WAT is characterized by the inability to store lipids or restrain lipolysis in the fed state. WAT is also capable of synthesizing fatty acids during de novo lipogenesis such as palmitoleate that confer systemic insulin-sensitizing properties in mice (39). Dysfunctional WAT is the source of excess FFAs and inflammatory mediators that cause and worsen insulin resistance (40).
Here we provide evidence that cisplatin induces WAT dysfunction by suppressing de novo lipogenesis and inducing lipolysis whereas ghrelin is able to improve WAT functionality and reduces cachexia. Cisplatin treatment also induced a decrease in the expression of lipogenic enzyme mRNA in muscle that was prevented by ghrelin. Lipogenesis in muscle may be important to maintain normal physiologic function given that contractility is highly dependent on its ability to synthesize and use lipids as a source of energy (41).
The increase in lipolysis suggested by elevated levels of phosphor-HSL does not translate into an increase in circulating FFA despite the decrease in liver triglyceride levels. This may be related to the concomitant increase in β-oxidation that we detected in liver and WAT. Interestingly, these acute changes in lipid metabolism (day 4) were not associated with simultaneous changes in fat mass. We hypothesize that these acute molecular changes preceded changes in fat mass as measured by NMR given that fat mass changes on days 4 and 6 eventually became significant on day 44. The fact that the adipocyte diameter is significantly bigger in ghrelin+cisplatin-treated animals compared with cisplatin-treated animals is also consistent with this hypothesis. On the other hand, acute molecular changes induced by cisplatin or ghrelin in WAT, liver, or muscle after 3 days of treatment were not evident on day 44 despite the significant decrease in fat mass. These data suggest that once a plateau in weight/fat loss is reached, restoration of changes in pathways regulating fat metabolism to normal levels is unable to restore fat mass.
Acylated ghrelin levels were increased by ghrelin administration. This is surprising because blood collection took place 12 hours after the last ghrelin ip injection and the half-life of ghrelin in the circulation has been reported to be only 30 minutes (42). Although it is possible that these ghrelin levels represent endogenous ghrelin, alteration in the volume of distribution or in its clearance and metabolism induced by exogenous ghrelin administration at pharmacologic doses may partially account for the increase in circulating ghrelin levels. It is also interesting that cisplatin administration increased desacyl-ghrelin levels, highlighting the importance of measuring both forms of ghrelin when assessing changes in ghrelin levels in catabolic conditions. Although our study was not set up to answer this question, this may indicate impairment in the acylation process of ghrelin. Future studies will be needed to test this hypothesis.
Our observation that coadministration of ghrelin with cisplatin restores body weight has potentially profound clinical importance because it suggests that ghrelin ameliorates cisplatin-induced cachexia. Because the ghrelin receptor GHSR1a is not present in liver, WAT, and muscle, this protective property cannot be explained by the direct actions of ghrelin on these tissues, but is likely regulated centrally or through a different receptor. Whether ghrelin treatment prevents tumor-induced cachexia per se will have to be evaluated through separate studies.
In summary, we have identified several mechanisms responsible for the weight and fat loss induced by cisplatin including: 1) an increase in lipolysis as suggested by the increase in activated HSL protein levels and aP2 levels, 2) an increase in the CPT-1α in liver and WAT, a marker of β-oxidation, and 3) a decrease in the lipogenic enzymes FAS and SCD-1 in liver, adipose tissue, and muscle. Although the effect of cisplatin on lipogenesis appears to be a consequence of reduced food intake, this does not completely explain cisplatin-induced increases in lipolysis and fatty acid β-oxidation. Nevertheless, our results show that appropriate nutrition is necessary to gain the greatest benefit of coadministration of ghrelin with cisplatin. Most importantly, our demonstration that ghrelin coadministration prevents cisplatin-induced irreversible weight loss and fat loss illustrates ghrelin's potential as a therapeutic option for antagonizing this debilitating side effect of chemotherapy.
Acknowledgements
We thank the Vanderbilt Mouse Metabolic Phenotyping Center, Vanderbilt University Medical Center Hormone and Analytical Services Core, University of Virginia, and Baylor Diabetes and Endocrinology Research Center for their help.
This work was supported by the US Department of Veterans Affairs (MERIT grants I01-BX000507 and I01 CX000174, MREP, and a SHCNCDA); the Caroline Wiess Law Fund for Molecular Medicine (to J.M.G.) and NIH Grants AG040583 (to J.M.G.), T32AG000183 (to J.M.G. and B.G.), and DK083658 and DK082724 (to C.B.) C.B. is the recipient of an Irma T. Hirschl Scholar Award. The Vanderbilt MMPC was supported in part by U24 DK59637; Vanderbilt University Medical Center Hormone Assay and Analytical Services Core was supported by NIH Grants DK059637 and DK020593; University of Virginia and Baylor Diabetes and Endocrinology Research Center received grants (DK076037 and P30 DK079638, respectively). A.N. received support from the University of Pittsburgh School of Medicine Dean's Summer Research Program T35 Grant DK 065521.
Current address for T.S.: Division of Endocrinology and Metabolism, Department of Internal Medicine III, Medical University of Vienna, Waehringer Guertel 18–20, 1090, Vienna, Austria.
Current address for R.G.S.: Department of Metabolism and Aging, The Scripps Research Institute Florida, Jupiter, Florida 33458.
Current address for J.-a.C.: Department of Environmental Hygiene, College of Preventive Medicine, Third Military Medical University, Chongqing 400038, China.
Disclosure Summary: J.M.G. receives research support and is a consultant for Aeterna Zentaris, Inc and Helsinn Therapeutics, Inc.
Footnotes
- ACC
- acetyl-coA carboxylase
- aP2
- fatty acid binding protein-4
- CoA
- coenzyme A
- CPT-1α
- carnitine palmitoyl transferase-1α
- FAS
- fatty acid synthase
- FFA
- free fatty acid
- HSL
- hormone-sensitive lipase
- LPL
- lipoprotein lipase
- NMR
- nuclear magnetic resonance
- PGC
- PPARγ coactivator-1α
- PPAR
- peroxisome proliferator activated receptor
- QOL
- quality of life
- SCD-1
- stearoyl coenzyme A desaturase-1
- SIRT1
- sirtuin 1
- TBS
- Tris-buffered saline
- TBS-T
- TBS-Tween 20
- WAT
- white adipose tissue.
References
- 1. Deans C, Wigmore SJ. Systemic inflammation, cachexia and prognosis in patients with cancer. Curr Opin Clin Nutr Metab Care. 2005;8(3):265–269 [DOI] [PubMed] [Google Scholar]
- 2. Maltoni M, Nanni O, Pirovano M, et al. Successful validation of the palliative prognostic score in terminally ill cancer patients. Italian Multicenter Study Group on Palliative Care. J Pain Symptom Manage. 1999;17(4):240–247 [DOI] [PubMed] [Google Scholar]
- 3. Agustsson T, Rydén M, Hoffstedt J, et al. Mechanism of increased lipolysis in cancer cachexia. Cancer Res. 2007;67(11):5531–5537 [DOI] [PubMed] [Google Scholar]
- 4. Rydén M, Agustsson T, Laurencikiene J, et al. Lipolysis–not inflammation, cell death, or lipogenesis–is involved in adipose tissue loss in cancer cachexia. Cancer. 2008;113(7):1695–1704 [DOI] [PubMed] [Google Scholar]
- 5. Das SK, Eder S, Schauer S, et al. Adipose triglyceride lipase contributes to cancer-associated cachexia. Science. 2011;333(6039):233–238 [DOI] [PubMed] [Google Scholar]
- 6. Jeevanandam M, Horowitz GD, Lowry SF, Brennan MF. Cancer cachexia and the rate of whole body lipolysis in man. Metabolism. 1986;35(4):304–310 [DOI] [PubMed] [Google Scholar]
- 7. Verstappen CC, Heimans JJ, Hoekman K, Postma TJ. Neurotoxic complications of chemotherapy in patients with cancer: clinical signs and optimal management. Drugs. 2003;63(15):1549–1563 [DOI] [PubMed] [Google Scholar]
- 8. Tschöp M, Smiley DL, Heiman ML. Ghrelin induces adiposity in rodents. Nature. 2000;407(6806):908–913 [DOI] [PubMed] [Google Scholar]
- 9. Nakazato M, Murakami N, Date Y, et al. A role for ghrelin in the central regulation of feeding. Nature. 2001;409:194–198 [DOI] [PubMed] [Google Scholar]
- 10. Murphy MG, Plunkett LM, Gertz BJ, et al. MK-677, an orally active growth hormone secretagogue reverses diet-induced catabolism. J Clin Endocrinol Metab. 1998;83:320–325 [DOI] [PubMed] [Google Scholar]
- 11. Strassburg S, Anker SD, Castaneda TR, et al. Long-term effects of ghrelin and ghrelin receptor agonists on energy balance in rats. Am J Physiol Endocrinol Metab. 2008;295(1):E78–E84 [DOI] [PMC free article] [PubMed] [Google Scholar]
- 12. Wisse BE, Frayo RS, Schwartz MW, Cummings DE. Reversal of cancer anorexia by blockade of central melanocortin receptors in rats. Endocrinology. 2001;142(8):3292–3301 [DOI] [PubMed] [Google Scholar]
- 13. Nagaya N, Kangawa K. Ghrelin improves left ventricular dysfunction and cardiac cachexia in heart failure. Curr Opin Pharmacol. 2003;3(2):146–151 [DOI] [PubMed] [Google Scholar]
- 14. Garcia JM, Garcia-Touza M, Hijazi RA, et al. Active ghrelin levels and active to total ghrelin ratio in cancer-induced cachexia. J Clin Endocrinol Metab. 2005;90(5):2920–2926 [DOI] [PubMed] [Google Scholar]
- 15. Sawhney P, Giammona CJ, Meistrich ML, Richburg JH. Cisplatin-induced long-term failure of spermatogenesis in adult C57/Bl/6J mice. J Androl. 2005;26(1):136–145 [PubMed] [Google Scholar]
- 16. Seaman F, Sawhney P, Giammona CJ, Richburg JH. Cisplatin-induced pulse of germ cell apoptosis precedes long-term elevated apoptotic rates in C57/BL/6 mouse testis. Apoptosis. 2003;8(1):101–108 [DOI] [PubMed] [Google Scholar]
- 17. Freireich EJ, Gehan EA, Rall DP, Schmidt LH, Skipper HE. Quantitative comparison of toxicity of anticancer agents in mouse, rat, hamster, dog, monkey, and man. Cancer Chemother Rep. 1966;50(4):219–244 [PubMed] [Google Scholar]
- 18. Hiura Y, Takiguchi S, Yamamoto K, et al. Effects of ghrelin administration during chemotherapy with advanced esophageal cancer patients: a prospective, randomized, placebo-controlled phase 2 study. Cancer. 2012;118(19):4785–4794 [DOI] [PubMed] [Google Scholar]
- 19. Sun Y, Wang P, Zheng H, Smith RG. Ghrelin stimulation of growth hormone release and appetite is mediated through the growth hormone secretagogue receptor. Proc Natl Acad Sci USA. 2004;101(13):4679–4684 [DOI] [PMC free article] [PubMed] [Google Scholar]
- 20. Shen WJ, Sridhar K, Bernlohr DA, Kraemer FB. Interaction of rat hormone-sensitive lipase with adipocyte lipid-binding protein. Proc Natl Acad Sci USA. 1999;96(10):5528–5532 [DOI] [PMC free article] [PubMed] [Google Scholar]
- 21. Purushotham A, Schug TT, Xu Q, Surapureddi S, Guo X, Li X. Hepatocyte-specific deletion of SIRT1 alters fatty acid metabolism and results in hepatic steatosis and inflammation. Cell Metab. 2009;9(4):327–338 [DOI] [PMC free article] [PubMed] [Google Scholar]
- 22. Buettner C, Muse ED, Cheng A, et al. Leptin controls adipose tissue lipogenesis via central, STAT3-independent mechanisms. Nat Med. 2008;14(6):667–675 [DOI] [PMC free article] [PubMed] [Google Scholar]
- 23. Anthonsen MW, Rönnstrand L, Wernstedt C, Degerman E, Holm C. Identification of novel phosphorylation sites in hormone-sensitive lipase that are phosphorylated in response to isoproterenol and govern activation properties in vitro. J Biol Chem. 1998;273(1):215–221 [DOI] [PubMed] [Google Scholar]
- 24. Greenberg AS, Shen WJ, Muliro K, et al. Stimulation of lipolysis and hormone-sensitive lipase via the extracellular signal-regulated kinase pathway. J Biol Chem. 2001;276(48):45456–45461 [DOI] [PubMed] [Google Scholar]
- 25. Bartness TJ, Shrestha YB, Vaughan CH, Schwartz GJ, Song CK. Sensory and sympathetic nervous system control of white adipose tissue lipolysis. Mol Cell Endocrinol. 2010;318(1–2):34–43 [DOI] [PMC free article] [PubMed] [Google Scholar]
- 26. Muoio DM, Newgard CB. Fatty acid oxidation and insulin action: when less is more. Diabetes. 2008;57(6):1455–1456 [DOI] [PubMed] [Google Scholar]
- 27. Garcia JM, Cata JP, Dougherty PM, Smith RG. Ghrelin prevents cisplatin-induced mechanical hyperalgesia and cachexia. Endocrinology. 2008;149(2):455–460 [DOI] [PMC free article] [PubMed] [Google Scholar]
- 28. Deboer MD, Zhu X, Levasseur PR, et al. Ghrelin treatment of chronic kidney disease: improvements in lean body mass and cytokine profile. Endocrinology. 2008;149(2):827–835 [DOI] [PMC free article] [PubMed] [Google Scholar]
- 29. Yakabi K, Sadakane C, Noguchi M, et al. Reduced ghrelin secretion in the hypothalamus of rats due to cisplatin-induced anorexia. Endocrinology. 2010; 15198):3773–3782 [DOI] [PubMed] [Google Scholar]
- 30. Hiura Y, Takiguchi S, Yamamoto K, et al. Fall in plasma ghrelin concentrations after cisplatin-based chemotherapy in esophageal cancer patients. Int J Clin Oncol. 2012;17(4):316–323 [DOI] [PubMed] [Google Scholar]
- 31. Dobrzyn P, Dobrzyn A, Miyazaki M, et al. Stearoyl-CoA desaturase 1 deficiency increases fatty acid oxidation by activating AMP-activated protein kinase in liver. Proc Natl Acad Sci USA. 2004;101(17):6409–6414 [DOI] [PMC free article] [PubMed] [Google Scholar]
- 32. Theander-Carrillo C, Wiedmer P, Cettour-Rose P, et al. Ghrelin action in the brain controls adipocyte metabolism. J Clin Invest. 2006;116(7):1983–1993 [DOI] [PMC free article] [PubMed] [Google Scholar]
- 33. Barazzoni R, Bosutti A, Stebel M, et al. Ghrelin regulates mitochondrial-lipid metabolism gene expression and tissue fat distribution in liver and skeletal muscle. Am J Physiol Endocrinol Metab. 2005;288(1):E228–E235 [DOI] [PubMed] [Google Scholar]
- 34. Wang W, Andersson M, Iresjö BM, Lönnroth C, Lundholm K. Effects of ghrelin on anorexia in tumor-bearing mice with eicosanoid-related cachexia. Int J Oncol. 2006;28(6):1393–1400 [PubMed] [Google Scholar]
- 35. Davies JS, Kotokorpi P, Eccles SR, et al. Ghrelin induces abdominal obesity via GHS-R-dependent lipid retention. Mol Endocrinol. 2009;23(6):914–924 [DOI] [PMC free article] [PubMed] [Google Scholar]
- 36. Barazzoni R, Semolic A, Cattin MR, Zanetti M, Guarnieri G. Acylated ghrelin limits fat accumulation and improves redox state and inflammation markers in the liver of high-fat-fed rats [published online March 20, 2013]. Obesity (Silver Spring). doi: 10.1002/oby.20454 [DOI] [PubMed] [Google Scholar]
- 37. Porporato PE, Filigheddu N, Reano S, et al. Acylated and unacylated ghrelin impair skeletal muscle atrophy in mice. J Clin Invest. 2013;123(2):611–622 [DOI] [PMC free article] [PubMed] [Google Scholar]
- 38. Liu W, Thomas SG, Asa SL, Gonzalez-Cadavid N, Bhasin S, Ezzat S. Myostatin is a skeletal muscle target of growth hormone anabolic action. J Clin Endocrinol Metab. 2003;88(11):5490–5496 [DOI] [PubMed] [Google Scholar]
- 39. Cao H, Gerhold K, Mayers JR, Wiest MM, Watkins SM, Hotamisligil GS. Identification of a lipokine, a lipid hormone linking adipose tissue to systemic metabolism. Cell. 2008;134(6):933–944 [DOI] [PMC free article] [PubMed] [Google Scholar]
- 40. Boden G. Fatty acid-induced inflammation and insulin resistance in skeletal muscle and liver. Curr Diab Rep. 2006;6(3):177–181 [DOI] [PubMed] [Google Scholar]
- 41. Funai K, Semenkovich CF. Skeletal muscle lipid flux: running water carries no poison. Am J Physiol Endocrinol Metab. 2011;301(2):E245–E251 [DOI] [PMC free article] [PubMed] [Google Scholar]
- 42. ThidarMyint H, Yoshida H, Ito T, Kuwayama H. Dose-dependent response of plasma ghrelin and growth hormone concentrations to bovine ghrelin in Holstein heifers. J Endocrinol. 2006;189(3):655–664 [DOI] [PubMed] [Google Scholar]