

Abstract
Obesity is linked to various diseases, including insulin resistance, diabetes, and cardiovascular disorders. The idea of inducing white adipose tissue (WAT) to assume characteristics of brown adipose tissue (BAT), and thus gearing it to fat burning instead of storage, is receiving serious consideration as potential treatment for obesity and related disorders. Phosphodiesterase 3B (PDE3B) links insulin- and cAMP-signaling networks in tissues associated with energy metabolism, including WAT. We used C57BL/6 PDE3B knockout (KO) mice to elucidate mechanisms involved in the formation of BAT in epididymal WAT (EWAT) depots. Examination of gene expression profiles in PDE3B KO EWAT revealed increased expression of several genes that block white and promote brown adipogenesis, such as C-terminal binding protein, bone morphogenetic protein 7, and PR domain containing 16, but a clear BAT-like phenotype was not completely induced. However, acute treatment of PDE3B KO mice with the β3-adrenergic agonist, CL316243, markedly increased the expression of cyclooxygenase-2, which catalyzes prostaglandin synthesis and is thought to be important in the formation of BAT in WAT and the elongation of very long-chain fatty acids 3, which is linked to BAT recruitment upon cold exposure, causing a clear shift toward fat burning and the induction of BAT in KO EWAT. These data provide insight into the mechanisms of BAT formation in mouse EWAT, suggesting that, in a C57BL/6 background, an increase in cAMP, caused by ablation of PDE3B and administration of CL316243, may promote differentiation of prostaglandin-responsive progenitor cells in the EWAT stromal vascular fraction into functional brown adipocytes.
Acquisition of brown fat characteristics by white adipose tissue (WAT) has generated considerable interest as a promising strategy to treat obesity, which is responsible, in part, for the worldwide increase in the incidence of insulin resistance, diabetes, and cardiovascular disorders. Until now, several knockout and transgenic mouse models have been reported to display brown fat characteristics in their WAT, resulting in a metabolic shift to energy use rather than storage (reviewed in References 1 and 2). Also, certain genetically modified or experimentally-manipulated white preadipocyte cell lines have been induced to differentiate into multilocular cells rich in mitochondria, with gene and protein profiles that are typical of brown adipocytes (3, 4). Thus, several genes, eg, peroxisome proliferator-activated receptor-gamma (Pparg), PPAR-γ coactivator 1 alpha (Pgc1a), CCAAT/enhancer-binding protein-beta (Cebpb), bone morphogenetic protein 7 (Bmp7), and PR domain containing 16 (Prdm16), have emerged as being closely tied to brown adipogenesis (reviewed in References 5 and 6). Interestingly, recent studies have identified brite/beige adipocytes, distinct from white or brown adipocytes, which highly express uncoupling protein 1 (UCP1) after stimulation with cAMP (7, 8). However, the context and regulation of signaling pathways leading to the acquisition of brown adipose tissue (BAT)-like characteristics by WAT in different systems and depots are not fully understood.
Cyclic nucleotide phosphodiesterase 3B (PDE3B) belongs to a large and complex superfamily which contains 11 phosphodiesterase (PDE1–11) gene families. PDE3B plays a critical role in linking insulin and cAMP signaling networks in tissues involved in energy metabolism (9, 10). It is well established that elevated cAMP levels, induced by either prolonged administration of a β-adrenergic agonist or exposure to cold, promote BAT formation in mouse WAT (11, 12). Furthermore, functional BAT has been found in healthy human adults exposed to cold (13–15). PDE3B is a major phosphodiesterase in WAT in which, via controlling specific intracellular cAMP pools, it regulates an array of metabolic processes, including lipolysis, lipogenesis, and glucose uptake (reviewed in References 10 and 16). Therefore, we viewed PDE3B knockout (KO) mice as potentially useful to study mechanisms involved in BAT induction in WAT.
In this study, we examined the adipogenic and thermogenic gene expression profiles in epididymal WAT (EWAT) from PDE3B KO mice in C57BL/6 background (which is prone to obesity), in the context of BAT formation. Although previous studies provided examples of browning of sc WAT after exposure to cold or pharmacological stimulation (17–19), other studies also demonstrated emergence of thermogenically competent, UCP1-expressing cells in EWAT after chronic treatment with CL316243 or PPARγ agonists (7, 19–21). In one study (20), chronic infusion of CL316243 was associated with robust induction of brown adipocytes (BAs) in both inguinal (IWAT) and EWAT but via different mechanisms and with a different time course, ie, 3 or 7 days for the appearance of UCP1+ cells in IWAT or EWAT, respectively. Genetic lineage tracing techniques demonstrated that CL316243-induced BAs in EWAT were most likely derived via proliferation and differentiation of progenitor cells that expressed platelet-derived growth factor receptor (PDGFR)-α, stem-cell antigen (Sca-1), and CD34, whereas the appearance of BAs in IWAT involved transdifferentiation of existing white adipocytes (20). Although EWAT is thought to be an adipose tissue depot that is refractory to browning, it may actually provide, as in our current study, a target to study the role of regulation/dysregulation of specific key genes in the phenomenon of browning because WAT/BAT phenotypic conversion of gonadal WAT has been reported to be facilitated by knockout of fat-specific protein 27 (FSP27), a member of the Cide lipid droplet protein family (22), and autophagy-related 7 (ATG7), a critical macroautophagy gene (23). Because EWAT can be considered as an example of visceral fat, which is thought to play an important role in the etiology of various metabolic disorders, including insulin resistance, systemic inflammation, and cardiovascular diseases (24–28), understanding the mechanisms for WAT/BAT phenotypic conversion in EWAT could point the way toward novel therapies for these diseases.
We found that although EWAT of PDE3B KO mice displayed increased expression of genes blocking white and promoting brown adipogenesis (eg, Ctbp, Bmp7, and Prdm16), a clear BAT-like phenotype was not completely induced. However, acute treatment of PDE3B KO mice with the β3-adrenergic agonist, CL316243, significantly increased expression of several genes, including prostaglandin-endoperoxide synthase 2 (Ptgs2), encoding cyclooxygenase (COX)-2, resulting in a clear shift toward fat burning and induction of BAT in their EWAT. These data suggest that, in the C57BL/6 background, an increase in cAMP, caused by ablation of PDE3B and administration of CL316243, may promote differentiation of prostaglandin-responsive progenitor cells in the EWAT stromal vascular fraction into functional brown adipocytes (29).
Materials and Methods
Animals
PDE3B KO mice in a C57BL/6 background were generated by mating C57BL/6 wild-type (WT) females with SvJ129 PDE3B KO males [constructed as previously described (30)] and then backcrossing the progeny into a C57BL/6 background for 9 generations. Experiments, approved by the National Heart, Lung, and Blood Institute Animal Care and Use Committee (Bethesda, MD), were performed using age-matched, 4-month-old WT (purchased from Taconic Farms, Germantown, New York) and PDE3B KO male mice. Animals were housed at 23°C unless otherwise indicated.
CL31624 and cilostamide injections
PDE3B KO and WT mice received 1 sc injection of 1 mg/kg CL316423 (Sigma, St Louis, Missouri) or PBS or 3–6 ip injections of 0.5 mg/kg CL316243 or PBS/saline. Tissues were collected 24 hours after the injections. WT mice were ip injected with 10 mg/kg cilostamide (Calbiochem, La Jolla, California) or 10% dimethylsulfoxide (DMSO) twice daily for 3 days or once daily for 5 days at 10 μL/g body mass (31). On day 3, mice additionally received 1 sc injection of 1 mg/kg CL316243 or PBS for 24 hours or 3 ip injections of 0.5 mg/kg CL316243 or PBS for 3 days.
Exercise
Mice were subjected to treadmill exercise (32) at 10 m/min and 15° incline for 1 hour daily for 23 days. Upon signs of exhaustion, mice were allowed to rest. Animals were weighed before and after each exercise.
Microarray studies
Target preparation and hybridization to Affymetrix gene chips (Santa Clara, California), as well as microarray data processing and analysis are described in Supplemental Materials and Methods, published on The Endocrine Society's Journals Online web site at http://endo.endojournals.org.
Quantitative RT-PCR (qRT-PCR)
EWAT RNA was isolated and assayed as previously described (30). Primers used for qRT-PCR are listed in Supplemental Table 1.
Whole-body oxygen consumption
Indirect calorimetry was performed on 12 WT and 11 PDE3B KO mice as described in Supplemental Materials and Methods.
Ex vivo biodistribution
After an overnight fast, mice were ip injected with 3.7 MBq (100 μCi) of 18F-fluorodeoxyglucose (18F-FDG) (Cardinal Health, Dublin, Ohio) and euthanized 1 hour later. Muscle, EWAT, and BAT were collected and wet weighed. Radioactivity in the wet whole tissue was measured with a γ-counter. Results were expressed as percentage of injected dose per gram of tissue.
Western blot analysis
Detailed information about sample preparation, antibodies, their dilutions, reference numbers, and companies can be found in Supplemental Materials and Methods and Supplemental Table 2.
MitoTracker mitochondrial staining
Slides with EWAT sections (12–20 μM thick) were placed in DMEM containing MitoTracker Red (500 nM: Molecular Probes, Eugene, Oregon), incubated for 10 minutes, washed with PBS (3 × 5 min), fixed in PBS containing 4% paraformaldehyde for 30 minutes, and mounted. Slides were viewed with an LSM510 laser-scanning confocal microscope (Zeiss, Thornwood, New York).
Statistical analysis
A Student's t test (Microsoft Excel, Redmond, Washington) was applied to all experiments except the Affymetrix microarray. The results are expressed as means ± SEM.
Results
Effects of CL316243 on body weight, EWAT mobilization, oxygen consumption, lipid oxidation, and 18F-FDG uptake in C57 PDE3B KO mice: induction of BAT in PDE3B KO EWAT
Given the potential clinical relevance in understanding mechanisms for induction of BAT in WAT depots (2) and the importance of cAMP in initiating mitochondrial biogenesis and the thermogenic program (33, 34), age-matched, male C57 WT and PDE3B KO mice were treated with the β3-adrenergic agonist, CL316243, to study the effects of increased cAMP levels on induction of the BAT phenotype in WT and PDE3B KO EWAT. As shown in Figure 1A (right panel), compared with WT mice, PDE3B KO mice had reduced amount of EWAT, and, within 24 hours after treatment with CL316243, they exhibited a significantly greater loss in total body weight (Figure 1, left panel) and in EWAT weight (Figure 1, right panel). Likewise, PDE3B KO mice subjected to 1-hour treadmill exercise training every day for 23 d showed larger oscillations in their daily changes in body weight as compared with WT mice, indicating that PDE3B KO mice may be metabolically more active than WT mice (Figure 1B). As shown in Figure 1C, the average weight loss during exercise was significantly increased in PDE3B KO mice as compared with that in similarly exercised WT mice. Hematoxylin and eosin staining, together with cell-area calculations, indicated that EWAT adipocyte size was significantly decreased in PDE3B KO mice as compared with WT (Figure 2, A and B). After treatment with CL316243 EWAT, adipocyte size was significantly decreased, and was similar to EWAT cell size in PDE3B KO mice. In addition, as shown in Figure 2C (imaging and quantification of fluorescence intensity vs distance along the drawn line) and Figure 2D (histogram of average fluorescence intensity), MitoTracker staining demonstrated considerably higher mitochondrial activity in EWAT of CL316243-treated PDE3B KO mice as compared to their PBS-treated KO and CL3162423-treated WT counterparts. Also, EWAT pads of CL316243-treated PDE3B KO mice were firmer in texture and more brownish than those of WT and PBS-treated KO mice (data not shown).
Figure 1.

Comparison of effects of CL316243 or exercise on weight loss and EWAT mass loss in C57 WT and PDE3B KO mice. A, Weight and fat mass loss in C57 PDE3B KO mice after CL316243 treatment. Four-month-old C57 WT and PDE3B KO mice were weighed and sc injected with 1 mg/kg of CL316243 in PBS or with PBS alone. Twenty-four hours after injections, the mice were weighed and their EWAT pads were collected and weighed. Data from 4 experiments (3–4 mice per condition in each) are expressed as means ± SEM. Left panel, Average body weight loss is presented as percentage of initial body weight. Right panel, Representation of WAT weight to body weight ratio. *, P ≤ .05 vs WT; †, P ≤ .05 vs PDE3B KO; ‡, P ≤ .05 vs WT+CL. B and C, Weight loss in C57 PDE3B KO mice after exercise. Four-month-old C57 WT and PDE3B KO mice were subjected to treadmill exercise at 10 m/min and 15° incline for 1 hour per day for 23 days. Upon signs of exhaustion, animals were allowed to rest. Mice were divided into 2 groups, nonexercising (upper panel) and exercising (lower panel), and were weighed before and after each exercise. B, Average daily body weight changes (3 mice per group) are presented as percentage of initial body weight. C, Average weight loss in WT and PDE3B KO mice during exercise was calculated after 22 days of exercise regimen and is presented as percentage of initial body weight before exercise. ***, P < .001 vs WT after exercise (n= 66; 3 mice each × 22 d).
Figure 2.
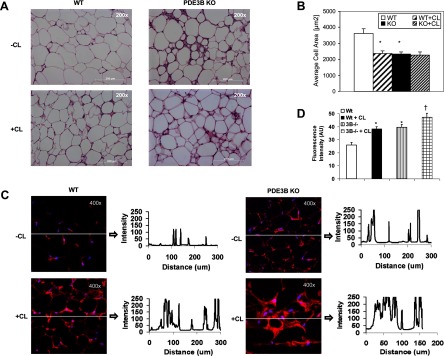
Comparison of effects of CL316243 on EWAT adipocyte size and mitochondrial activity in C57 WT PDE3B KO mice. A–D, C57 WT and PDE3B KO mice were sc injected with 1 mg/kg of CL316243 in PBS or with PBS alone. EWAT pads were collected 24 hours after injections, fixed in formalin for 3 hours, hydrated, frozen, cut, and stained. A, EWAT morphology (hematoxylin and eosin staining, magnification, ×200), B, Average cell area of hematoxylin-and-eosin-stained slides was calculated using MetaMorph Image Analysis software (BioImaging Solutions, San Diego, California). *, P ≤ .0001 vs WT. C, Mitochondrial activity [MitoTracker staining (Molecular Probes), magnification, ×400]. Fluorescence intensity distribution vs distance along the line drawn on each image was plotted using Carl Zeiss LSM 510 META software. D, Average fluorescence intensity (mean pixel intensity, arbitrary units) of MitoTracker-stained mitochondria was calculated from 3 slides per condition divided into 15 automatically set regions of interest each with the use of Carl Zeiss LSM 510 META software. Values were expressed as means ± SE. *, P ≤ .05 vs WT; †, P ≤ .05 vs PDE3B KO. Representative pictures of 3 mice per condition are shown.
To correlate some of these CL316243-induced changes in morphology and EWAT mobilization with changes in energy expenditure, we studied whole-body oxygen consumption after 3 days of treatment of WT and KO mice with saline or a low dose (0.5 mg/kg) of CL316243, followed by administration of a higher dose (1 mg/kg) of CL316243 to all mice on day 4. As seen in Figure 3A, total oxygen consumption did not differ significantly between WT and PDE3B KO mice for the first 3 days, regardless of the treatment. However, administration of CL316243 and raising the ambient temperature to 30°C on day 4 caused a substantially greater increase in oxygen consumption in CL316243-pretreated PDE3B KO mice (Figure 3A, red line on the graph) as compared with CL316243-pretreated WT mice (Figure 3A, blue line on the graph). The respiratory exchange ratio (RER), presented in Figure 3B, estimates whether carbohydrate or fat is being primarily metabolized to supply energy, with an increase reflecting carbohydrate metabolism, and a decrease, fat metabolism. The initial response to administration of CL316243 resulted in a lowering of RER in both WT and PDE3B KO mice, consistent with an increase in lipolysis and fatty acid oxidation, and this response was attenuated with the next 2 doses of CL316243. However, after blunting adaptive thermogenesis by increasing the ambient temperature to 30°C, we noticed a substantial shift to lipid oxidation in CL316243-treated PDE3B KO mice (red line on the graph) compared with carbohydrate metabolism in CL316243-treated WT mice (blue line on the graph), suggesting a change to fat-burning in the KO mice.
Figure 3.
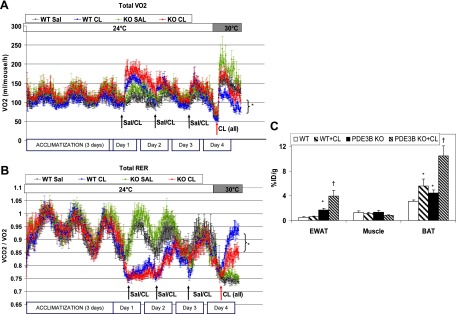
Treatment of C57 PDE3B KO mice with CL316243 results in increased BAT formation in EWAT, higher oxygen consumption, and fatty acid oxidation. A and B, Whole-body oxygen consumption (VO2) and respiratory exchange ratio. Four-month-old PDE3B KO and WT mice were ip injected with CL316243 (0.5 mg/kg) or saline for 3 days. On day 4, all mice were injected with 1 mg/kg CL316243. VO2 and VCO2 were measured at 24°C for 3 days and at 30°C on day 4. Data are expressed as means ± SEM (n = 5–6 per condition). *, P ≤ .05 vs WT+CL. C, Ex vivo biodistribution. Four-month-old C57 WT and PDE3B KO mice were sc injected with 0.5 mg/kg of CL316243 in PBS or with PBS alone for 6 days. On day 7, after an overnight fast, mice were ip injected with 3.7 MBq (100 μCi) of 18F-FDG. One hour after injection, muscle, EWAT, and BAT were collected and wet weighed. Radioactivity was measured in the wet whole tissue. Data are expressed as percentage of injected dose per gram of tissue (%ID/g) for a group of 7–8 mice. Values were expressed as means ± SEM. *, P ≤ .05 vs WT; †, P ≤ .05 vs PDE3B KO.
To determine whether the changes observed in C57 PDE3B KO EWAT after β3-adrenergic stimulation, ie, altered morphology, elevated mitochondrial biogenesis, higher oxygen consumption, and lipid oxidation, might be related to increased induction of brown fat, we measured 18F-FDG uptake into EWAT, BAT, and skeletal muscle for 1 hour, after sc injection of C57 WT and PDE3B KO mice for 6 days with PBS or with a low dose of CL316243. Using 18F-FDG uptake to measure BAT induction is based on certain BAT properties, ie, increased anaerobic glycolysis as a compensation for the uncoupling of respiration (35). As seen in Figure 3C, PBS-treated PDE3B KO EWAT displayed more BAT activity than WT EWAT, and this phenotype was considerably enhanced after pretreatment of PDE3B KO mice with CL316243. In contrast to PDE3B KO EWAT, WT EWAT was not affected by the pretreatment with CL316243. Skeletal muscle, used as a negative control, showed no differences in 18F-FDG uptake between any tested groups. BAT in PDE3B KO mice exhibited higher 18F-FDG uptake than their WT counterparts, and this increase in 18F-FDG uptake was even more pronounced after treatment of the mice with CL316243. Unlike WT EWAT, WT BAT was positively affected by the treatment with CL316243 (Figure 3C).
Effects of acute treatment with CL316243 on gene expression in C57 PDE3B KO mice: BAT recruitment in WAT
Because metabolic studies in C57 mice indicated an apparent shift toward higher energy expenditure and BAT induction in their EWAT after treatment with CL316243 and because it is well established that exposure of C57 mice to cold or chronic β-adrenergic stimulation results in cAMP-dependent acquisition of some BAT characteristics in their sc (17), as well as epididymal (21), WAT, we analyzed changes in expression of EWAT genes related to adipogenesis and mitochondrial function using Affymetrix microarrays and qRT-PCR, 24 hours after injection of C57 WT and PDE3B KO mice with PBS or CL316243. Microarray data analysis revealed changes in the expression of numerous (>2000) genes, especially in CL316243-treated PDE3B KO mice (data not shown).
In this study, we focused on genes related to adipogenesis and mitochondrial function (summarized in Table 1), and verified changes in a number of these genes and others (not detected by microarray), by qRT-PCR. As shown in Figure 4, A–D, a number of genes involved in brown adipogenesis were up-regulated in EWAT of C57 PDE3B KO mice as compared with their WT counterparts, eg, Cebpa and Cebpb, which are principal adipogenic transcription factors [C/EBPβ is indispensable for BAT formation (36, 37)]; Bmp7, which induces commitment of progenitor cells to BAT lineage (4); Prdm16 and leucine-rich protein 130 (Lrp130), which play a role in BAT development and differentiation (37, 38); tumor progression locus 2 (Tpl2), which is an activator of p38 MAPK and is involved in brown adipocyte maturation (39, 40); activating transcription factor 2 (Atf2), which increases transcription of PGC1α, a key factor in BAT mitochondrial biogenesis (41); and Ctbp and forkhead box C2 (Foxc2), which suppress WAT differentiation (37, 42).
Table 1.
Summary of the Affymetrix Gene Chip and qRT-PCR Data Concerning Adipogenesis- and Mitochondrial Function-Related Genes in C57 PDE3B KO Mice Treated With CL316243 and in C57 WT Mice Treated With Cilostamide and/or CL316243
| Gene | Role | PDE3B KO vs WT | PDE3B KO+CL vs WT (vs KO) | WT+CIL vs V | WT+CIL+CL vs V (vs CIL) |
|---|---|---|---|---|---|
| Adipogenesis | |||||
| Cebpa | Principal regulator of adipogenesis, especially WAT (36) | 2 | 0.1 | 2 | 0.2 |
| Cebpb | Early adipogenic TF; regulates expression of PPARγ (65); in complex with PRDM16 forms a BAT switch (37) | 3 | 8 (n.s.) | 2 | 4/0.5 |
| Sirt1 | Represses PPARγ-mediated transcription and adipogenesis; triggers fat mobilizations upon caloric restriction (66) | 1 | 0.5 (n.s.) | n.s. | 0.3 |
| Ncor | Represses PPARγ-mediated gene transcription (44) | 2 | 0.3 | 3 | 0.3 |
| Necdin | Represses PPARγ-mediated gene transcription (4) | n.s. | 0.2 | 2 | 0.2 |
| MyoD | Muscle differentiation (67); target for Sirt1 (68) | 0.6 | 0.3 (n.s.) | 4 | 0.1 |
| Grem2 | BMP antagonist (48) | 0.6 | 1.5 | 3 | 0.3 |
| Tpl2 | Activates p38MAPK, involved in mature BA phenotype (39, 40) | 2 | 4 (n.s.) | 2 | 0.9 (n.s.) |
| White adipogenesis | |||||
| Bmp4 | Stimulates differentiation of mesenchymal stem cells to adipocytes (45) | 1 | 0.5 | 3 | 0.2 |
| Rip140 | Suppresses PPARs and BAT characteristics, controls lipid metabolism (46) | 1 | 0.3 | 3 | 0.2 |
| P107 | Suppresses BAT differentiation via repression of FOXC2 and PGC1 (47) | 1 | 0.4 | 5 | 1 |
| Rb1 | Activates C/EBPα-mediated transcription, suppresses PPARγ, regulates WAT vs BAT differentiation (43) | 2 | 0.3 | 3 | 0.2 |
| Resistin | Modulation of adipogenesis (69) | 2 | 0.6 | 3 | 0.2 |
| Brown adipogenesis | |||||
| Bmp7 | Commitment of mesenchymal progenitor cells to BAT lineage (4) | 3 | 0.1 | 3 | 0.01 |
| Prdm16 | Determination of BA lineage and commitment (6) | 3 | 0.3 | 3 | 0.3 |
| Ctbp | In complex with PRDM16 represses white fat genes (37) | 2 | 0.4 | 2 | 0.7 |
| Foxc2 | Inhibits WAT differentiation (70); regulator of mitochondrial function (42) | 3 | 0.3 | 4 | 0.3 |
| Atf2 | Increases expression of PGC-1α (41); regulates transcription of PPARγ (71) | 2 | 1 (n.s.) | 3 | 0.5 |
| Sirt3 | Enhances expression of PGC1, UCP1, and other mitochondrial genes (72) | 1 | 0.6 (n.s.) | 4 | 0.2 |
| Lrp130 | Brown fat development and differentiation (38) | 2 | 0.7 | 2 | 0.5 |
| BAT recruitment | |||||
| Ptgs2 (COX-2) | Required for the induction of BAT in WAT depots (29) | 2 | 57 | 3 | 24 |
| Elovl3 | Fatty acid uptake and storage (73); recruitment of BAT upon cold exposure (51) | 26 | 2857 | 7 | 24 |
| Mitochondrial biogenesis and function | |||||
| Pgc1 | Increases transcriptional activity of PPARγ and thyroid hormone receptor on UCP1 promoter (74) | 2 | 1 (n.s.) | 2 | 0.3 |
| Cox4 | Regulation and assembly of the mitochondrial respiratory chain (75) | 9 | 0.4 | 2 | 0.5 |
| Cidea | Regulation of thermogenesis, lipolysis, and energy balance, in part via its direct suppression of Ucp1 activity (61) | 12 | 0.5 | 5 | 0.1 |
| Ucp1 | Mitochondrial transporter; uncouples oxidative phosphorylation from ATP synthesis, resulting in heat production (76) | 5146 | 5E + 11 | 5 | 4349 |
| Dio2 | Controls intracellular T3 concentration and energy expenditure in BAT (77) | 52 | 120 | 1 | 60 |
| Ppara | Transcriptional activation of PGC1, UCP1, and lipid oxidation genes (55) | 2 | 0.6 | 2 | 0.2 |
| Cpt2 | Essential for fatty acid oxidation (56) | 2 | 0.3 | 2 | 0.2 |
| Gyk | Fat and carbohydrate metabolism (59) | 3 | 7 (n.s.) | 2 | 7 |
Abbreviations: CIL, cilostamide; CL, CL316243; n.s., not significant; V, vehicle. Presented fold changes of EWAT gene expressions are normalized to gene levels in PBS-treated WT mice set as 1 for PDE3B KO EWAT ± CL316243 and to gene levels in vehicle-treated WT mice set as 1 for cilostamide ± CL316243-treated WT mice. Listed fold changes are statistically significant (P = .05); n.s. between parentheses indicates not significant comparing PDE3B KO mice after administration of CL316243 vs PBS (column 4 compared with column 3) or comparing cilostamide-treated WT mice after administration of CL316243 vs PBS (column 6 compared with column 5).
Figure 4.

Differential effects of CL316243 on expression of EWAT genes related to adipogenesis and mitochondrial function in EWAT from PDE3B KO and WT mice. A–E, Four-month-old C57 PDE3B KO mice were sc injected with 1 mg/kg of CL316243 in PBS or with PBS alone. EWAT pads were collected 24 hours after injections. Total mRNA was prepared and gene expression was measured using qRT-PCR as described in Materials and Methods. Gene expression levels were quantified as a ratio of target transcripts to 18S mRNA. Data from 3 experiments (3–4 mice per condition in each) are expressed as means ± SEM and normalized to nontreated WT control group set as 1. *, P ≤ .05 vs WT; †, P ≤ .05 vs PDE3B KO.
On the other hand, elevated levels of Rb1, which suppresses PPARγ and activates C/EBPα-mediated transcription, promoting WAT vs BAT differentiation (43), as well as increases in nuclear receptor corepressor (Ncor) and necdin, which also repress PPARγ-mediated gene transcription (4, 44), may have reduced acquisition of BAT characteristics by PDE3B KO EWAT. In general, these results indicate enhanced activation of brown- and suppression of white-adipogenesis programs in C57 PDE3B KO EWAT. However, this observed increase in brown adipogenic gene expression did not seem to correlate with acquisition of clear-cut BAT-like characteristics in KO EWAT at the morphological and physiological levels because, even though there were differences between WT and PDE3B KO EWAT with regard to fat pad and adipocyte size, oxygen consumption, 18F-FDG uptake, and MitoTracker staining, they were not extensive (Figures 1–3). On the other hand, as shown in Figure 4A, administration of CL316243 to PDE3B KO mice resulted in a substantial decrease in the expression of most of adipogenic genes except Cebpb, critical for BAT function (Figure 4A). In addition, as shown in Figure 4B, CL316243 treatment significantly lowered the expression of Bmp4, which stimulates white adipogenesis (45), receptor-interacting protein 140 (Rip140) and p107, which suppress BAT differentiation (46, 47), and resistin. Thus, β3-adrenergic stimulation further suppressed white adipogenesis-related genes and simultaneously abated the inhibitory effects of Rip140 and retinoblastoma family (Rb1, p107) on brown adipogenesis. Also, as shown in Figure 4A, C57 PDE3B KO EWAT displayed reduced expression of gremlin 2 (Grem2), a BMP antagonist (48), and myogenin D (MyoD), involved in muscle differentiation (49). CL316243 treatment elevated the expression of Grem2 without influencing MyoD (Figure 4A), indicating a shift toward suppression of de novo adipogenic and myogenic programs.
Interestingly, as shown in Figure 4C, the EWAT of C57 PDE3B KO mice showed an increase in the expression of Ptgs2, the gene of COX-2, tightly associated with BAT formation in WAT (29, 50), as well as elongation of very long-chain fatty acids 3 (Elovl3), linked to BAT recruitment upon cold exposure (51). Both of these genes were further up-regulated after CL316243 treatment (Figure 4C), showing, in agreement with the above-mentioned changes, that C57 PDE3B KO EWAT is geared toward BAT-like remodeling, especially after CL316243 treatment. As seen in Figure 4E, expression of genes related to thermogenic and mitochondrial function including uncoupling protein 1 (Ucp1), type II iodothyronine deiodinase (Dio2), subunit IV of cytochrome c oxidase (Cox4), cell death-inducing DNA fragmentation factor-α-like effector A (Cidea), Pgc1, Ppara, carnitine palmitoyltransferase 2 (Cpt2), and glycerokinase (Gyk) were up-regulated in EWAT of PDE3B KO mice as compared with WT. These results suggest that ablation of PDE3B initiates the thermogenic program and promotes fatty acid oxidation in WAT. Administration of CL316243 resulted in further up-regulation of Ucp1 and Dio2, linked with thermogenesis, and in a substantial decrease in the levels of Cox4, Cidea, Ppara, and Cpt2 (Figure 4E), linked to mitochondrial oxidative functions (cf. Figures 2, C and D, and 3, A–C). In summary, CL316243-treatment of C57 PDE3B KO mice caused a clear-cut decrease in the expression of most adipogenic genes and a significant increase in the expression of genes related to thermogenesis and BAT recruitment in EWAT.
Effects of cilostamide, a selective PDE3 inhibitor, on C57 WT EWAT: changes in morphology, mitochondrial activity, and expression of genes related to adipogenesis, thermogenesis, and mitochondrial function
To further analyze the expression of genes and other factors contributing to the emergence of a BAT-like phenotype in PDE3B KO EWAT, C57 WT mice were treated with the PDE3 inhibitor, cilostamide, using 2 different drug administration protocols. One involved injection of vehicle or cilostamide twice a day for 3 days followed by a single injection of CL316243 to all mice on day 3 and tissue collection 24 hours later. The other regimen was a single daily dose of vehicle or cilostamide for 5 days, combined with a single daily dose of CL316243, to all mice starting on days 3–5. As seen in Figure 5, A–D, C57 adipocyte size was smaller (Figure 5, A and B), and mitochondrial activity (Figure 5, C and D) was greater in EWAT from cilostamide-treated WT mice than in EWAT from vehicle-treated WT mice. As shown in Figure 6, A–D, using either injection schedule, in EWAT from cilostamide-treated C57 WT mice, the expression of adipogenic genes, Cebpa, Cebpb, Ncor1, Tpl2, Rb1, Ptgs2, Bmp7, Prdm16, Ctbp, Fox2, Atf2, and Lrp130, was up-regulated, mimicking the expression pattern of these genes observed in EWAT from C57 PDE3B KO mice (compare Figure 6, A–D, with Figure 4, A–D). However, administration of PDE3 inhibitor also caused an elevation of EWAT Grem2, Bmp4, Rip140, p107, and sirtuin (Sirt)-3, which was not the case in the EWAT from PDE3B KO mice (compare Figure 6, A–D, with Figure 4, A–D). These results indicate that cilostamide treatment to some extent activated genes of both brown and white adipogenic programs, with the white adipogenesis program activated to a greater extent in cilostamide-treated WT than in PDE3B KO EWAT. With regard to thermogenic- and mitochondrial function-related genes, administration of cilostamide resulted in expression level increase of EWAT Ucp1, Pgc1, Cox4, and Cidea, partially mimicking the characteristics observed in PDE3B KO EWAT (compare Figure 6E with Figure 4E). The levels of Ppara and Cpt2 were elevated only after 3 days and Gyk after 5 days of treatment with cilostamide (Figure 6E).
Figure 5.
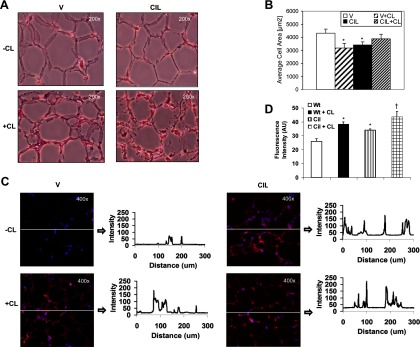
Effects of cilostamide, a PDE3 inhibitor, and CL316243 on WAT morphology and mitochondrial activity in C57 WT mice. A–D, C57 WT mice were ip injected with 10 mg/kg of cilostamide in DMSO/PBS or vehicle (DMSO/PBS) for 5 days. From day 3 to day 5, mice were ip injected with 0.5 mg/kg of CL316243 or PBS. EWAT pads were collected 24 hours after injections. Fat pads were fixed in formalin overnight, hydrated, frozen, cut, and stained. A, EWAT morphology (hematoxylin and eosin staining; magnification, ×200), B, Average cell area of hematoxylin-and-eosin-stained slides was calculated using MetaMorph Image Analysis software. *, P ≤ .05 vs vehicle-treated control group (V). C, Mitochondrial activity [MitoTracker staining (Molecular Probes); magnification ×400]. Fluorescence intensity distribution vs distance along the line drawn on each image was plotted using Carl Zeiss LSM 510 META software. D, Average fluorescence intensity (mean pixel intensity, arbitrary units) of MitoTracker-stained mitochondria was calculated from 3 slides per condition divided into 15 automatically set regions of interest each with the use of Carl Zeiss LSM 510 META software. Values were expressed as means ± SE. *, P ≤ .05 vs vehicle-treated control group (Wt); †, P ≤ .05 vs cilostamide-treated group (CIL). Representative pictures of 3 mice per condition are shown.
Figure 6.

Effects of cilostamide and CL316243 on the expression of genes related to adipogenesis and mitochondrial function in WAT of C57 WT. A–E, C57 WT mice were ip injected with 10 mg/kg of cilostamide in DMSO/PBS or vehicle (DMSO/PBS) for either 3 days, followed by a sc injection with 1 mg/kg of CL316243 on day 3, or for 5 days, and then from day 3 to day 5, mice were ip injected with 0.5 mg/kg of CL316243 or PBS. EWAT pads were collected 24 hours after the final injections. Total mRNA was prepared and gene expression was measured using qRT-PCR as described in Materials and Methods. Gene expression levels were quantified as a ratio of target transcripts to 18S mRNA. Data collected from 6–7 mice per condition in 2 separate experiments are expressed as means ± SEM and normalized to vehicle-treated control group (V) set as 1. *, P ≤ .05 vs V; †, P ≤ .05 vs cilostamide (CIL).
These data suggest that inhibition of PDE3B promotes thermogenesis, mitochondrial biogenesis, and fatty acid oxidation programs. Interestingly, treatment with cilostamide and CL316243 for 5 days resulted in a decrease in the expression of all tested adipogenic EWAT genes (Figure 6, A–D). However, when the PDE3 inhibitor was administered for 3 days followed by CL316243 for 24 hours, expression of Cebpb and Ptgs2 was increased in WT EWAT, mimicking gene expression patterns observed in CL316243-treated C57 PDE3B KO EWAT (compare Figure 6, A and C, with Figure 4, A and C). Also, cilostamide/CL316243-treatment caused an additional increase in the expression of EWAT Elovl3 (under both conditions) as well as Ucp1 and Dio2 (under the 5 d injection protocol), similar to the results obtained in PDE3B KO EWAT after treatment with CL316243 (compare Figure 6, C and E, with Figure 4, C and E). These results are in agreement with our above-mentioned observations that inhibition of PDE3B induces genes related to thermogenesis and BAT recruitment/differentiation in WAT. As for other mitochondrial function genes, the combination of cilostamide and CL316243 resulted in lowering of their expression with the exception of Gyk under the 3-day injection protocol, which also mimicked the patterns noted in EWAT of PDE3B KO mice (compare Figure 6E with Figure 4E). With regard to EWAT of vehicle-treated mice, only Bmp4 expression was decreased and Lrp130 expression was increased upon β3-adrenergic stimulation (data not shown).
In summary, the EWAT of cilostamide-treated C57 WT mice showed an increase in expression of most tested adipogenic- and mitochondrial function-related genes. Additional CL316243 administration to cilostamide-treated mice caused further increases in thermogenic gene expression (Ucp1, Dio2) and a lowering of all adipogenic genes with the exception of genes linked to BAT recruitment in WAT (Cebpb, Ptgs2, Elovl3). In general, the patterns of changes in gene expression were similar in cilostamide-treated WT and PDE3B KO mice, with the exception that the white adipogenesis program was apparently activated to a greater extent in cilostamide-treated WT EWAT than PDE3B KO EWAT.
Effects of CL316243 and/or cilostamide on expression of BAT proteins
In addition to gene expression in PDE3B KO and WT mice, we also tested the expression of several proteins related to BAT function and associated with the emergence of BAT-like characteristics in mouse WAT. With regard to UCP1, a substantial increase in protein expression was noted only after β-adrenergic stimulation, either via agonist administration (Figure 7, A and D) or exercise (Figure 7C). As seen in Figure 7E, the dramatic effect of CL316243 on UCP1 expression in PDE3B KO EWAT was confirmed by immunohistochemical analysis. EWAT expression of mitochondrial PGC1 and Cidea was initially up-regulated PDE3B KO EWAT, but after CL16243-treatment, their expression was decreased (Figure 7, A and D). As also shown (Figure 7, A and D), PPARδ, which induces Ucp1 expression (52), and C/EBPβ, a key player in brown adipogenesis, were up-regulated in PDE3B KO as compared with WT EWAT. CL316243-treatment caused a further increase in the expression of C/EBPβ, as well as PPARα (Figure 7, A and D).
Figure 7.
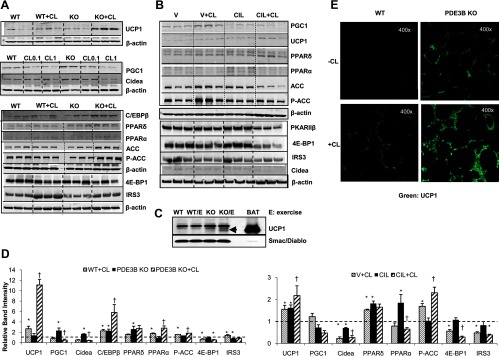
Effects of cilostamide and/or CL316243 or exercise on the expression of proteins related to adipogenesis and mitochondrial function in EWAT of C57 WT and PDE3B KO mice. A and D, C57 WT and PDE3B KO mice (∼4 mo old) were sc injected with 1 mg/kg of CL316243 in PBS or with PBS alone. EWAT pads were collected 24 hours after injections and tissue homogenates were prepared. B and D, C57 WT mice were ip injected with 10 mg/kg of cilostamide in DMSO/PBS or vehicle (DMSO/PBS) for 5 days. From day 3 to day 5, mice were ip injected with 0.5 mg/kg of CL316243 or PBS. EWAT pads were collected 24 hours after injections, and tissue homogenates were prepared. β-Actin was used as loading control. C, C57 WT and PDE3B KO mice (∼4 mo old) were subjected to treadmill exercise at 10 m/min and 15° incline for 1 hour per day for 23 days and continually monitored during the exercise regimen. Upon signs of exhaustion, animals were allowed to rest. After the last exercise session, mice were euthanized, their EWAT pads were collected, and tissue homogenates were prepared. Arrow indicates UCP1 protein. Smac/DIABLO (second mitochondria derived activator of caspases/direct inhibitor of apoptosis) binding protein with low pI (isoelectric point) was used as loading control. Representative Western blots of EWAT homogenates (∼20 μg/lane) and BAT homogenates (∼2 μg/lane) from 3 experiments are shown in each panel. D, Western blots from 2–4 experiments (2–4 animals per condition in each experiment) were quantified by densitometry and expressed as means ± SEM and normalized to WT (left panel) or vehicle-treated control group (V; right panel) set as 1. Left panel, *, P ≤ .05 vs WT; †, P ≤ .05 vs PDE3B KO. Right panel, *, P ≤ .05 vs V; †, P ≤ .05 vs cilostamide (CIL). E, Tissue UCP1 expression (magnification, ×400). C57 WT and PDE3B KO mice were sc injected with 1 mg/kg of CL316243 in PBS or with PBS alone. EWAT pads were collected 24 hours after injections, fixed in formalin overnight, embedded in paraffin, cut, and immunostained with UCP1 primary antibody (ab10983; Abcam, Cambridge, Massachusetts) and Dylight 488-conjugated affipure donkey antirabbit secondary antibody (Jackson ImmunoResearch Laboratories, West Grove, Pennsylvania). Representative pictures of 3 mice per condition are shown.
On the other hand, factor 4E binding protein 1 (4E-BP1), the ablation of which induces UCP1 (53), and insulin receptor substrate 3 (IRS3), which promotes white adipogenesis (54), were decreased after β3-adrenergic stimulation. Phosphorylation of acetyl-CoA carboxylase (ACC), a critical lipogenic enzyme, was increased after the administration of CL316243, indicating that EWAT is geared toward fatty acid oxidation rather than synthesis (Figure 7, A and D). With regard to cilostamide-treated WT mice, EWAT protein expressions of UCP1, PPARδ, and PPARα were increased as compared with vehicle-treated mice, and the administration of CL316243 further elevated the levels of UCP1, as well as those of phosphorylated ACC (Figure 7, B and D). Protein expressions of Cidea, PPARα, 4E-BP1, and IRS3 were decreased after cilostamide and CL316243 treatment, mimicking the changes noted in PDE3B KO EWAT, with the exception of PPARα (Figure 7, B and D). In summary, C57 PDE3B KO EWAT displayed elevated levels of proteins associated with BAT recruitment, whereas CL316243 treatment caused a clear shift toward expression of some proteins related to BAT induction and fat burning.
Discussion
In this work, we attempted to dissect possible mechanisms of BAT recruitment in mouse WAT of PDE3B KO mice in C57BL/6 background. Taken together, our results indicate that acquisition of BAT characteristics by WAT in a specific genetic background may be more complex than previously expected, based on several reports describing certain factors as necessary and sufficient for brown adipogenesis (4, 20). As shown here, ablation of the cAMP-degrading PDE3B resulted in activation of several genes crucial for brown adipogenesis, eg, Cebpb, Bmp7, and Prdm16 (4, 20). It has previously been shown that BMP7 can activate a full program of brown adipogenesis at the level of mesenchymal progenitor cells, via activation of PRDM16, C/EBPs, PGC-1α, and UCP1 (4). Moreover, transgenic expression of PRDM16 under the adipocyte protein 2 (aP2) promoter was found to induce a broad set of BAT-selective genes in mouse WAT due to the activation of undifferentiated stromal vascular cells (6). However, in the case of PDE3B KO EWAT, although we detected increased expression of several BAT genes associated with PRDM16 overexpression, including Elovl3, otopetrin1, and Cidea (6), as well as elevated levels of Tpl2, an activator of p38 MAPK, which is involved in brown adipocyte maturation (39, 40), changes in EWAT morphology and physiology, although significant, were rather modest. This indicated that mesenchymal progenitor cells responsive to BMP7 and PRDM16 did not, perhaps, constitute a significant population in PDE3B KO EWAT or that their activation required some additional stimuli to induce functional brown adipocyte differentiation. This hypothesis is supported by a recent study showing that transgenic expression of PRDM16 in fat tissue robustly induces the development of brown-like adipocytes in subcutaneous, but not epididymal, adipose depots (18) as well as by an earlier study showing that chronic treatment of epididymally derived adipocyte cultures with PPARγ agonist promoted norepinephrine-augmentable UCP1 expression in a large subset of these cells, although no transcripts of Prdm16 were detected (7).
These data indicate that, in epididymal adipose tissue, the emergence of brown fat characteristics may not necessarily involve PRDM16 activity. Consistent with this idea, it has previously been shown that BAs induced in WAT during cold exposure (which increases cAMP) do not originate from common BAT/myogenic progenitors in which PRDM16 is a BAT switch (6, 7, 37). In addition, as discussed above, Lee et al (20) reported that chronic infusion of CL216343 induced BAs in EWAT that were derived via the proliferation and differentiation of PDFGRα-expressing progenitor cells. After their isolation from EWAT (or IWAT) stromal vascular fractions, the PDGFRα+ cells exhibited the potential to differentiate into white adipocytes or BAs. Incubation of PDGFRα+ cells with isoproterenol induced the expression of BA markers, including PGC1α, UCP1, and DIO2; BA induction did not require BMP7 (4) or PPARγ agonists (7).
Several genes associated with de novo brown adipogenesis were increased in PDE3B KO EWAT, as were Ptgs2 and Elovl3, which were found to be required for the induction/recruitment of BAT in WAT depots during cold exposure (29, 50, 51). However, even though overexpression of COX-2 (Ptgs2 gene product) in mouse WAT was previously shown to be sufficient for ectopic BAT development (29), only modest induction of BAT in PDE3B KO EWAT was observed prior to treatment with CL316243. Possibly, in the basal state, ie, without stimulation of WAT β-adrenergic receptors, the levels of PDE3B KO EWAT COX-2 were not high/active enough to induce the changes reported by others. Moreover, elevated levels of Rb1, which suppresses PPARγ and activates C/EBPα-mediated transcription, promoting WAT vs BAT differentiation (43), as well as Ncor and necdin, which also repress PPARγ-mediated gene transcription (4, 44), may have negatively contributed to the acquisition of BAT characteristics in EWAT of untreated PDE3B KO mice. The expression of these negative regulators of BAT differentiation was reduced by the treatment of PDE3B KO mice with CL316243.
The uniqueness of BAT lies in its UCP1-driven capability to create heat by uncoupling oxidation from ATP formation (57). PDE3B KO EWAT displayed an increased expression of a crucial Ucp1 activator, PGC1α, at the gene and protein level. Also, although gene expression of several other UCP1 activators, namely Foxc2 (58), Atf2 (41), and Lrp130 (38), as well as of Ucp1 itself was up-regulated in PDE3B KO EWAT (Figure 4, D and E), no substantial increase in immunoreactive UCP1 protein was observed in PDE3B KO EWAT prior to treatment with CL316243 (Figure 7). With regard to other aspects of mitochondrial function, the elevated levels of several genes and proteins related to mitochondrial biogenesis, thermogenesis, and fatty acid oxidation, such as Dio2, Cox4, Cpt2, Gyk, Cidea, and Pparα, as well as PGC1α and PPARδ, were demonstrated in PDE3B KO EWAT (Figure 4), but apparently they were not sufficient to effectively promote an increase in the oxygen consumption and fatty acid oxidation before the administration of CL316243 and raising the ambient temperature to 30°C (Figure 3).
Thus, in the EWAT of C57 PDE3B KO mice, the expression/activation of the BAT phenotype was associated with treatment with the β3-adrenergic agonist, CL316243. Administration of CL316243 was associated with significant changes in PDE3B KO EWAT morphology, such as decreased size of fat pads and adipocytes, increased tissue vascularization and mitochondrial activity and increased the expression of UCP1 as well as physiological function, including increased oxygen consumption, fatty acid oxidation, and 18F-FDG uptake, which together indicate active BAT recruitment in WAT (35). These characteristics were absent or much less pronounced in the EWAT of CL316243-treated WT mice. Therefore, we attempted to dissect the genes downstream of β3-adrenergic receptor activation, which might regulate these observed phenotypic changes in PDE3B KO EWAT. Somewhat unexpectedly, CL316243 treatment of C57 PDE3B KO mice caused a clear-cut decrease in the expression of most adipogenic genes related to both white and brown adipogenesis, with the exception of up-regulation of Cebpb, which is indispensable for BAT formation (36, 37), as well as Atf2 and Tpl2, which are activators of p38 MAPK and are associated with brown adipocyte maturation. These data further support, as discussed above, our hypothesis that de novo brown adipogenesis driven by BMP7 and PRDM16 might not be a major contributor to the BAT-like phenotype induced by CL316243 in C57 PDE3B KO EWAT.
With regard to other down-regulated BAT genes, such as Lrp130, it has previously been shown that, although Lrp130 is important for the induction of UCP1 during BAT differentiation, its depletion does not impact adipogenesis, mitochondrial biogenesis or the relative induction of UCP1 after cAMP activation (38). Also, the reduction of Cidea protein (Figure 6) might be beneficial with regard to energy expenditure [Cidea KO mice were resistant to diet induced obesity and diabetes, and Cidea was found to interact with UCP1 in mammalian cells and inhibit its uncoupling activity when coexpressed in yeast (60, 61)].
These observations are in agreement with data presented in this report, which show increased EWAT UCP1 protein as well as higher oxygen consumption and fatty acid oxidation in CL316243-treated PDE3B KO mice. Interestingly, 24-hour β3-adrenergic stimulation further increased the expression of Ptgs2 (COX-2) and Elovl3. It was previously shown that prolonged exposure of C57BL/6 WT mice to CL316243 resulted in an elevated expression of COX-2 along with a pronounced BAT-like phenotype in the EWAT of these mice (29). In the case of PDE3B KO mice (but not WT mice), a brief (24 h) exposure to CL316243 appeared sufficient to attain a similar phenotype, ie, elevated expression of COX-2, likely due to the initially impaired cAMP hydrolysis. The study by Vegiopoulos et al (29) has shown that differentiation of WAT stromal vascular cells with PGE2 or cPGI2 (products of COX-2 activity) induces expression of Ucp1 and Pgc1α, indicating that the progenitor cells are prostaglandin responsive and capable of expressing BAT genes. Thus, up-regulated COX-2 may constitute an important stimulus favoring acquisition of BAT-like phenotype in the EWAT of PDE3B KO mice. In addition, CL316243-induced down-regulation of necdin and Ncor1, which block adipogenesis (4, 44), as well as of all tested WAT genes, including Rb1, Rip140, and p107, most likely diminished the suppressive effects of these genes on the brown adipogenic program and also played an important role in the induction of the observed phenotypic changes in PDE3B KO EWAT.
Regarding the recently described EWAT population of beige adipocytes, which acquire BAT-like characteristics after stimulation with cAMP (7, 8), we could not confirm its role in our system. Beige marker gene expression in PDE3B KO EWAT after CL316243 treatment was not up-regulated as compared with either WT EWAT or PDE3B KO EWAT after treatment with PBS (data not shown). Results demonstrated in EWAT of PDE3B KO mice were confirmed by the combined administration of the PDE3B inhibitor, cilostamide, and CL316243 in WT mice.
Our data also indicate that EWAT, often thought to be quite refractory to browning, which readily occurs in sc WAT (8, 18, 50), can switch gears and assume a BAT-like phenotype when a key gene/group of genes is/are activated or disabled, and PDE3B seems to be one such key gene. In fact, others have reported that the ablation of specific genes causes EWAT to acquire BAT-like characteristics. Knockout of FSP27, a member of the Cide family proteins, which is localized to lipid droplets and promotes lipid storage in adipocytes (62, 63), led to a dramatic size reduction of EWAT pads and adipocyte lipid droplets along with elevated expression of BAT genes, including Pgc1α, Ppar, and Foxc2 as well as increased mitochondrial size and activity. FSP27 KO mice exhibited increased insulin sensitivity and energy expenditure and less weight gain on a high-fat diet (22). Also, knockout of a critical macroautophagy gene, ATG7, resulted in smaller EWAT pads showing characteristics of BAT (small adipocytes containing multilocular lipid droplets, larger organelles, and more mitochondria) and expressing high levels of Ucp1, Pgc1a, and other mitochondrial genes. ATG7 KO mice displayed lean body mass and increased insulin sensitivity on a high-fat diet (23). Furthermore, maternal perinatal undernutrition in rats induced a BAT-like phenotype in the EWAT of their offspring, including smaller adipocytes with multilocular lipid droplets and elevated levels of UCP1 (64). The investigators speculated that this perinatal white/brown transformation, which was readily reversible upon exposure to a normal diet, was important for postnatal survival because insufficient energy intake was redirected toward nonshivering thermogenesis to prevent hypothermia and to ensure effective adaptation to the extrauterine environment (64).
Taken together, our data suggest that an increase in cAMP in C57BL/6 mice caused by ablation (or inhibition) of PDE3B and administration of β3-receptor agonist CL316243 promotes differentiation of prostaglandin-responsive progenitor cells residing in EWAT stromal vascular fraction into functional brown adipocytes rather than de novo brown adipogenesis driven by BMP7 and PRDM16. However, another possibility, not thoroughly explored in this study, would be direct transdifferentiation of mature white adipocytes present in PDE3B KO EWAT into brown fat cells. The phenomenon of WAT vs BAT transdifferentiation is based on studies showing the actual presence of intermediate (beige or brite) adipocytes displaying mixed white/brown characteristics in mouse WAT as well as on the observation that, after cold acclimatization, the number of new brown adipocytes emerging in WAT matched the amount of lost white adipocytes (2).
In conclusion, as tempting as the possibility of treating obesity by reduction of excessive WAT via gearing the culprit tissue to fat burning instead of storage may seem, the problem requires further investigation, as one-factor solutions, eg, BMP7 or PRDM16 overexpression, as previously suggested, may not prove always successful. In addition, the individual's genotype will undoubtedly play a critical role in the responses to these factors.
Acknowledgments
We greatly appreciate the assistance we received from the staff of National Heart, Lung, and Blood Institute Genomics, Pathology, and Light Microscopy Core Facilities and the National Institute of Biomedical Imaging and Bioengineering.
This work was supported by the National Heart, Lung, and Blood Institute (to E.G., S.H., Y.W.C., F.A., N.R., Y.Y., S.L., Z.X.Y., V.M.), the National Institute of Diabetes and Digestive and Kidney Diseases (to O.G.), the National Institute of Biomedical Imaging and Bioengineering Intramural Research Programs (to G.N., X.C.), and the Swedish Research Council Project 3362 (to E.D.).
Disclosure Summary: The authors have nothing to disclose.
Footnotes
- Atf2
- activating transcription factor 2
- ATG7
- autophagy-related 7
- BA
- brown adipocyte
- BAT
- brown adipose tissue
- Bmp7
- bone morphogenetic protein 7
- Cebpb
- CCAAT/enhancer-binding protein-β
- Cidea
- cell death-inducing DNA fragmentation factor-α-like effector A
- COX
- cyclooxygenase
- Cox4
- subunit IV of cytochrome c oxidase
- Cpt2
- carnitine palmitoyltransferase 2
- Dio2
- type II iodothyronine deiodinase
- DMSO
- dimethylsulfoxide
- Elovl3
- elongation of very long-chain fatty acids 3
- EWAT
- epididymal WAT
- 18F-FDG
- 18F-fluorodeoxyglucose
- Foxc2
- forkhead box C2
- FSP27
- fat-specific protein 27
- Grem2
- gremlin 2
- Gyk
- glycerokinase
- IRS3
- insulin receptor substrate 3
- IWAT
- inguinal WAT
- KO
- knockout
- Lrp130
- leucine-rich protein 130
- MyoD
- myogenin D
- Ncor
- nuclear receptor corepressor
- PDE
- phosphodiesterase
- PDE3B
- PDE type 3B
- PDGFR
- platelet-derived growth factor receptor
- PGC1α
- PPAR-γ coactivator 1α
- PPARγ
- peroxisome proliferator-activated receptor-γ
- Prdm16
- PR domain containing 16
- qRT-PCR
- quantitative RT-PCR
- Rb1
- retinoblastoma 1
- RER
- respiratory exchange ratio
- Rip140
- receptor-interacting protein 140
- Sirt
- sirtuin
- Tpl2
- tumor progression locus 2
- UCP1
- uncoupling protein 1
- WAT
- white adipose tissue
- WT
- wild type.
References
- 1. Reitman ML. Metabolic lessons from genetically lean mice. Annu Rev Nutr. 2002;22:459–482 [DOI] [PubMed] [Google Scholar]
- 2. Cinti S. Transdifferentiation properties of adipocytes in the adipose organ. Am J Physiol Endocrinol Metab. 2009;297(5):E977–E986 [DOI] [PubMed] [Google Scholar]
- 3. Kajimura S, Seale P, Kubota K, et al. Initiation of myoblast to brown fat switch by a PRDM16-C/EBP-β transcriptional complex. Nature. 2009;460:1154–1158 [DOI] [PMC free article] [PubMed] [Google Scholar]
- 4. Tseng YH, Kokkotou E, Schulz TJ, et al. New role of bone morphogenetic protein 7 in brown adipogenesis and energy expenditure. Nature. 2008;454:1000–1004 [DOI] [PMC free article] [PubMed] [Google Scholar]
- 5. Richard D, Carpentier AC, Dore G, Ouellet V, Picard F. Determinants of brown adipocyte development and thermogenesis. Int J Obes 2005;34(suppl 2):S59–S66 [DOI] [PubMed] [Google Scholar]
- 6. Seale P, Kajimura S, Yang W, et al. Transcriptional control of brown fat determination by PRDM16. Cell Metab. 2007;6:38–54 [DOI] [PMC free article] [PubMed] [Google Scholar]
- 7. Petrovic N, Walden TB, Shabalina IG, Timmons JA, Cannon B, Nedergaard J. Chronic peroxisome proliferator-activated receptor γ (PPARγ) activation of epididymally derived white adipocyte cultures reveals a population of thermogenically competent, UCP1-containing adipocytes molecularly distinct from classic brown adipocytes. J Biol Chem. 2010;285:7153–7164 [DOI] [PMC free article] [PubMed] [Google Scholar]
- 8. Wu J, Bostrom P, Sparks LM, et al. Beige adipocytes are a distinct type of thermogenic fat cell in mouse and human. Cell. 2012;150:366–376 [DOI] [PMC free article] [PubMed] [Google Scholar]
- 9. Conti M, Beavo J. Biochemistry and physiology of cyclic nucleotide phosphodiesterases: essential components in cyclic nucleotide signaling. Annu Rev Biochem. 2007;76:481–511 [DOI] [PubMed] [Google Scholar]
- 10. Degerman E, Ahmad F, Chung YW, et al. From PDE3B to the regulation of energy homeostasis. Curr Opin Pharmacol. 2011;11:676–682 [DOI] [PMC free article] [PubMed] [Google Scholar]
- 11. Cannon B, Nedergaard J. Developmental biology: neither fat nor flesh. Nature. 2008;454:947–948 [DOI] [PubMed] [Google Scholar]
- 12. Collins S, Cao W, Robidoux J. Learning new tricks from old dogs: β-adrenergic receptors teach new lessons on firing up adipose tissue metabolism. Mol Endocrinol. 2004;18:2123–2131 [DOI] [PubMed] [Google Scholar]
- 13. Cypess AM, Lehman S, Williams G, et al. Identification and importance of brown adipose tissue in adult humans. N Engl J Med. 2009;360:1509–1517 [DOI] [PMC free article] [PubMed] [Google Scholar]
- 14. van Marken Lichtenbelt WD, Vanhommerig JW, et al. Cold-activated brown adipose tissue in healthy men. N Engl J Med. 2009;360:1500–1508 [DOI] [PubMed] [Google Scholar]
- 15. Virtanen KA, Lidell ME, Orava J, et al. Functional brown adipose tissue in healthy adults. N Engl J Med. 2009;360:1518–1525 [DOI] [PubMed] [Google Scholar]
- 16. Thompson PE, Manganiello V, Degerman E. Re-discovering PDE3 inhibitors—new opportunities for a long neglected target. Curr Top Med Chem. 2007;7:421–436 [DOI] [PubMed] [Google Scholar]
- 17. Lim S, Honek J, Xue Y, et al. Cold-induced activation of brown adipose tissue and adipose angiogenesis in mice. Nat Protoc. 2012;7:606–615 [DOI] [PubMed] [Google Scholar]
- 18. Seale P, Conroe HM, Estall J, et al. Prdm16 determines the thermogenic program of subcutaneous white adipose tissue in mice. J Clin Invest. 2011;121:96–105 [DOI] [PMC free article] [PubMed] [Google Scholar]
- 19. Vernochet C, Peres SB, Davis KE, et al. C/EBPα and the corepressors CtBP1 and CtBP2 regulate repression of select visceral white adipose genes during induction of the brown phenotype in white adipocytes by peroxisome proliferator-activated receptor γ agonists. Mol Cell Biol. 2009;29:4714–4728 [DOI] [PMC free article] [PubMed] [Google Scholar]
- 20. Lee YH, Petkova AP, Mottillo EP, Granneman JG. In vivo identification of bipotential adipocyte progenitors recruited by β3-adrenoceptor activation and high-fat feeding. Cell Metab. 2012;15:480–491 [DOI] [PMC free article] [PubMed] [Google Scholar]
- 21. Yoshitomi H, Yamazaki K, Abe S, Tanaka I. Differential regulation of mouse uncoupling proteins among brown adipose tissue, white adipose tissue, and skeletal muscle in chronic β3 adrenergic receptor agonist treatment. Biochem Biophys Res Commun. 1998;253:85–91 [DOI] [PubMed] [Google Scholar]
- 22. Toh SY, Gong J, Du G, et al. Up-regulation of mitochondrial activity and acquirement of brown adipose tissue-like property in the white adipose tissue of fsp27 deficient mice. PLoS One. 2008;3:e2890. [DOI] [PMC free article] [PubMed] [Google Scholar]
- 23. Singh R, Xiang Y, Wang Y, et al. Autophagy regulates adipose mass and differentiation in mice. J Clin Invest. 2009;119:3329–3339 [DOI] [PMC free article] [PubMed] [Google Scholar]
- 24. Fontana L, Eagon JC, Trujillo ME, Scherer PE, Klein S. Visceral fat adipokine secretion is associated with systemic inflammation in obese humans. Diabetes. 2007;56:1010–1013 [DOI] [PubMed] [Google Scholar]
- 25. Kannel WB, Cupples LA, Ramaswami R, Stokes J, 3rd, Kreger BE, Higgins M. Regional obesity and risk of cardiovascular disease: the Framingham Study. J Clin Epidemiol. 1991;44:183–190 [DOI] [PubMed] [Google Scholar]
- 26. Miyazaki Y, Glass L, Triplitt C, Wajcberg E, Mandarino LJ, DeFronzo RA. Abdominal fat distribution and peripheral and hepatic insulin resistance in type 2 diabetes mellitus. Am J Physiol Endocrinol Metab. 2002;283:E1135–E1143 [DOI] [PubMed] [Google Scholar]
- 27. Torres-Leal FL, Fonseca-Alaniz MH, Rogero MM, Tirapegui J. The role of inflamed adipose tissue in the insulin resistance. Cell Biochem Funct. 2010;28:623–631 [DOI] [PubMed] [Google Scholar]
- 28. Yang YK, Chen M, Clements RH, Abrams GA, Aprahamian CJ, Harmon CM. Human mesenteric adipose tissue plays unique role versus subcutaneous and omental fat in obesity related diabetes. Cell Physiol Biochem. 2008;22:531–538 [DOI] [PubMed] [Google Scholar]
- 29. Vegiopoulos A, Muller-Decker K, Strzoda D, et al. Cyclooxygenase-2 controls energy homeostasis in mice by de novo recruitment of brown adipocytes. Science. 2010;328:1158–1161 [DOI] [PubMed] [Google Scholar]
- 30. Choi YH, Park S, Hockman S, et al. Alterations in regulation of energy homeostasis in cyclic nucleotide phosphodiesterase 3B-null mice. J Clin Invest. 2006;116:3240–3251 [DOI] [PMC free article] [PubMed] [Google Scholar]
- 31. Shakoori A, Mai W, Miyashita K, et al. Inhibition of GSK-3 β activity attenuates proliferation of human colon cancer cells in rodents. Cancer Sci. 2007;98:1388–1393 [DOI] [PMC free article] [PubMed] [Google Scholar]
- 32. Fewell JG, Osinska H, Klevitsky R, et al. A treadmill exercise regimen for identifying cardiovascular phenotypes in transgenic mice. Am J Physiol. 1997;273:H1595–H1605 [DOI] [PubMed] [Google Scholar]
- 33. Arch JR, Ainsworth AT, Ellis RD, et al. Treatment of obesity with thermogenic β-adrenoceptor agonists: studies on BRL 26830A in rodents. Int J Obes. 1984;1(suppl 8):1–11 [PubMed] [Google Scholar]
- 34. Rohlfs EM, Daniel KW, Premont RT, Kozak LP, Collins S. Regulation of the uncoupling protein gene (Ucp) by β1, β2, and β3-adrenergic receptor subtypes in immortalized brown adipose cell lines. J Biol Chem. 1995;270:10723–10732 [DOI] [PubMed] [Google Scholar]
- 35. Hany TF, Gharehpapagh E, Kamel EM, Buck A, Himms-Hagen J, von Schulthess GK. Brown adipose tissue: a factor to consider in symmetrical tracer uptake in the neck and upper chest region. Eur J Nucl Med Mol Imaging. 2002;29:1393–1398 [DOI] [PubMed] [Google Scholar]
- 36. Farmer SR. Transcriptional control of adipocyte formation. Cell Metab. 2006;4:263–273 [DOI] [PMC free article] [PubMed] [Google Scholar]
- 37. Kajimura S, Seale P, Tomaru T, et al. Regulation of the brown and white fat gene programs through a PRDM16/CtBP transcriptional complex. Genes Dev. 2008;22:1397–1409 [DOI] [PMC free article] [PubMed] [Google Scholar]
- 38. Cooper MP, Uldry M, Kajimura S, Arany Z, Spiegelman BM. Modulation of PGC-1 coactivator pathways in brown fat differentiation through LRP130. J Biol Chem. 2008;283:31960–31967 [DOI] [PMC free article] [PubMed] [Google Scholar]
- 39. Chiariello M, Marinissen MJ, Gutkind JS. Multiple mitogen-activated protein kinase signaling pathways connect the cot oncoprotein to the c-jun promoter and to cellular transformation. Mol Cell Biol. 2000;20:1747–1758 [DOI] [PMC free article] [PubMed] [Google Scholar]
- 40. Fruhbeck G, Sesma P, Burrell MA. PRDM16: the interconvertible adipo-myocyte switch. Trends Cell Biol. 2009;19:141–146 [DOI] [PubMed] [Google Scholar]
- 41. Cao W, Daniel KW, Robidoux J, et al. p38 mitogen-activated protein kinase is the central regulator of cyclic AMP-dependent transcription of the brown fat uncoupling protein 1 gene. Mol Cell Biol. 2004;24:3057–3067 [DOI] [PMC free article] [PubMed] [Google Scholar]
- 42. Lidell ME, Seifert EL, Westergren R, et al. The adipocyte-expressed forkhead transcription factor Foxc2 regulates metabolism through altered mitochondrial function. Diabetes. 2011;60:427–435 [DOI] [PMC free article] [PubMed] [Google Scholar]
- 43. Hansen JB, Jorgensen C, Petersen RK, et al. Retinoblastoma protein functions as a molecular switch determining white versus brown adipocyte differentiation. Proc Natl Acad Sci USA. 2004;101:4112–4117 [DOI] [PMC free article] [PubMed] [Google Scholar]
- 44. Yu C, Markan K, Temple KA, Deplewski D, Brady MJ, Cohen RN. The nuclear receptor corepressors NCoR and SMRT decrease peroxisome proliferator-activated receptor γ transcriptional activity and repress 3T3-L1 adipogenesis. J Biol Chem. 2005;280:13600–13605 [DOI] [PubMed] [Google Scholar]
- 45. Tang QQ, Otto TC, Lane MD. Commitment of C3H10T1/2 pluripotent stem cells to the adipocyte lineage. Proc Natl Acad Sci USA. 2004;101:9607–9611 [DOI] [PMC free article] [PubMed] [Google Scholar]
- 46. Fritah A, Christian M, Parker MG. The metabolic coregulator RIP140: an update. Am J Physiol Endocrinol Metab. 2010;299:E335–E340 [DOI] [PubMed] [Google Scholar]
- 47. Laharrague P, Casteilla L. The emergence of adipocytes. Endocr Dev. 2010;19:21–30 [DOI] [PubMed] [Google Scholar]
- 48. Im J, Kim H, Kim S, Jho EH. Wnt/β-catenin signaling regulates expression of PRDC, an antagonist of the BMP-4 signaling pathway. Biochem Biophys Res Commun. 2007;354:296–301 [DOI] [PubMed] [Google Scholar]
- 49. Wu Z, Puigserver P, Spiegelman BM. Transcriptional activation of adipogenesis. Curr Opin Cell Biol. 1999;11:689–694 [DOI] [PubMed] [Google Scholar]
- 50. Madsen L, Pedersen LM, Lillefosse HH, et al. UCP1 induction during recruitment of brown adipocytes in white adipose tissue is dependent on cyclooxygenase activity. PLoS One. 2010;5:e11391. [DOI] [PMC free article] [PubMed] [Google Scholar]
- 51. Westerberg R, Mansson JE, Golozoubova V, et al. ELOVL3 is an important component for early onset of lipid recruitment in brown adipose tissue. J Biol Chem. 2006;281:4958–4968 [DOI] [PubMed] [Google Scholar]
- 52. Wolf G. The function of the nuclear receptor peroxisome proliferator-activated receptor δ in energy homeostasis. Nutr Rev. 2003;61:387–390 [DOI] [PubMed] [Google Scholar]
- 53. Tsukiyama-Kohara K, Poulin F, Kohara M, et al. Adipose tissue reduction in mice lacking the translational inhibitor 4E-BP1. Nat Med. 2001;7:1128–1132 [DOI] [PubMed] [Google Scholar]
- 54. Laustsen PG, Michael MD, Crute BE, et al. Lipoatrophic diabetes in Irs1(−/−)/Irs3(−/−) double knockout mice. Genes Dev. 2002;16:3213–3222 [DOI] [PMC free article] [PubMed] [Google Scholar]
- 55. Hondares E, Pineda-Torra I, Iglesias R, Staels B, Villarroya F, Giralt M. PPARδ, but not PPARα, activates PGC-1α gene transcription in muscle. Biochem Biophys Res Commun. 2007;354:1021–1027 [DOI] [PubMed] [Google Scholar]
- 56. Bonnefont JP, Demaugre F, Prip-Buus C, et al. Carnitine palmitoyltransferase deficiencies. Mol Genet Metab. 1999;68:424–440 [DOI] [PubMed] [Google Scholar]
- 57. Nicholls DG, Bernson VS, Heaton GM. The identification of the component in the inner membrane of brown adipose tissue mitochondria responsible for regulating energy dissipation. Experientia Suppl. 1978;32:89–93 [DOI] [PubMed] [Google Scholar]
- 58. Cederberg A, Gronning LM, Ahren B, Tasken K, Carlsson P, Enerback S. FOXC2 is a winged helix gene that counteracts obesity, hypertriglyceridemia, and diet-induced insulin resistance. Cell. 2001;106:563–573 [DOI] [PubMed] [Google Scholar]
- 59. Rahib L, MacLennan NK, Horvath S, Liao JC, Dipple KM. Glycerol kinase deficiency alters expression of genes involved in lipid metabolism, carbohydrate metabolism, and insulin signaling. Eur J Hum Genet. 2007;15:646–657 [DOI] [PubMed] [Google Scholar]
- 60. Lin SC, Li P. CIDE-A, a novel link between brown adipose tissue and obesity. Trends Mol Med. 2004;10:434–439 [DOI] [PubMed] [Google Scholar]
- 61. Zhou Z, Yon Toh S, Chen Z, et al. Cidea-deficient mice have lean phenotype and are resistant to obesity. Nat Genet. 2003;35:49–56 [DOI] [PubMed] [Google Scholar]
- 62. Brasaemle DL, Dolios G, Shapiro L, Wang R. Proteomic analysis of proteins associated with lipid droplets of basal and lipolytically stimulated 3T3-L1 adipocytes. J Biol Chem. 2004;279:46835–46842 [DOI] [PubMed] [Google Scholar]
- 63. Puri V, Konda S, Ranjit S, et al. Fat-specific protein 27, a novel lipid droplet protein that enhances triglyceride storage. J Biol Chem. 2007;282:34213–34218 [DOI] [PubMed] [Google Scholar]
- 64. Delahaye F, Lukaszewski MA, Wattez JS, et al. Maternal perinatal undernutrition programs a “brown-like” phenotype of gonadal white fat in male rat at weaning. Am J Physiol Regul Integr Comp Physiol. 2010;299:R101–R110 [DOI] [PubMed] [Google Scholar]
- 65. Farmer SR. Regulation of PPARγ activity during adipogenesis. Int J Obes (Lond) 29 Suppl. 2005;1:S13–S16 [DOI] [PubMed] [Google Scholar]
- 66. Picard F, Kurtev M, Chung N, Topark-Ngarm A, et al. Sirt1 promotes fat mobilization in white adipocytes by repressing PPAR-γ. Nature. 2004;429:771–776 [DOI] [PMC free article] [PubMed] [Google Scholar]
- 67. Wu Z, Woodring PJ, Bhakta KS, Tamura K, et al. p38 and extracellular signal-regulated kinases regulate the myogenic program at multiple steps. Mol Cell Biol. 2000;20:3951–3964 [DOI] [PMC free article] [PubMed] [Google Scholar]
- 68. Fulco M, Schiltz RL, Iezzi S, et al. Sir2 regulates skeletal muscle differentiation as a potential sensor of the redox state. Mol Cell. 2003;12:51–62 [DOI] [PubMed] [Google Scholar]
- 69. Wolf G. Insulin resistance and obesity: resistin, a hormone secreted by adipose tissue. Nutr Rev. 2004;62:389–394 [DOI] [PubMed] [Google Scholar]
- 70. Davis KE, Moldes M, Farmer SR. The forkhead transcription factor FoxC2 inhibits white adipocyte differentiation. J Biol Chem. 2004;279:42453–42461 [DOI] [PubMed] [Google Scholar]
- 71. Lee MY, Kong HJ, Cheong J. Regulation of activating transcription factor-2 in early stage of the adipocyte differentiation program. Biochem Biophys Res Commun. 2001;281:1241–1247 [DOI] [PubMed] [Google Scholar]
- 72. Shi T, Wang F, Stieren E, Tong Q. SIRT3, a mitochondrial sirtuin deacetylase, regulates mitochondrial function and thermogenesis in brown adipocytes. J Biol Chem. 2005;280:13560–13567 [DOI] [PubMed] [Google Scholar]
- 73. Zadravec D, Brolinson A, Fisher RM, et al. Ablation of the very-long-chain fatty acid elongase ELOVL3 in mice leads to constrained lipid storage and resistance to diet-induced obesity. FASEB J. 2010;24:4366–4377 [DOI] [PubMed] [Google Scholar]
- 74. Puigserver P. Tissue-specific regulation of metabolic pathways through the transcriptional coactivator PGC1-α. Int J Obes (Lond). 2005;29(suppl 1):S5–S9 [DOI] [PubMed] [Google Scholar]
- 75. Zeviani M, Nakagawa M, Herbert J, et al. Isolation of a cDNA clone encoding subunit IV of human cytochrome c oxidase. Gene. 1987;55:205–217 [DOI] [PubMed] [Google Scholar]
- 76. Nicholls DG, Bernson VS. Inter-relationships between proton electrochemical gradient, adenine-nucleotide phosphorylation potential and respiration, during substrate-level and oxidative phosphorylation by mitochondria from brown adipose tissue of cold-adapted guinea-pigs. Eur J Biochem. 1977;75:601–612 [DOI] [PubMed] [Google Scholar]
- 77. Bianco AC. Minireview: cracking the metabolic code for thyroid hormone signaling. Endocrinology. 2011;152:3306–3311 [DOI] [PMC free article] [PubMed] [Google Scholar]