Abstract
MALDI imaging mass spectrometry (MALDI-IMS) has become a powerful tool for localizing both small molecules and intact proteins in a wide variety of tissue samples in both normal and diseased states. Identification of imaged signals in MALDI-IMS remains a bottleneck in the analysis and limits the interpretation of underlying biology of tissue specimens. In this work, spatially-directed tissue microextraction of intact proteins followed by LC-MS/MS with electron transfer dissociation (ETD) was used to identify proteins from specific locations in three tissue types; ocular lens, brain, and kidney. Detection limits were such that a 1 microliter extraction volume was sufficient to deliver proteins to the LC-MS/MS instrumentation with sufficient sensitivity to detect 50–100 proteins in a single experiment. Additionally, multiple modified proteins were identified; including truncated lens proteins that would be difficult to assign to an imaged mass using a bottom-up approach. Protein separation and identification are expected to improve with advances in intact protein fractionation/chromatography and advances in interpretation algorithms leading to increased depth of proteome coverage from distinct tissue locations.
Introduction
MALDI tissue profiling and imaging mass spectrometry (MALDI-IMS) have become powerful tools for characterizing and localizing molecular signatures of disease (1). From a single profiling or imaging experiment, hundreds of analyte signals, either small molecules, peptides, or proteins, are detected and their relative abundances are mapped to specific locations on the tissue section. The signal intensities and distributions are then utilized to detect differences between normal and diseased tissues with the potential to achieve single cell resolution (2). For diagnostic purposes, knowing the identities of the differentiating signals or biomarkers is not a necessity; however, in order to understand the underlying pathobiology identification of these signals is crucial. Moreover, analyte or putative target identification from interrogated tissue sections is essential to inform therapeutic development. Unfortunately, identification of analyte signals from tissue sections, particularly for intact protein analytes, is a challenging and laborious task.
Protein identification following MALDI-IMS experiments is typically accomplished by tissue homogenization from pieces of tissue, protein fractionation, digestion, and bottom-up proteomics methods (3, 4). This approach is useful if a nearly homogeneous tissue fraction is examined; however, detailed spatial information is lost upon homogenization. Moreover, this workflow is not only time consuming, but suffers from the frequent inability to match bottom-up peptide identifications with intact masses detected by MALDI-IMS. This is a particularly important issue for identification of modified proteins. Thus, confidence in the identification of imaged signals can be limited. Additionally, the standard proteomics workflow suffers from a lack of sensitivity if small areas of tissue or single cell types are being analyzed. These limitations are real, practical limitations to evolving MALDI-IMS beyond a detection tool into a tool that leads to biological understanding. Alternative approaches have been reported, for example, laser capture microdissection (LCM) followed by bottom-up proteomics has been employed to detect differences in isolated tissue regions (3, 5). On-tissue enzymatic digestion followed by MALDI tandem mass spectrometry is also commonly attempted for protein identification (6). Again, matching peptide identifications to intact protein signals from MALDI-IMS experiments can be challenging. In addition, MALDI TOF-TOF methods have been developed for intact protein identification, but this approach is limited in sensitivity and in mass range (7). Recently, this approach has been implemented to identify proteins from MALDI-IMS experiments (8); however, this approach relies on tissue homogenization, a process in which spatial resolution is lost.
Recent advances in surface sampling via liquid microjunctions (9, 10) or liquid bridges (11, 12) suggest that direct extraction of tissue analytes followed by electrospray ionization provides a means for not only analyte detection, but also as a means for analyte identification. Moreover, advances in top-down proteomics methodology (13, 14) and dissociation methods such as electron capture dissociation (ECD) (15).and electron transfer dissociation (ETD) (16) indicate that intact proteins can be fragmented and identified. Using this top-down approach, a substantial number of proteins can be detected in a single LC-MS/MS experiment (17–19). A recent report shows that top-down proteomics methods combined with surface sampling methods allows identification of proteins from dried blood spots (20). In this report, we combine the ideas of direct surface sampling with spatial resolution and top-down proteomics using ETD to successfully identify proteins directly from imaged areas of tissue sections for three tissue types: ocular lens, brain, and kidney.
Materials and Methods
Tissue Sectioning and Matrix Deposition
Tissue sections, 20 µm thickness, from bovine ocular lens were methanol soft-landed onto a gold-coated target plate and vacuum desiccated. Dry sections were washed three times with acetonitrile:water (50:50) before returning to the vacuum dessicator. Sections were then spotted with 20 mg/mL of sinapinic acid matrix in acteonitrile:water:TFA (50:49.9:0.1) solvent using a Portrait 630 acoustic spotter (Labcyte Sunnyvale, CA.) with 20 passes of three droplets per pass at 300 µm spatial resolution. Tissue sections from mouse brain and kidney were taken at 12 µm thickness and thaw mounted onto ITO coated glass slides (Bruker Daltonics). After vacuum desiccation, sections were washed using 70% ethanol, 100% ethanol, Carnoy’s fluid (ethanol:chloroform:acetic acid, 6:3:1), followed by 100% ethanol, 0.2% TFA, and finally 100% ethanol for 30 seconds each (Carnoy’s fluid for 2 minutes). Samples were dried using a vacuum desiccator and 5 mg/mL sinapinic acid in acetonitrile:water:TFA (90:9.7:0.3) was applied using a TM-Sprayer (HTX Technologies) with a flow rate of 0.1 mL/min and a total of 8 passes at a temperature of 120 °C. A re-crystallization step was then performed by attaching the glass slide onto a steel plate using conductive copper tape on the inside of a petri dish lid (steel plate held in place by a magnet). The petri dish lid with sample was pre-heated in an 85°C oven for 2 min. One mL of water with 50 µL of TFA was pipetted onto filter paper in the bottom section of the petri dish before sealing the pre-heated lid with attached sample on top. After 2 min. the lid was removed and the section allowed to dry for 1 min. in the oven.
MALDI Imaging
Images were acquired using a Bruker Autoflex Speed III in positive linear mode at 300 µm spatial resolution with 500 shots per pixel for lens experiments and 70 µm spatial resolution and 100 shots per pixel for brain and kidney images, with a 1kHz Nd:YAG laser. Calibration was performed prior to acquisition using a protein standard mix (insulin, cytochrome C, apomyoglobin and trypsinogen). Internal Calibration was required for the brain imaging data due to mass drift. Using identified masses from LC-MS data from an adjacent section, mMass software (21) was utilized to calibrate the exported global spectrum from the imaging data to ensure confidence in the peak assignments and the best mass accuracy from the TOF data. Data were processed using FlexImaging 3.0 software (Bruker Daltonics).
Tissue Extraction
Adjacent tissue sections to those used for MALDI imaging were subjected to washes described above (no matrix applied) and used for protein identification. Proteins were extracted using a gel-loading pipette tip (Fisher Scientific 05-408-151) by placing a 1 µL droplet of extraction solvent consisting of 20% acetonitrile, 80% water (HPLC-grade) onto to the desired region of tissue. For each extraction, the droplet was first placed in contact with the tissue for 2 seconds, and the droplet was pipetted in and out of the gel loading tip 1–2 times in a specific tissue region. Extraction was performed while keeping the droplet in contact with both the tissue and pipet tip. The protein extract was then recovered for LC-MS/MS experiments. Tissue extracts from lens were taken from the outer nuclear region, from the midbrain region in mouse brain, and from midway between the cortex and medulla in kidney experiments.
HPLC-Tandem Mass Spectrometry
Extracts taken from tissue sections were pipetted directly into 3µL of the extraction solvent. Aliquots of 1–2µL, containing 25–50% of each tissue extract, were diluted 6-fold with 0.1% formic acid to reduce the organic composition in the solvent to 3% acetonitrile. For lens extract analysis, 1 µL (25%) of the tissue extract was used, and 2-µL aliquots (50%) of the kidney and brain extracts were analyzed by LC-MS/MS. The diluted protein extracts were loaded onto a reverse-phase capillary trap column using a helium-pressurized cell (pressure bomb). The trapping column (360µm × 150µm ID) was fritted with a filter end-fitting (IDEX Health & Science), and was packed with 5 cm of C8 material (15 µm material, 300Å Grace Vydac or 5µm, 300 Å YMC Co.). Once the sample was loaded, an M-520 microfilter union (IDEX Health & Science) was used to connect the trap column to an analytical column (360µm × 100µm ID, 8 cm or 20 cm of C8 stationary phase material), equipped with a laser-pulled emitter tip. Using an Eksigent NanoLC Ultra HPLC, peptides were gradient-eluted at a flow rate of 400 nL/min, and the mobile phase solvents consisted of 0.1% formic acid, 99.9% water (solvent A) and 0.1% formic acid, 99.9% acetonitrile (solvent B). The gradient consisted of 2–60 %B in 50 min, 60–90 %B in 10 min, 90 %B for 1 min, 90-2 %B in 1 min, and the column was equilibrated at 2 %B for 12 min. Upon gradient-elution, proteins were mass analyzed on a LTQ Velos mass spectrometer, equipped with a nanoelectrospray ionization source (Thermo Scientific). The instrument was operated using a data-dependent method or a combination method consisting of both data-dependent and targeted scan events. Dynamic exclusion was enabled allowing a repeat count of 4 within 15 s. For all LC-MS/MS analyses, full scan (m/z 360–2000) spectra were acquired as the initial scan event, and the seven or eight most abundant ions in each MS scan were selected for fragmentation in the LTQ. For electron transfer dissociation (ETD) of eluting protein species, an isolation width of 2.5 m/z and reaction times of 90–115 ms were used. The MSn AGC target value in the ion trap was set to 1e4, with a maximum injection time of 100 ms. The ETD reagent ion AGC target was 3e5 or 5e5 with a maximum inject time of 100 ms. For a subset of LC-MS/MS analyses, a data-dependent ETD/CID toggle method was used, where sequential ETD and CID spectra were acquired of the same protein precursors in back-to-back scan events. ETD and CID MS/MS spectra were interpreted manually with assistance by the TagIdent tool (http://web.expasy.org/tagident/).
Results
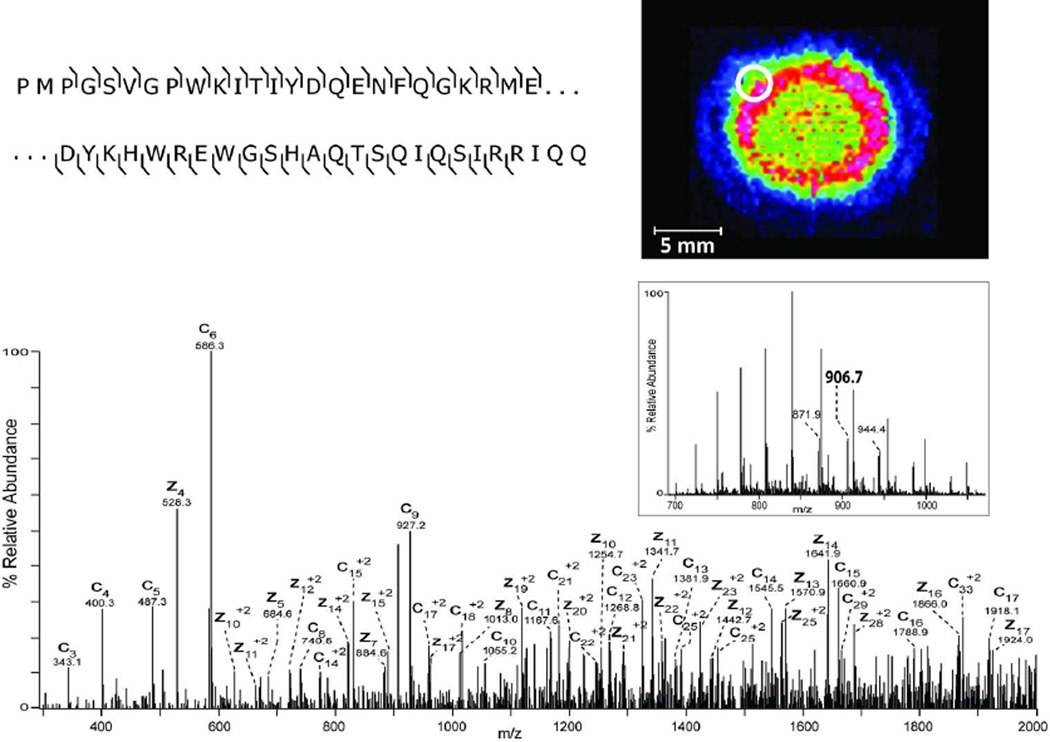
A low volume (1µL) extraction, covering an area of approximately 2 mm in diameter on a 20 micron thick bovine lens section, provided sufficient intact protein signals by nanoLC-MS to produce an intense base peak chromatogram (Figure 1A) and accurate molecular weight measurements of eluting species by nano-ESI (Figure 1B insert and Figure 1C insert). The microextraction was carried out in the outer nuclear region of this bovine lens section where multiple intact and truncated crystallins were observed by MALDI-IMS imaging. Figure 1B shows the MALDI image of a protein of molecular weight 20,969 Da that is in the mass range of multiple distinct gamma crystallin gene products. ETD tandem mass spectrometry of the precursor ion at m/z 807.5, [M+26H+]26+ (calculated MW 20,969 Da) provided a rich fragmentation pattern that allowed positive identification of this signal as gammaB crystallin (Figure 1B) having a predicted molecular weight of 20,966 Da. ETD produced extensive inter-residue cleavage at both the N- and C-termini of gammaB crystallin that provided interpretable sequence tags used to match with known lens crystallin sequences. While this spectrum is acquired with low resolution in a linear ion trap, a consecutive series of singly charged N-terminal c-ions was observed from c2–c14 that provided unambiguous evidence of a gamma crystallin sequence, whereas C-terminal z-ions defined the sequence as uniquely gammaB crystallin. Subsequently, nearly all of the remaining major signals in the ETD spectrum were assigned as multiply charged c- and z-ions confirming the assigned sequence as gammaB crystallin. The MALDI image of this protein shows a ring of high intensity in the lens inner cortex with decreased intensity toward the core suggesting age-related modification(22).
Figure 1.
A) LC-MS base peak chromatogram of tissue extracted lens proteins separated over a 100 µm diameter C8 analytical column. B) MALDI-IMS of m/z 20,969 in bovine lens (insert top) and ETD spectrum of the [M+26H]26+ precursor ion (m/z 807.5) identified as full-length gamma-B crystallin (uniprot accession P02526). The lower insert displays the ESI mass spectrum at 49 minutes. C) MALDI-IMS of m/z 22,639 in bovine lens (insert top) and ETD spectrum of the [M+25H]25+ precursor ion (m/z 906.7) identified as a truncated form of beta-A3 crystallin (residues 23–215) (uniprot accession P11843). The lower insert displays the ESI mass spectrum at 48 minutes.
A second ETD spectrum acquired from extracted and separated bovine lens proteins is shown in Figure 1C for the [M+25H+]25+ ion at m/z 906.7. Again, a series of singly charged c-ions was observed from c3–c17 (except c7) and provided a sequence tag that allowed unambiguous identification of this signal as truncated betaA3 crystallin (23–215). The extensive sequence coverage of the N-terminus of the truncated protein along with the nanoESI measured molecular weight of 22,642 Da (predicted 22,641 Da) provided high confidence in this assignment and demonstrates the capability of this approach to allow identification of posttranslationally modified proteins. Note that the absence of the c7 ion in the ETD spectrum is predicted due to the presence of a proline residue at position 30 in the full length sequence, i.e. position 7 in the truncated sequence. The MALDI image of this truncated crystallin indicates an outer nuclear localization (Figure 1C insert) and, with the positive identification, allows age-related lens betaA3 crystallin truncation to be localized. The lower intensity signal observed within the nucleus of the lens suggests this protein becomes further truncated or modified within the older tissue at the center of the lens.
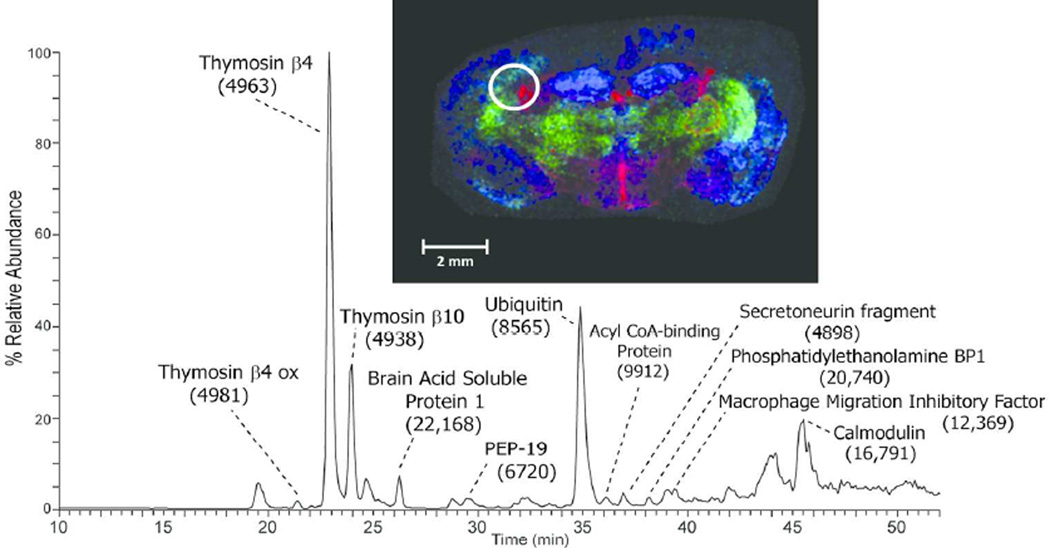
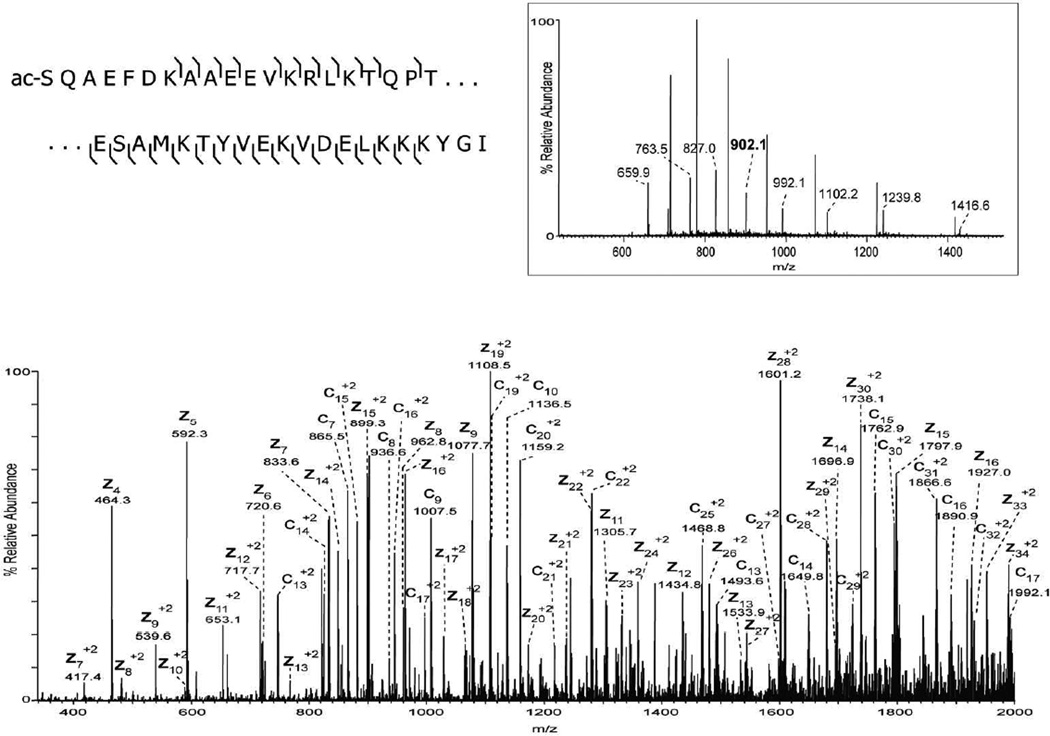
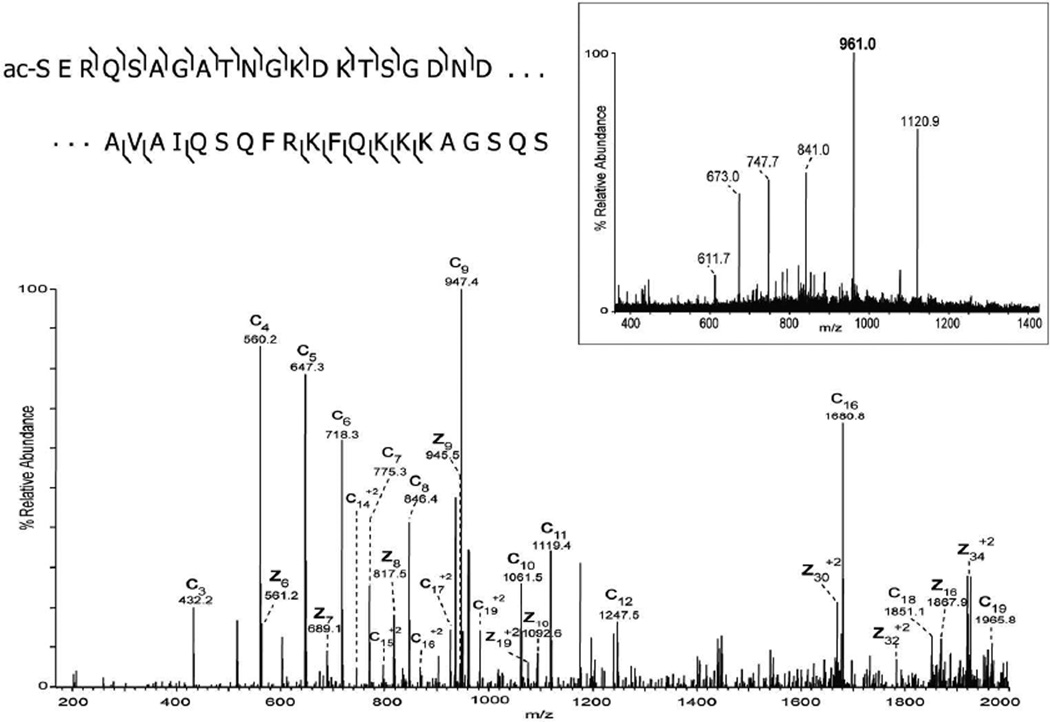
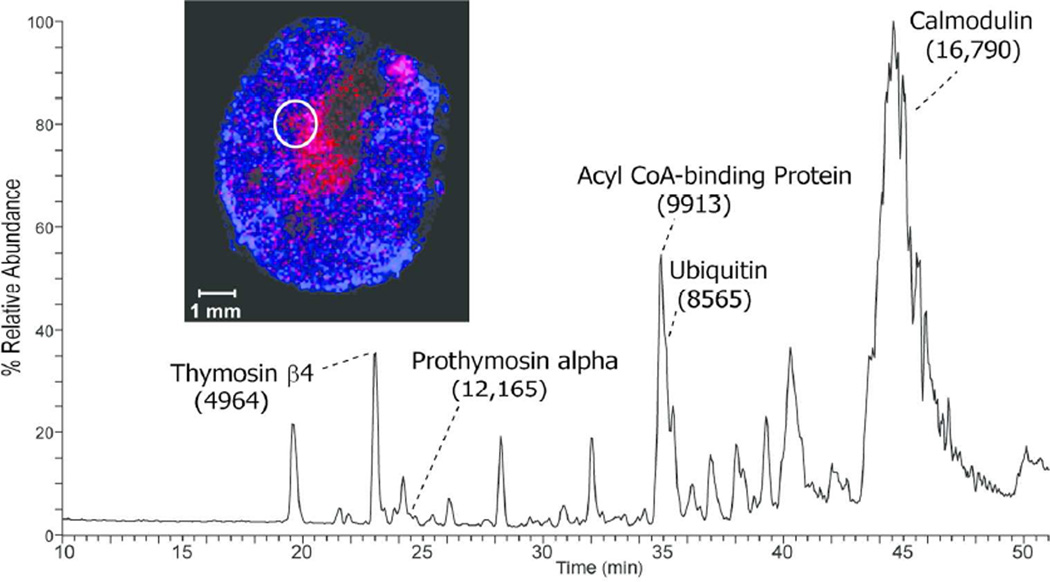
The extraction method was applied to additional tissue types including the mid-brain region of mouse brain. The extracted proteins resolved nicely on a C8 nanoLC column (Figure 2A) and multiple proteins were readily identified by ETD tandem mass spectrometry. The low abundance signal at m/z 902.1 [M+11H+]11+ ion, (MW 9912 Da) was selected, in the presence of a higher abundance co-eluting protein, for ETD and the resulting spectrum is shown in Figure 2B. The observed signal-to-noise ratio of product ions observed in the ETD spectrum was sufficient, along with the measured molecular weight and fragmentation pattern, to identify this protein as Acyl-CoA binding protein (predicted 9911 Da). A series of singly charged C-terminal z-ions allowed a short sequence tag to be obtained and to be searched against a mouse database using the TagIdent tool. Once the sequence tag was determined and the protein identified, the majority of product ions in the ETD spectrum could easily be assigned, providing nearly full coverage of the N- and C-terminus. The low abundance of the precursor ion signal is likely due to the fact that this protein is localized to very specific locations in the brain as demonstrated in the MALDI-IMS image (Figure 2A insert, red). Thus, the approximate 2-mm diameter extraction area produces abundant proteins from multiple brain regions. Nevertheless, sufficient sequence information is obtainable from a single extraction of the tissue section. A second, even lower abundance signal was selected at 29 minutes in the chromatogram at m/z 961.0, the [M+7H+]7+ ion of a protein with molecular weight 6719 Da (green signal in Figure 2A insert). Again, excellent signal was observed in the ETD MS/MS spectrum, and a series of singly charged c-ions allowed unambiguous identification of this protein as PEP-19 (predicted 6719 Da). A third signal is shown in the MALDI image from mouse brain corresponding to m/z 4963 (blue signal in Figure 2A insert). Manual interpretation of the ETD spectrum revealed its identity as thymosin β4 (supplemental figure 1). In total, manual interpretation of ETD spectra acquired in a single experiment revealed over 10 major brain proteins whose images can be readily obtained from MALDI-IMS (Table 1). More extensive examination of the 50–100 resolved protein ESI spectra, tandem mass spectra, and/or automated database searching algorithms will likely produce many more identifications from the LC-MS/MS data.
Figure 2.
A) LC-MS base peak chromatogram of intact proteins extracted from a 12 µm mouse brain section and MALDI image acquired from an adjacent section showing the distribution of signals at m/z 9910 (red), m/z 6719 (green), and m/z 4963 (blue). B) ETD spectrum of the [M+11H]11+ precursor ion (m/z 902.1) identified as Acyl CoA binding protein (uniprot accession P31786). C) ETD spectrum of the [M+7H]7+ precursor ion (m/z 961.0) identified as mouse PEP-19 (uniprot accession P63054).
Table 1.
Proteins Identified by Top-Down Proteomics of Mouse Brain Extracts
| Protein | Accession Number |
Predicted MW (Da) |
Measured MW (Da) |
|---|---|---|---|
| Thymosin β10 | Q6ZWY8 | 4937 | 4938 |
| Thymosin β4 | P20065 | 4964 | 4963 |
| Thymosin β4 oxidized | P20065 | 4980 | 4981 |
| Secretogranin-2 fragment (569–610) | Q03517 | 4898 | 4898 |
| PEP-19 | P63054 | 6718 | 6720 |
| Ubiquitin | P0CG50 | 8565 | 8565 |
| Acyl CoA Binding Protein | P31786 | 9911 | 9912 |
| Thioredoxin | P10639 | 11544 | 11540 |
| Macrophage migration inhibitory factor | P34884 | 12373 | 12369 |
| Calmodulin | P62204 | 16789 a | 16791 |
| Phosphatidylethanolamine binding protein 1 | P70296 | 20741 | 20740 |
| Brain acid soluble protein 1 | Q91XV3 | 22166 | 22168 |
mass calculated with the addition of a single calcium ion
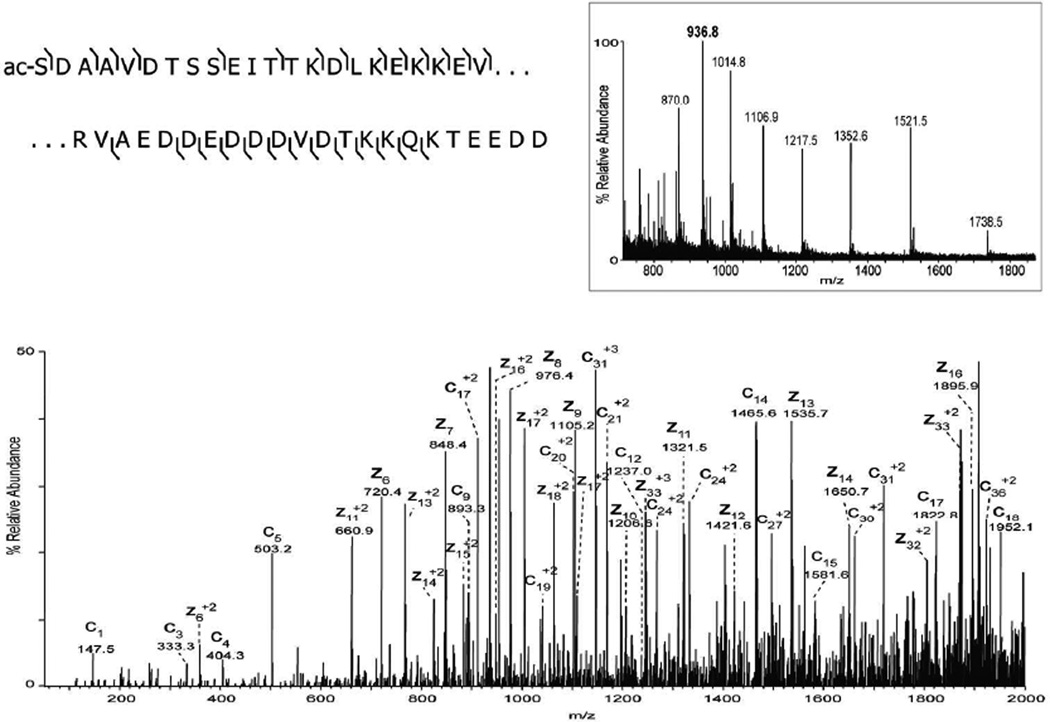
A third tissue sample, mouse kidney, was examined with the microextraction-ETD method. As was seen for brain and lens tissue, sufficient signals were obtained for molecular weight measurement and acquisition of sequence tags by ETD. Figure 3A displays the base peak chromatogram of extracted mouse kidney proteins and a MALDI image of two signals at m/z 12,169 and m/z 9913. The ETD spectrum for m/z 827.1, the [M+12H+]12+ ion for the 9913 Da protein (supplemental figure 2), indicates a similar singly charged z-ions series as shown above for Acyl-CoA binding protein from brain tissue and, indeed, the interpreted sequence confirms this assignment. The ETD spectrum for m/z 936.8, the [M+13H+]13+ ion for 12,165 Da protein, is shown in Figure 3B. The z6–z14 ions combined with the measured molecular weight indicate a sequence match for prothymosin alpha (predicted 12,165 Da). The additional product ions in the ETD spectrum correspond to predicted c- and z-ions of the prothymosin alpha sequence and confirm the identity.
Figure 3.
A) LC-MS base peak chromatogram of intact proteins extracted from a 12 µm section of mouse kidney and MALDI image acquired from an adjacent section showing the distribution of signals at m/z 9914 (blue) and m/z 12,169 (red). B) ETD spectrum of the [M+13H]13+ precursor ion (m/z 936.8) identified as prothymosin alpha (uniprot accession P26350).
Discussion
An essential aspect of tissue imaging mass spectrometry based methods is the ultimate identification of the imaged signals. Without the identification, the underlying biology and significance of the image cannot be deciphered. In this report we have successfully demonstrated a tissue microextraction method that, when combined with nanoLC-coupled ETD tandem mass spectrometry, provides sufficiently intense MS and MS/MS signals to identify the major components in a specific tissue region, including intact and modified proteins. The use of electron transfer dissociation provides rich fragmentation spectra of intact proteins up to 23.2 kDa with sufficient signals that can be readily interpreted.
The tissue extraction technique, as implemented in this report, involves extraction of proteins from a circular area of tissue of approximately 2 mm in diameter using commercially available gel loading pipette tips. With finely pulled capillaries, smaller extraction volumes, and robotic control, much smaller areas of tissue can be sampled and used to identify proteins in highly specific regions of interest on a tissue. Indeed, it is desirable that the entire process be automated for high throughput analysis of proteins from small areas of tissue sections. Based on signal intensities observed in the current study, we estimate that low picomole amounts of total protein are extracted from the tissue surface and high femtomole amounts of total protein are injected in each analysis.
The spectral interpretation of ETD spectra obtained from intact proteins is particularly challenging using low resolution data where the charge states of fragment ions are not evident in the acquired tandem mass spectra. Manual interpretation requires generation of sequence tags and assumptions on the fragment ion charge states to be made. However, once a strong sequence tag is generated, tag-based search algorithms can readily identify the protein of interest and additional fragment ions can be assigned. Note that we used longer ETD reaction times than should be required when reacting over 10-fold higher fluoranthene radical anions (AGC target of 3e5) with protein ions (AGC target of 1e4) extracted from tissue sections. However, the extended ETD reaction times were used to remove excess charge from highly-charged product ions. Reducing the population of multiply-charged products ions to lower charge states simplifies the spectra, thereby allowing sequence tag generation (17, 24) and subsequent protein identification. As one can see from the acquired ETD tandem mass spectra, we did not extend this time so long as to fully charge reduce all multiply charged species. This strategy can be particularly effective in a low-resolution instrument where charge state determination is limited.
Some database searching algorithms can be used for intact protein ETD spectra; however, since most existing algorithms depend on high resolution tandem mass spectral data, manual generation of sequence tags was a more successful approach for protein identification using low resolution ETD data presented here. High resolution ETD spectra provide charge state information that allows for efficient de novo sequencing of intact proteins or automated database searching via algorithms such as ProSight PTM (25) or MS-Align+ (26). Assuredly, automated spectral interpretation of low resolution ETD spectra will identify lower abundance components in the presented data sets.
In conclusion, a tissue microextraction method has been combined with a top-down proteomics approach to provide protein identifications from tissue sections used in MALDI-IMS imaging. The approach is applicable to multiple tissue types and allows signals imaged by MALDI-IMS to be identified; a current bottleneck using standard protein identification strategies. Improvements in spatial resolution of extraction and ETD interpretation algorithms are expected to make this strategy particularly attractive for imaging mass spectrometry.
Supplementary Material
Acknowledgements
This work was supported by NIH grant EY19728 to KLS.
References
- 1.Caprioli RM, Farmer TB, Gile J. Molecular imaging of biological samples: localization of peptides and proteins using MALDI-TOF MS. Anal Chem. 1997;69:4751–4760. doi: 10.1021/ac970888i. [DOI] [PubMed] [Google Scholar]
- 2.Zavalin A, Todd EM, Rawhouser PD, Yang J, Norris JL, Caprioli RM. Direct imaging of single cells and tissue at sub-cellular spatial resolution using transmission geometry MALDI MS. J Mass Spectrom. 2012;47:i. doi: 10.1002/jms.3132. [DOI] [PMC free article] [PubMed] [Google Scholar]
- 3.Caldwell RL, Caprioli RM. Tissue profiling by mass spectrometry: a review of methodology and applications. Mol Cell Proteomics. 2005;4:394–401. doi: 10.1074/mcp.R500006-MCP200. [DOI] [PubMed] [Google Scholar]
- 4.Herring KD, Oppenheimer SR, Caprioli RM. Direct tissue analysis by matrix-assisted laser desorption ionization mass spectrometry: application to kidney biology. Semin Nephrol. 2007;27:597–608. doi: 10.1016/j.semnephrol.2007.09.002. [DOI] [PMC free article] [PubMed] [Google Scholar]
- 5.Wang Z, Han J, Schey KL. Spatial differences in an integral membrane proteome detected in laser capture microdissected samples. J Proteome Res. 2008;7:2696–2702. doi: 10.1021/pr700737h. [DOI] [PMC free article] [PubMed] [Google Scholar]
- 6.Groseclose MR, Andersson M, Hardesty WM, Caprioli RM. Identification of proteins directly from tissue: in situ tryptic digestions coupled with imaging mass spectrometry. J Mass Spectrom. 2007;42:254–262. doi: 10.1002/jms.1177. [DOI] [PubMed] [Google Scholar]
- 7.Demirev PA, Feldman AB, Kowalski P, Lin JS. Top-down proteomics for rapid identification of intact microorganisms. Anal Chem. 2005;77:7455–7461. doi: 10.1021/ac051419g. [DOI] [PubMed] [Google Scholar]
- 8.Lagarrigue M, Alexandrov T, Dieuset G, Perrin A, Lavigne R, Baulac S, Thiele H, Martin B, Pineau C. New analysis workflow for MALDI imaging mass spectrometry: application to the discovery and identification of potential markers of childhood absence epilepsy. J Proteome Res. 2012;11:5453–5463. doi: 10.1021/pr3006974. [DOI] [PubMed] [Google Scholar]
- 9.Kertesz V, Van Berkel GJ. Liquid microjunction surface sampling coupled with high-pressure liquid chromatography-electrospray ionization-mass spectrometry for analysis of drugs and metabolites in whole-body thin tissue sections. Anal Chem. 2010;82:5917–5921. doi: 10.1021/ac100954p. [DOI] [PubMed] [Google Scholar]
- 10.Van Berkel GJ, Kertesz V. Application of a liquid extraction based sealing surface sampling probe for mass spectrometric analysis of dried blood spots and mouse whole-body thin tissue sections. Anal Chem. 2009;81:9146–9152. doi: 10.1021/ac901712b. [DOI] [PubMed] [Google Scholar]
- 11.Lanekoff I, Heath BS, Liyu A, Thomas M, Carson JP, Laskin J. Automated platform for high-resolution tissue imaging using nanospray desorption electrospray ionization mass spectrometry. Anal Chem. 2012;84:8351–8356. doi: 10.1021/ac301909a. [DOI] [PubMed] [Google Scholar]
- 12.Laskin J, Heath BS, Roach PJ, Cazares L, Semmes OJ. Tissue imaging using nanospray desorption electrospray ionization mass spectrometry. Anal Chem. 2012;84:141–148. doi: 10.1021/ac2021322. [DOI] [PMC free article] [PubMed] [Google Scholar]
- 13.Reid GE, McLuckey SA. 'Top down' protein characterization via tandem mass spectrometry. J Mass Spectrom. 2002;37:663–675. doi: 10.1002/jms.346. [DOI] [PubMed] [Google Scholar]
- 14.Kellie JF, Tran JC, Lee JE, Ahlf DR, Thomas HM, Ntai I, Catherman AD, Durbin KR, Zamdborg L, Vellaichamy A, Thomas PM, Kelleher NL. The emerging process of Top Down mass spectrometry for protein analysis: biomarkers, protein-therapeutics, and achieving high throughput. Mol Biosyst. 2010;6:1532–1539. doi: 10.1039/c000896f. [DOI] [PMC free article] [PubMed] [Google Scholar]
- 15.McLafferty FW, Horn DM, Breuker K, Ge Y, Lewis MA, Cerda B, Zubarev RA, Carpenter BK. Electron capture dissociation of gaseous multiply charged ions by Fourier-transform ion cyclotron resonance. J Am Soc Mass Spectrom. 2001;12:245–249. doi: 10.1016/S1044-0305(00)00223-3. [DOI] [PubMed] [Google Scholar]
- 16.Coon JJ, Ueberheide B, Syka JE, Dryhurst DD, Ausio J, Shabanowitz J, Hunt DF. Protein identification using sequential ion/ion reactions and tandem mass spectrometry. Proc Natl Acad Sci U S A. 2005;102:9463–9468. doi: 10.1073/pnas.0503189102. [DOI] [PMC free article] [PubMed] [Google Scholar]
- 17.Udeshi ND, Compton PD, Shabanowitz J, Hunt DF, Rose KL. Methods for analyzing peptides and proteins on a chromatographic timescale by electron-transfer dissociation mass spectrometry. Nat Protoc. 2008;3:1709–1717. doi: 10.1038/nprot.2008.159. [DOI] [PMC free article] [PubMed] [Google Scholar]
- 18.Mohr J, Swart R, Samonig M, Bohm G, Huber CG. High-efficiency nano- and micro-HPLC--high-resolution Orbitrap-MS platform for top-down proteomics. Proteomics. 2010;10:3598–3609. doi: 10.1002/pmic.201000341. [DOI] [PubMed] [Google Scholar]
- 19.Tipton JD, Tran JC, Catherman AD, Ahlf DR, Durbin KR, Lee JE, Kellie JF, Kelleher NL, Hendrickson CL, Marshall AG. Nano-LC FTICR tandem mass spectrometry for top-down proteomics: routine baseline unit mass resolution of whole cell lysate proteins up to 72 kDa. Anal Chem. 2012;84:2111–2117. doi: 10.1021/ac202651v. [DOI] [PMC free article] [PubMed] [Google Scholar]
- 20.Edwards RL, Griffiths P, Bunch J, Cooper HJ. Top-down proteomics and direct surface sampling of neonatal dried blood spots: diagnosis of unknown hemoglobin variants. J Am Soc Mass Spectrom. 2012;23:1921–1930. doi: 10.1007/s13361-012-0477-9. [DOI] [PubMed] [Google Scholar]
- 21.Strohalm M, Kavan D, Novak P, Volny M, Havlicek V. mMass 3: a cross-platform software environment for precise analysis of mass spectrometric data. Anal Chem. 2010;82:4648–4651. doi: 10.1021/ac100818g. [DOI] [PubMed] [Google Scholar]
- 22.Grey AC, Schey KL. Age-related changes in the spatial distribution of human lens alpha-crystallin products by MALDI imaging mass spectrometry. Invest Ophthalmol Vis Sci. 2009;50:4319–4329. doi: 10.1167/iovs.09-3522. [DOI] [PMC free article] [PubMed] [Google Scholar]
- 23.Bunger MK, Cargile BJ, Ngunjiri A, Bundy JL, Stephenson JL., Jr Automated proteomics of E. coli via top-down electron-transfer dissociation mass spectrometry. Anal Chem. 2008;80:1459–1467. doi: 10.1021/ac7018409. [DOI] [PubMed] [Google Scholar]
- 24.Zamdborg L, LeDuc RD, Glowacz KJ, Kim YB, Viswanathan V, Spaulding IT, Early BP, Bluhm EJ, Babai S, Kelleher NL. ProSight PTM 2.0: improved protein identification and characterization for top down mass spectrometry. Nucleic Acids Res. 2007;35:W701–W706. doi: 10.1093/nar/gkm371. [DOI] [PMC free article] [PubMed] [Google Scholar]
- 25.Liu X, Sirotkin Y, Shen Y, Anderson G, Tsai YS, Ting YS, Goodlett DR, Smith RD, Bafna V, Pevzner PA. Protein identification using top-down. Mol Cell Proteomics. 2012;11 doi: 10.1074/mcp.M111.008524. M111 008524. [DOI] [PMC free article] [PubMed] [Google Scholar]
Associated Data
This section collects any data citations, data availability statements, or supplementary materials included in this article.


