Abstract
The interaction between TLRs and their cognate ligands triggers both the innate and adaptive immune systems and thus can play a pivotal role in the defense against pathogen invasion. This work investigates the differentiation of naïve CD4 cells into Th1 or Th17 phenotypes in mice treated with different TLR ligands. We use a model system in which naïve transgenic cells specific to hen egg lysozyme (HEL) are adoptively transferred into recipients that express HEL in the lens of the eye. The transferred naïve T cells induce ocular inflammation only in recipients treated with TLR ligands. Treatment with LPS preferentially stimulated IL-17 production, whereas CpG oligodeoxynucleotide and poly (I:C) primarily stimulated Th1 cells. Peptidoglycan stimulated the two Th subpopulations equally. The preferential induction of Th1 or Th17 by the four ligands was detected in the spleen (where a major portion of the adoptively transferred cells homed) and in the eyes, where activated Th cells initiate inflammation. Analysis of the cytokines present in recipient mice suggests that Th1 induction is elicited by IL-12 and/or IFN-α, whereas Th17 generation is preferentially mediated by IL-6. Importantly, we show here that treatment with LPS selectively promoted in the recipient mice the generation of IL-6 producing activated B-cells. An inverse correlation was found between the level of Tregs and severity of inflammation induced by the donor cells. Taken together, our data show that specific TLR ligands differentially activate the immune system as evidenced by the generation of distinct Th phenotypes from naïve CD4 cells.
Keywords: T cells, Autoimmunity, Inflammation, Transgenic/Knockout mice
(Introduction)
The family of TLRs play a central role in innate immune defense by recognizing pathogen-associated molecular patterns (PAMPs) and initiating response against them (1–4). Thus far, 11 TLRs have been identified in humans and 13 in mice, with different or overlapping ligands (2, 5). In addition to their role in protection against pathogens, however, TLRs have been found to be involved in the pathogenesis of diseases with autoimmune etiology. Specifically, relationships were noted between TLR2 and inflammatory bowel diseases (IBD), rheumatoid arthritis (RA) and multiple sclerosis (MS) (6–9), between TLR3 and RA and type 1 diabetes (T1D) (10, 11), between TLR4 and IBD and RA and between TLR9 and IBD, T1D and systemic lupus erythematosus (6, 7, 12, 13). It is assumed that the pathogenic responses are triggered at least in part by the interaction of TLRs with their ligands and studies with experimental animals provide evidence to show that microbial products function as the TLR ligands in these presumed processes (4, 14, 15).
At the cellular level, the development of autoimmune disease is a complex process that involves escape from tolerance in the thymus and activation followed by proliferation of the self-reactive effector T cells (16). During the activation process, the self-reactive CD4+ T cells differentiate into subsets of Th cells, mainly Th1 and Th17 and these cells initiate the pathogenic process by recruiting a variety of immune cells into the target organ. The exact role TLRs play in the above processes is not entirely known. It has been reported that TLRs are abundantly expressed on some innate immune cells, such as macrophages and DCs, as well as on epithelial cells (17), differentiated T cells (18) and Treg cells (19, 20). Addition of ligands for TLR2, 3, 4, and 9 with DC into naïve CD4 T cell cultures was shown to promote both Th1 and Th17 differentiation, with Th17 differentiation being more prominent (18, 21). Unlike TLR ligand-induced Th17 differentiation, in which IL-6/TGF-β mediated pathway is the major known mechanism, TLR ligand-induced Th1 differentiation can be mediated by two distinct pathways, through IL-12 or IFN-α (22–25). Activation of TLR4 by LPS, and TLR9 by CpG oligodeoxynucleotide (ODN) induce Th1 responses through IL-12p70 release (26), whereas stimulation of IFN-α release by TLR3, TLR4, TLR7, and TLR9 has been shown to be another important driving force of TLR-mediated Th1 responses (23, 24).
In a previous study (15), we provided evidence to show that treatment with TLR ligands converts naïve CD4 cells into pathogenic effector cells, capable of initiating inflammatory processes. In the experimental system we used (15), naïve TCR-transgenic (Tg) CD4 cells with specificity to hen egg lysozyme (HEL) are adoptively transferred into recipients that expressed HEL in their eyes. Treatment with TLR ligands activates the naïve cells to initiate inflammation in the recipients’ eyes. The present study was aimed at using this experimental system in order to investigate the patterns of differentiation of naïve CD4 cells into either Th1 or Th17 phenotypes in recipient mice treated with different ligands. The tested ligands included lipopolysaccharide (LPS), which is specific toward TLR4, poly (I:C), specific to TLR3, peptidoglycan (PGN), specific for TLR2 and the ODN, CpG, specific to TLR9. Analysis of the differentiation was performed on the donor cells collected from the recipients’ inflamed eyes, as well as their spleens. Remarkable differences were observed among the cell populations collected from recipients treated with the four tested TLR ligands.
Materials and methods
Mice
Tg mice expressing membrane-associated HEL in the lens under control of the αA-crystallin promoter, on an FVB/N background, were generated as described (15, 27). HEL-specific TCR-Tg mice (designated “3A9”), on a B10.BR background, were a gift from Mark Davis (Stanford University). Tg mice from each line were mated to produce (FVB/N × B10.BR) F1 hybrids that express HEL in their lens, or HEL-specific TCR, or both, or neither transgene. Only F1 mice were used in this study and included those expressing the HEL gene (“HEL-Tg”), the 3A9 TCR gene (“3A9”), or neither gene (“WT”). All manipulations were performed in compliance with the NIH Resolution on the Use of Animals in Research.
Adoptive transfer of CD4 cells and induction of disease
Naive CD4 cells were isolated from spleens and lymph nodes of 3A9 mice using T cell columns and MACS beads as described in detail elsewhere (15, 27). Isolated CD4 cells (5 × 10⁶) were injected i.v. into naive HEL-Tg mice. On the following day, recipient mice were injected i.v. with HEL and TLR ligands. The doses we used were: HEL (Sigma), 100 µg; poly (I:C) (Sigma), 300 µg; LPS (Difco), 50 µg; peptidoglycan (Sigma), 300 µg; CpG ODNs, 240 µg, GCTAGACGTTAGCGT and TCAACGTTGA, were synthesized at the Center for Biologics, FDA, core facility. All ODNs were free of endotoxin and protein contamination, as determined by chromogenic Limulus amoebocyte lysate and bicinchoninic acid protein assays (Pierce Biotechnology, Rockford, IL.) and were administered together. Eyes were collected on day 7 post cell transfer and development of inflammation was determined histologically (15).
Preparation of ocular single-cell suspensions
On day 7 post adoptive transfer, eyes of recipients were collected, dissected, and digested in RPMI 1640 medium containing 10% FBS, 1 mg/ml collagenase D (Roche), and deoxyribonuclease I (Sigma-Aldrich) for 2 hr. Following digestion, ocular cells were mechanically dissociated and filtered. The single ocular cell suspensions were used for flow cytometric analysis.
Intracellular cytokine flow cytometry
To analyze intracellular IL-17 and IFN-γ expression, splenocytes, isolated as described elsewhere (15, 27, 28) and eye-infiltrating cells, isolated as described above, were stimulated with 20 ng/ml PMA and 1 µM ionomycin (Sigma-Aldrich) in the presence of GolgiStop (BD Biosciences) for 4 h, prior to staining. Cells were surface stained using mAb against murine CD4 conjugated with Percp-cy5.5 (BD Pharmingen), and a clonotypic mAb specific for the Tg TCR of the 3A9 mice, designated “1G12”, a gift from Emil Unanue (Washington University), conjugated with FITC. Ag-specific donor CD4 cells in recipients were identified by staining with anti-CD4-Percp-cy5.5 and 1G12-FITC. Anti-CD16/CD32 (BD Pharmingen) was used to block FcRs in all staining. Intracellular cytokines were stained using mAbs against IL-17 conjugated with PE and against IFN-γ conjugated with allophycocyanin (BD Pharmingen).
To analyze intracellular IL-6 expression, isolated splenocytes were stimulated with 10 µg/ml LPS and GolgiStop for 4 h. FcRs on cells were blocked using anti-CD16/CD32, followed by staining with anti-CD19-PE (BD Pharmingen) and anti-CD-80-FITC (BD Pharmingen). Intracellular IL-6 was stained using anti-IL-6 conjugated with allophycocyanin (BD Pharmingen). Data were acquired using FACSCalibur and analyzed with FlowJo (Tree-Star).
For Foxp3 staining, isolated splenocytes or ocular cells were fixed and permeabilized with the Fixation/Permeabilization buffer for 1 h at 4°C before intracellular staining with allophycocyanin-conjugated anti-Foxp3 Ab following the procedure recommended by the manufacturer (eBioscience). Data were acquired and analyzed as described above
Surface Ag analysis in eye infiltrating cells
Single cell suspensions of tested eyes were obtained as described above and were suspended in FACS buffer at 2×10⁶/200ul in each tube. Cells were incubated with anti-CD16/CD32 Ab for 5 min at room temperature to block FcRs, followed by incubation for 20 min at room temperature with a set of conjugated Abs including 1G12-FITC, anti-F4/80-FITC (eBiosencice), and the following Abs from BD Pharmingen: anti-CD8-FITC, anti-Gr-1-FITC, anti-CD4-PE, anti-CD3-PE, and anti-CD11b-PE. Stained cells were washed twice in 2 ml FACS buffer. Data were acquired and analyzed as described above
Testing the effect of anti-IL-6R Ab
Anti-IL-6R Ab a gift from Dr. Rachel Caspi, NEI/NIH and IgG control (Jackson ImmunoResearch Laboratories) were administered i.p. on day 0 and day 2 post cell transfer, at 0.8 mg/mouse. On day 3 post cell transfer, splenocytes were isolated and intracellular IL-17 and IFN-γ expression was determined as described above.
ELISA
Blood was withdrawn from recipient mice 3 or 24 hours post ligand injection. Serum was used to measure the levels of IL-6, IL-12 (p70), and IFN-α, using the appropriate ELISA kits (BioLegend) and according to the manufacturer’s instructions.
Statistical analysis
Unpaired, two-tail t test was performed for comparison of the proportions of eye infiltrating CD4 T cells or Tregs from donor or host. p ≤ 0.05 was defined as statistically significant.
Results
Differences among TLR ligands in their capacity to trigger pathogenicity by naïve CD4 cells
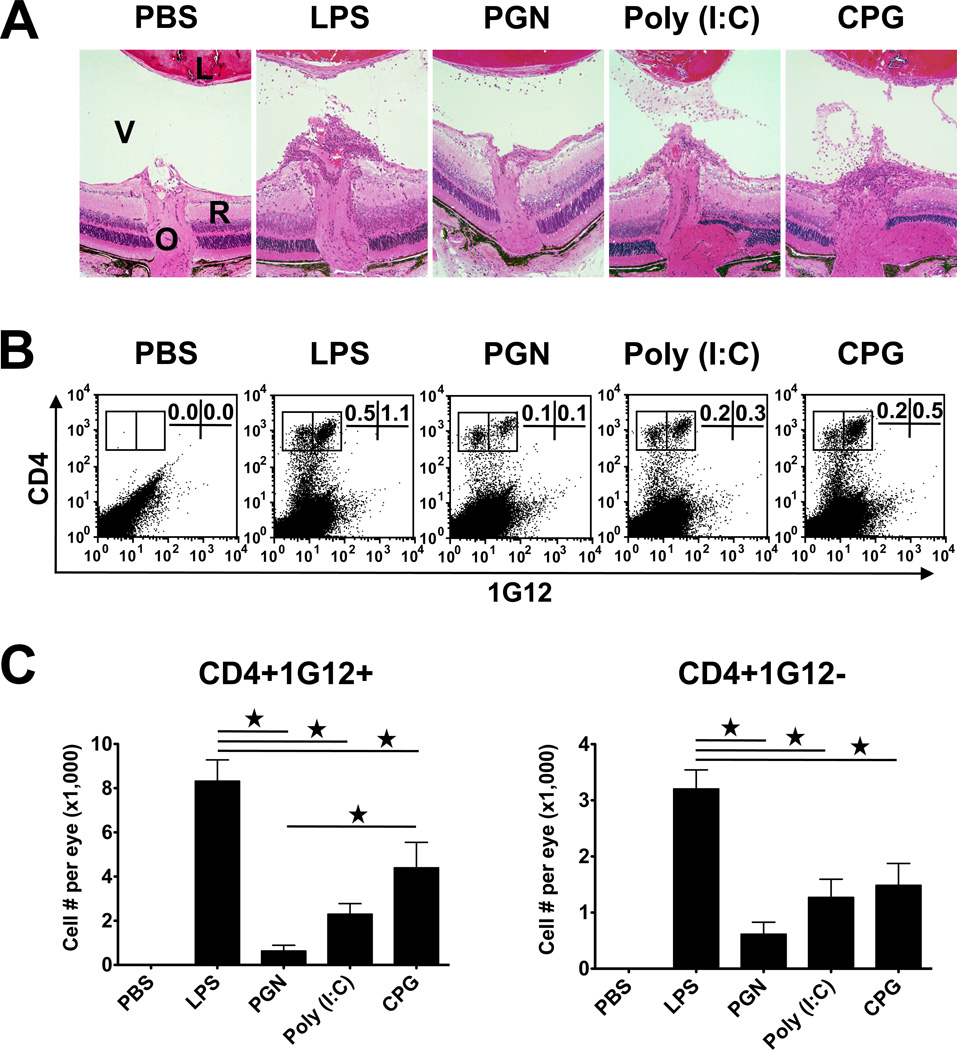
We have previously shown that TCR Tg naïve CD4 cells specific against HEL adoptively transferred into recipients expressing HEL in their eyes acquire pathogenic capacity when triggered in vivo by TLR ligands, to respond against HEL and mediate inflammation in the recipient eyes (15) (also shown in Fig. 1A). To learn more about the pathogenic response triggered by the different TLR ligands, we collected the eye infiltrating cells of the different recipient groups and counted their numbers after differentiating between the CD4 T cells of the donor or host origin by immunostaining with the clonotypic mAb 1G12, which is specific for TCR of the donor cells (Fig. 1B). The inflammation severity level, as well as the proportion of donor cells in the infiltrate, were found to be the highest in eyes of mice treated with LPS; lower levels were found in eyes of mice treated with CpG, poly (I:C) and PGN, respectively.
Figure 1.
Adoptively transferred naïve CD4 T cells specific against HEL induce various levels of ocular inflammation in recipient mice expressing HEL in their lens following treatment with the tested TLR ligands. (A) Histological sections of eyes from recipient mice, 7 days post transfer of 5 million naïve CD4 cells. Shown are the retinas at the optic nerve head area (a major entry site for the activated lymphocytes). Inflammatory cells infiltrating the retina and vitreous of ligand-treated mice, but not of the controls treated with PBS. V, vitreous; R, retina; O, optic nerve head. (B) Flow cytometric analysis of cells collected from the recipient eyes, determining the proportions of CD4 cells of the donor (1G12+) and host (1G12−) cells among the total retrieved ocular cells. (C) Mean numbers of donor and host CD4 cells collected from inflamed eyes, indicating the various levels of severity of the inflammatory response.
Differential involvement of Th1 and Th17 in ocular inflammation triggered by CD4 cells activated by different TLR ligands
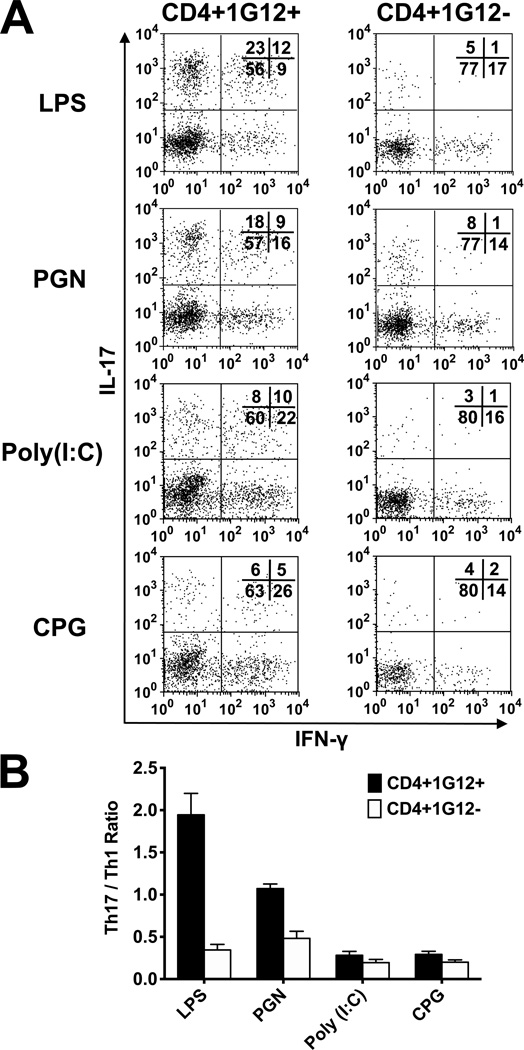
To investigate the involvement of Th1 and Th17 cells in the immunopathogenic processes triggered by TLR ligands, we analyzed the eye infiltrating cells for expression of IFN-γ and IL-17, respectively, in eyes of recipients treated with the four TLR ligands. We carried out the analysis by intracellular immunofluorescene and identified the donor cells by using the clonotypic mAb, 1G12. Data of a representative experiment are demonstrated in Fig. 2; similar observations were made in three other independent experiments. Remarkable differences were seen among the T-cell populations collected from inflamed eyes of the four mouse groups in the proportions of Th1 or Th17, expressing IFN-γ or IL-17, respectively. Analysis of donor cells revealed predominance of Th17 cells in eyes of mice treated with LPS, similar proportions of Th1 and Th17 in eyes of mice treated with PGN, but predominance of Th1 in eyes of mice treated with CpG or poly (I:C). Unlike with donor cells (1G12+), host cells (1G12−) infiltrating the recipient mouse eyes predominantly included Th1 cells in all four treated mouse groups (Fig. 2). It is also of interest that the proportions of double positive cells, expressing both IFN-γ and IL-17, were considerably higher among donor cells than among recipient cells (Fig. 2A).
Figure 2.
Identification of Th1 and Th17 among the CD4 cells infiltrating the recipient eyes. (A) Intracellular flow cytometric analysis of cells collected from eyes of TLR ligand-treated recipient mice, on day 7 post cell transfer. A representative experiment, showing the remarkable differences among the mice treated with the four ligands. (B) Calculated mean ratios between Th17 and Th1 among donor and host cells, in four repeated experiments. Remarkable differences between Th1 and Th17 levels among donor cells in mice treated with the TLR ligands, but minimal variety among the host cell populations.
The differences among the mouse groups treated with the four TLR ligands are also summarized in Fig 2B, in which the calculated ratios of Th17/Th1 in eyes of the different groups in repeated experiments are shown.
Different proportions of donor Th1 and Th17 cells in spleens of recipients treated with the different TLR ligands
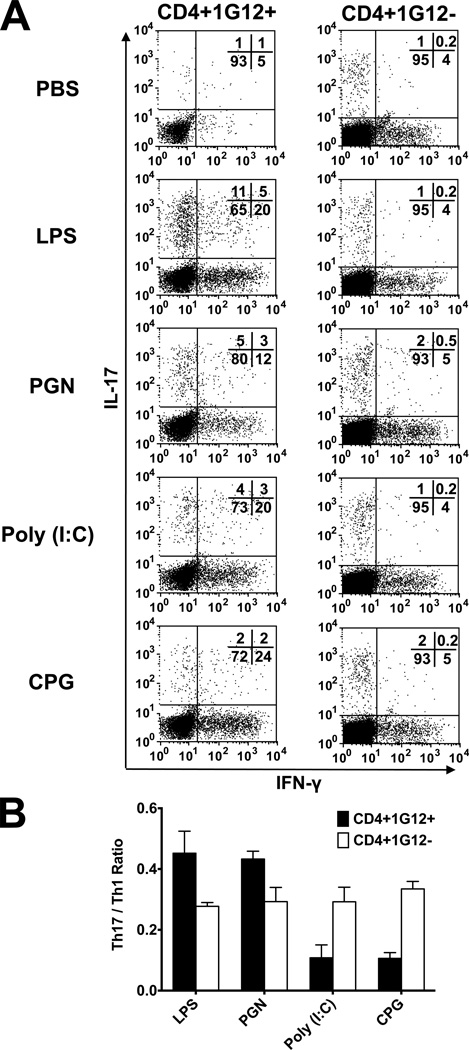
Before invading the eye, adoptively transferred cells home to the recipient spleen, where they proliferate, presumably following exposure to their target Ag, HEL (15, 29), which is also injected to the recipient animals. Assuming that portions of the donor cells are also polarized during the activation process, while being exposed to the cytokine milieu of the spleen, we determined the proportions of cells expressing IFN-γ or IL-17, on day 3 post-cell transfer. The data of a representative experiment are shown in Fig. 3A.
Figure 3.
Identification of Th1 and Th17 among the CD4 cells in the recipient spleen. (A) Intracellular flow cytometric analysis of cells collected from spleens of TLR ligand-treated recipient mice, on day 3 post-cell transfer. A representative experiment, showing differences among the mice treated with the four ligands, despite the Th1 population being predominant in spleens of all tested treatments. (B) Calculated mean ratios between Th17 and Th1 among donor and host cells, in three repeated experiments. Remarkable differences between Th1 and Th17 levels among donor cells in mice treated with the TLR ligands, but essentially no variation among the host cells.
The proportions of donor cells expressing IFN-γ or IL-17 differed among the four groups of mice, but to lesser degrees than those seen among the eye-infiltrating CD4 cells (Fig. 2). Interestingly, the donor Th1 population was predominant in all four mouse groups and differences were noted only in the Th1 dominance level, with mice treated with CpG and poly (I:C) exhibiting the highest ratio between Th1 and Th17. It is of note, however, that the portion of cells staining for IL-17 was the highest in spleens of recipients treated with LPS. Similar effects of LPS on donor cell populations were observed in recipient mice treated with lower doses of the endotoxin, i.e., 10 and 2 µg/mouse (data not shown). These quantitative differences among the four treated groups, observed in repeated experiments, are summarized in Fig. 3B. Also shown in Fig. 3 are data concerning the host (1G12−) CD4 subpopulations. As expected, essentially no differences were noted among the four groups in the dominance of the host Th1 subpopulation, since the host T-cells did not recognize HEL and could not participate therefore in the polarization process.
The four TLR ligands induce different patterns of cytokine production by the recipient mouse cells
TLR ligands affect the immune system by interacting with TLRs expressed on lymphoid cells and activating these cells to produce and release cytokines including those that activate lymphocytes. These cytokines include IL-6, the major polarizing cytokine for Th17 differentiation (30, 31), as well as IL-12 and IFN-α, cytokines that play major roles in generation of Th1 cells (23, 31). We tested for the production of these cytokines by measuring their serum levels in treated recipients, 3 and 24 hrs after treatment with the TLR ligands and by qPCR analysis of their transcripts in the recipient spleens on days 1 and 3.
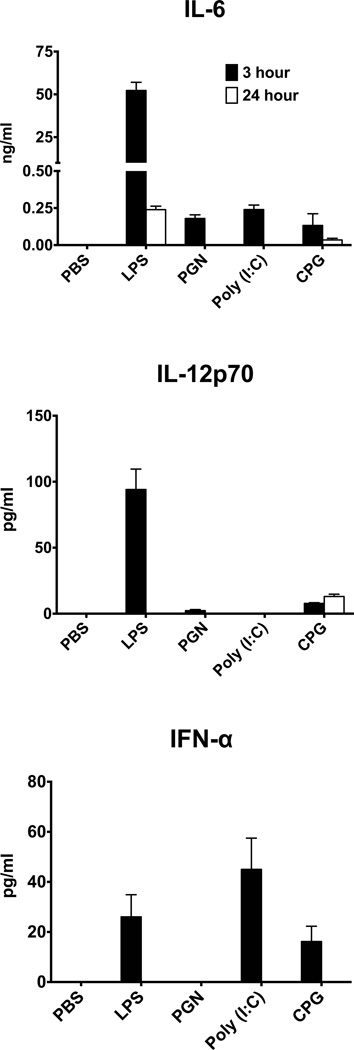
Expression analysis for the three transcripts in recipient spleens revealed that treatment with the ligands had no measureable effect on the substantial “baseline” levels of these transcripts, expressed by the control mouse spleens (data not shown). The TLR ligands, however, initiated secretion of the polarizing cytokines into the recipient serum. As shown in Fig. 4, the four tested ligands differed remarkably in the pattern of their effect on the production of the polarizing cytokines, IL-6, IL-12 and IFN-α. Treatment with LPS was superior among the four ligands in its stimulating IL-6 release into the serum, reaching excessive levels at 3 hrs and dropping to much lower levels at 24 hrs post ligand injection. LPS also stimulated high levels of IL-12p70, but only in the serum sample tested at 3 hrs. Low levels of IL-12p70 were also found in the serum of mice treated with CpG, but unlike in LPS-treated mice, their serum levels of IL-12p70 at the 24 hr time point were higher than those at the 3 hr time point. IFN-α, the other cytokine involved in the polarization toward Th1 phenotype (23, 24), was detected only at the 3 hr time point in mice treated with LPS, CpG and, in particular, with poly (I:C).
Figure 4.
Production of potentially polarizing cytokines by mice treated with the TLR ligands. Groups of HEL-Tg mice were injected with PBS or the four tested ligands and blood samples were collected at the 3 or 24 hrs time points post-cell injection. Cytokine levels were determined in the serum samples by ELISA.
Treatment with LPS selectively increased the proportion of IL-6 producing B-cells
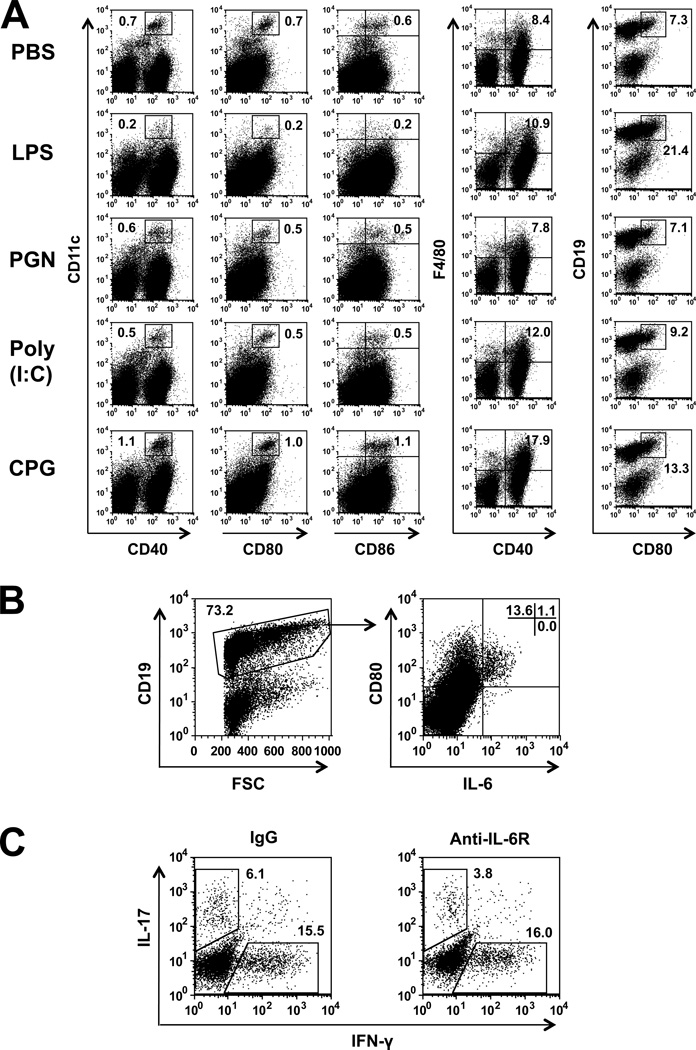
To examine the possibility that the mode of action of the TLR ligands is related to their selective effect on certain populations of APC in the recipient mice, we analyzed by flow cytometry the proportions of DC, macrophages and B-cells in spleens of recipients treated with the four TLR ligands. Data of a representative experiment are summarized in Fig. 5A. Spleen cells from recipients treated with LPS were inferior to spleen cells of recipients treated with the other TLR ligands in their proportions of activated DC and their percentages of activated macrophages were lower than those of recipients of CpG or poly (I:C). LPS recipients, however, were superior to recipients of other ligands in the proportions of activated B-cells (CD19+CD80+) in their spleen (Fig. 5A). To further analyze the effect of LPS treatment, we determined by flow cytometry the proportion of IL-6 producing cells among spleen cells of LPS-treated mice. As shown in Fig. 5B, a considerable proportion of activated B-cells (CD19+CD80+) expressed intracellular IL-6, whereas non-activated B-cells (CD19+CD80−) did not.
Figure 5.
LPS treatment selectively activates IL-6 producing B-cells. (A) Flow cytometry analysis of spleen cells from recipient mice, 3 days following naïve CD4 cell transfer (on day 0) and treatment with the ligands (day 1). CD11c+ cells were co-stained for CD40, CD80 and CD86; F4/80 were co-stained for CD40; and CD19+ cells were co-stained for CD80. Different patterns of staining by cells treated with the four TLR ligands. Importantly, splenocytes of LPS-treated mice exhibit unique staining pattern, characterized by high expression of CD80 in B cells. (B) Spleen cells from LPS treated mice were gated on CD19+ cells and analyzed for IL-6 production, showing selective production by CD80+ cells. (C) Spleen cells from recipients treated with anti-IL6R Ab or IgG controls were analyzed for intracellular expression of IFN-γ and IL-17. Considerable selective reduction in IL-17 expression by spleen cells of the Ab-treated mice.
Treatment with anti-IL-6R Ab reduced the proportion of Th17 cells
In order to further analyze the role of IL-6 in promoting the generation of Th17 cells in our system, we injected LPS-treated recipient with anti-IL-6R Abs. Mice treated with this Ab had lower proportions of Th17 cells in their spleens, as compared to controls (Fig. 5C). These data thus confirm the crucial role IL-6 plays in the generation of Th17 cells.
Variations in the development of the Treg phenotype by donor CD4 cells in recipients treated with the different TLR ligands
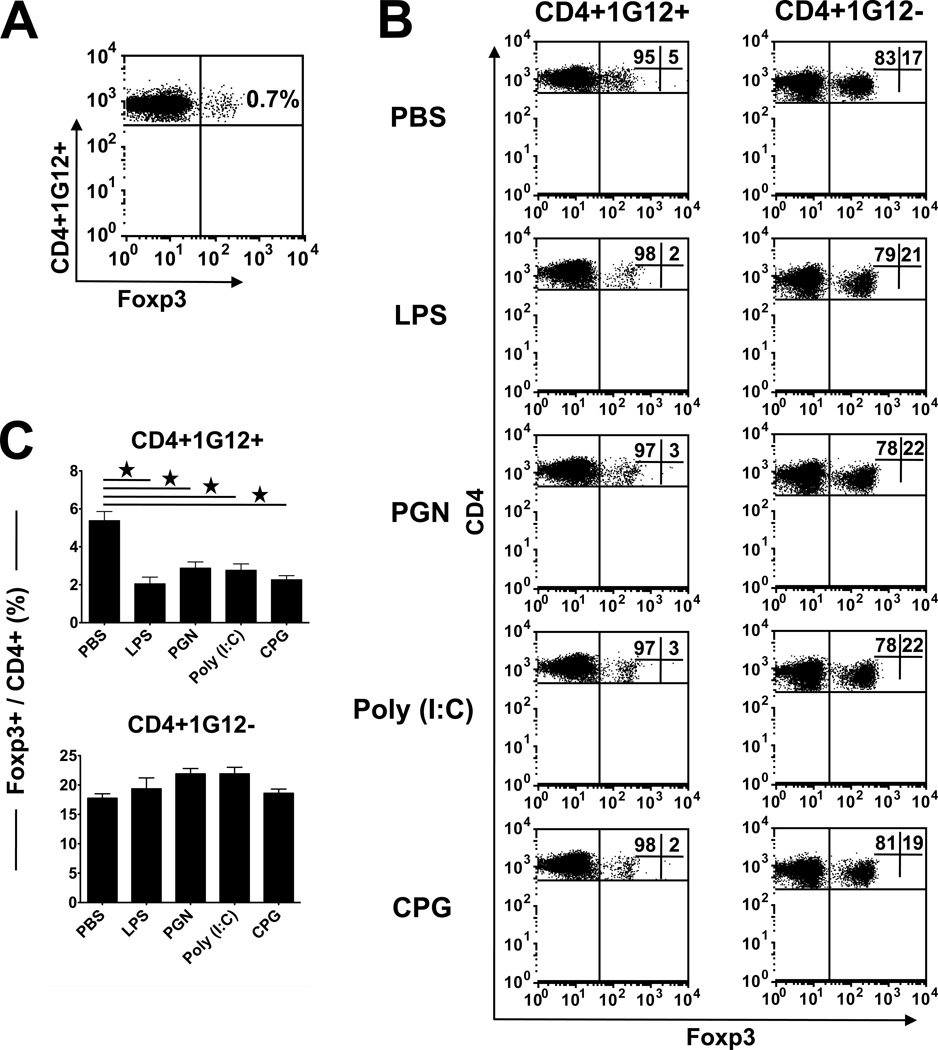
The phenotype of Treg cells is generally identified by the expression of the transcription factor Foxp3 (32). Naïve CD4 cells of the TCR Tg 3A9 mice express a marginal level of Foxp3 (Fig. 6A). To monitor the proportion of Treg phenotype among donor CD4 cells that accumulate and proliferate in the spleen of recipients treated by the four TLR ligands, or PBS, we analyzed these cells for the Foxp3 expression. Data of a representative experiment are shown in Fig. 6B and demonstrate remarkably higher levels of Foxp3+ cells than those seen in the naïve 3A9 cell preparation (Fig. 6A). The highest percentage of Foxp3+ was observed in the control mice treated with PBS (~5%); lower levels were found in mice treated with the TLR ligands.
Figure 6.
Frequency of Foxp3+ Treg cells in the spleen of donor and recipient mice. (A) Flow cytometric analysis of spleen cells from naïve 3A9 (donor) mice, showing the very low level of Foxp3 in these TCR Tg mice. (B) Flow cytometric analysis of spleen cells of TLR ligands-treated recipient mice (HEL-Tg), collected on day 3 following adoptive transfer of 5 million naïve 3A9 CD4 cells. Recipients treated with the ligands have lower levels of Foxp3 cells than the PBS-treated controls. (C) Calculated mean percentages of Foxp3+ cells among donor and recipient CD4 cells.
Unlike the low values of Foxp3 among the donor (1G12+) cells, approximately 20% of the host (1G12−) CD4 cells in these spleens expressed this marker, with slight increases in TLR ligand-treated mice as compared to the PBS-treated controls. The difference between donor and host cells in their expression of Foxp3, summarized in Fig. 6C, is in line with the well known observation of relatively low proportions of Treg cells in Tg mice expressing TCR against a neo-antigen (33, 34).
Variability in expression of Foxp3 by CD4 cells infiltrating the recipient mouse eyes
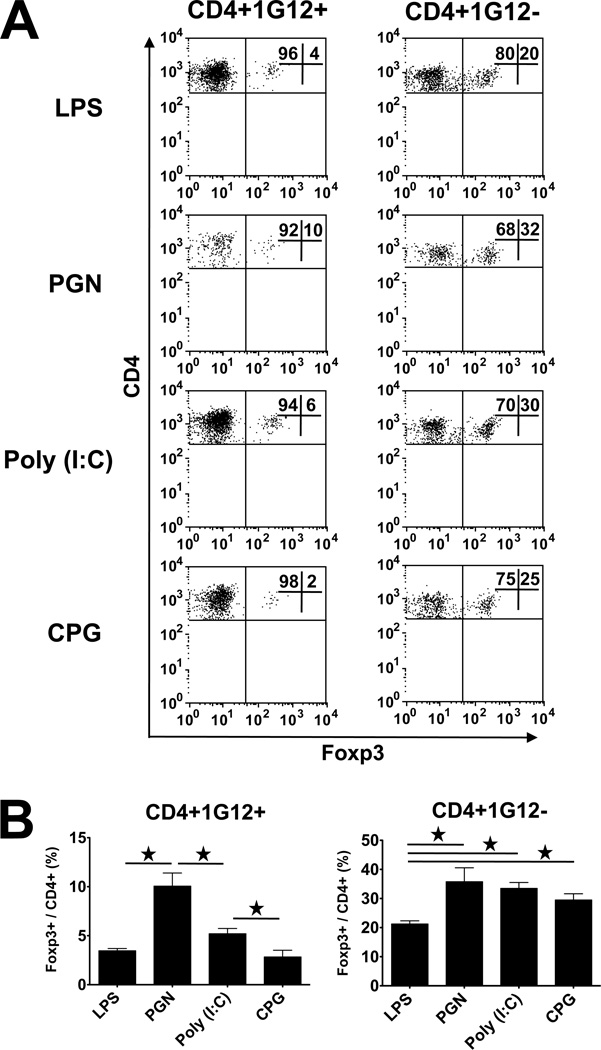
Next, we analyzed the Foxp3 expression by CD4 cells that infiltrated the inflamed eyes of recipients treated with the TLR ligands. The data of a representative experiment are shown in Fig. 7A and data of this and two other experiments are summarized in Fig. 7B. The data indicate that the proportions of Foxp3+ cells in the affected eyes among both donor and recipient CD4 cells were higher than those observed in the spleens of the same mice, shown in Fig. 6. In addition, high levels of variability were noted among the mice treated with the different TLR ligands in the percentage of Foxp3 expressing cells, with generally an inverted correlation with the severity of pathological changes. Thus, the levels of Foxp3+ cells in eyes of mice treated with LPS and CpG were lower than those in mice treated with PGN and poly (I:C).
Figure 7.
Frequency of Foxp3+ Treg cells among donor and recipient CD4 cells in the eyes of recipient mice. (A) Flow cytometric analysis of CD4 cells collected from eyes of TLR ligand-treated recipient mice, collected on day 3 following adoptive transfer of 5 million naïve 3A9 CD4 cells. An inverted correlation is seen in general between severity of inflammation and level of Foxp3+ cells among both donor and host infiltrating CD4 cells. (B) Calculated mean percentages of Foxp3+ cells among donor and recipient CD4 cells.
Similar to the observation with recipient spleens, the proportions of cells expressing Foxp3 among the host cells in the recipient mouse eyes were remarkably higher than those among the donor cells. In addition, the Foxp3+ levels among host CD4 cells in eyes of recipients treated with LPS was lower than those in eyes of mice treated with other ligands (Fig. 7B).
Participation of non-CD4 cells in the ocular inflammatory process
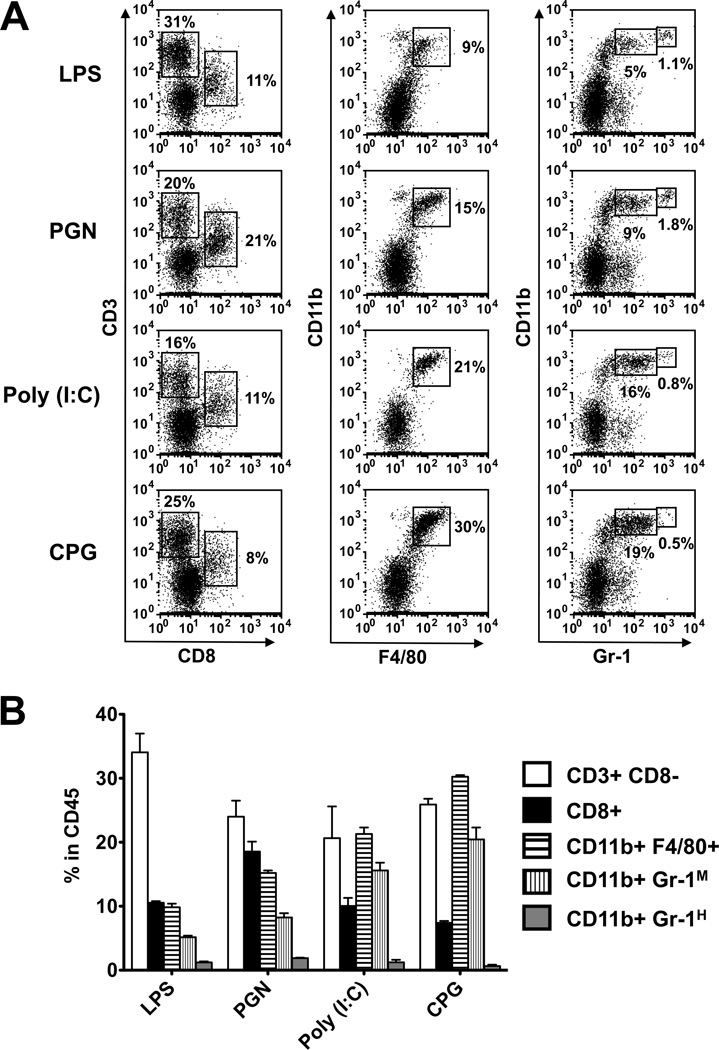
The inflammatory process initiated by CD4 lymphocytes encompasses cells from other populations, including mainly CD8 cells, macrophages and PMNs. To determine the involvement of these non-CD4 populations, we collected infiltrating cells from eyes with inflammation induced by the four TLR ligands and examined them by flow cytometry for the expression of Ags specific to these populations, namely, CD8, F4/80 and Gr-1, respectively. The added Abs did not react with the donor cells. Flow cytometric data of a representative experiment are shown in Fig. 8A and data of this and two additional experiments are summarized in Fig. 8B. Noticeable differences were seen among the eye infiltrates in recipients treated with the four TLR ligands. Observations of interest include: (i) relatively low levels of macrophages and PMNs in eyes of LPS treated recipient mice; (ii) high levels of CD8+ cells in PGN-treated recipients and (iii) high level of macrophages in recipients treated with CpG. Also of interest are differences among the four groups in the proportions of PMNs expressing high and low levels of Gr-1, representing mature and immature neutrophils respectively (35).
Figure 8.
Involvement of non-CD4 lymphoid cells in the inflammatory process in eyes of recipients treated with the TLR ligands. (A) Infiltrating cells were collected from recipient eyes on day 7 post-naïve CD4 cell injection and were examined by flow cytometry, with gating on CD45+ cell population, for expression of surface markers specific for CD8, macrophages and granulocytes. (B) Calculated percent values of cells expressing the markers among the CD45+ cell population.
Discussion
Data reported here extend our previous study (15), that established an experimental system in which TLR ligands trigger processes that convert naïve CD4 cells specific to HEL into pathogenic Th cells capable of initiating inflammation in eyes expressing HEL (15). This system thus provides evidence to support the notion that pathogenic autoimmunity could be initiated by microbial products that function as TLR ligands (see Introduction). In the present study we analyzed the different patterns of involvement of Th1 and Th17 in the pathogenic processes triggered by four different TLR ligands.
We compared the proportions of donor and host Th1 and Th17 cells in both the eyes and spleen of the recipient mice, according to the expression of intracellular IFN-γ and IL-17, respectively. Tracing the donor cells in the recipients revealed that a large portion of the transferred naïve cells home to the spleen, where they are activated by the Ag, HEL (15), and are polarized by the cytokine milieu they are exposed to. Differences among the four groups in the proportions of cells acquiring the phenotypes of Th1 or Th17 (Fig. 3) indicate that the four ligands we used varied in the cytokine milieu they created in the recipient mice.
The selective effects of the four TLR ligands on the polarization process of in vivo-activated naïve CD4 cells, as shown here with the HEL system, were reproduced in another experimental system in which ovalbumin-specific TCR Tg cells from OTII donor mice were adoptively transferred into naïve B6 mice. The pattern of selective polarization of Th1 and Th17 cells in mice treated with the four ligands closely resembled that seen here with the HEL system (data not shown).
The next phase of the pathogenic process includes the migration of activated and polarized Th cells out of the spleen and other lymphoid organs into the target tissue, the eye in our system. Not much is known about this phase, but it is conceivable that it exerts a certain level of preferentiality, that determines the proportions of Th1 and Th17 which invade the recipient mouse eye.
Remarkable differences were found among the four recipient groups with regard to the proportions of donor cells expressing the Th1 or Th17 phenotypes in the recipient eyes (Fig. 2). Predominance of Th17 was seen in eyes of recipients treated with LPS, in contrast to eyes of CpG and poly (I:C) recipients, with higher proportions of Th1. An even distribution of the two phenotypes was observed in recipients of PGN. These differences among eye infiltrating donor cells in the four recipient groups are more pronounced than those observed in the corresponding mouse spleens (Fig. 3). In addition to the possible phenotype selectivity during the migration of activated Th cells into the eye, mentioned above, we suggest that the eye invading donor cells undergo an additional phase of activation/polarization in the recipient eye. These cells, with specificity toward HEL, are presumably reactivated by their target Ag in the recipient eye and simultaneously, are polarized by the cytokine milieu of the recipient eye.
The TLR ligands are administered intravenously and trigger rapid production of polarizing cytokines by cells of various cell tissues. A portion of these cytokines are secreted and could be measured in serum samples (Fig. 4). An excessive production of IL-6 was observed in the serum of mice treated with LPS; profoundly lower levels of IL-6 were produced by mice treated with the other TLR ligands. IL-6 is a cytokine crucial for polarization toward the Th17 phenotype (36) and mice treated with LPS were also superior to mice of the other treatment groups in their preferentially high levels of Th17 cells in their spleen and eyes (Figs. 2 and 3). Our data also indicate that the superiority of LPS in promoting Th17 differentiation is due at least in part to its preferential activation of B cells, resulting in higher levels of released IL-6 (Fig. 5 A, B). This observation sheds new light on the mode of action of LPS and is in accord with a recent publication showing that B-cells participate in the pathogenic processes of autoimmune diseases, mainly by producing high levels of IL-6 (37). LPS is a strong stimulant for a variety of other cytokines and mice treated with this agent also produced high levels of IL-12p70, a major polarizing cytokine for Th1, and developed large populations of these cells (Figs. 2 and 3).
The relationship between the serum cytokine profile and generation of Th1 by mice treated with the four TLR ligands was found, however, to be complicated, with different patterns of association between the injected ligands and the Th phenotype profiles (Figs. 2 and 3). We suggest that the complexity is due to the involvement of two different cytokines in the polarization of the Th1 subpopulation, namely, IL-12 and IFN-α (22–25). The highest prevalence of Th1 cells was found in mice treated with CpG, that produced moderate serum levels of both IL-12p70 and IFN-α (Fig. 4). Unlike CpG, treatment with poly (I:C) stimulated only high levels of IFN-α, but undetectable levels of IL-12p70 (Fig. 4). The association between poly (I:C) and IFN-α was indicated by the study of Longhi et al (23) and our observations suggest that generation of Th1 in poly (I:C)-treated mice could be entirely attributed to increased production of IFN-α, whereas both IL-12 and IFN-α are involved in the preferential generation of Th1 cells in CpG-treated mice.
Another issue we addressed in this study concerns the potential involvement of Treg cells in the pathogenic processes triggered by the TLR ligands. The population of donor TCR-Tg CD4 cells contained a very low proportion of Foxp3+ Treg cells (<1%), in line with published reports (33, 34). Following their homing to the spleen and activation by HEL, the proportion of Foxp3+ cells increased to ~5% (Fig. 6). We assume the majority of these Foxp3+ donor cells are induced Tregs (iTregs). Interestingly, the proportion of donor Foxp3+ cells was lower in spleens of mice treated with the four tested TLR ligands, as compared to PBS treated controls (Fig. 6), an observation similar to that made by Summers et al (38) in a system model of autoimmune glomerulonephritis. More research is needed to unravel the effect of TLRs on development of Treg cells. Donor Foxp3+ cells were also found among the eye infiltrating cells and, significantly, the proportions of these cells were lower in severely inflamed eyes of mice treated with LPS and CpG, as compared with less affected eyes of poly (I:C), or PGN-treated mice (Figs. 1 and 7). This observation thus suggests that the Ag-specific iTregs exerted a moderating effect on the inflammatory process in our system.
In addition to differences among the infiltrating Th cells, inflamed eyes of mice treated with the four TLR ligands varied in their populations of non-Th cells, namely, CD8, macrophages and PMNs (Fig. 8). These differences suggest that the milieus of cytokines, that determine the selective infiltration of Th subpopulations, are also responsible for the preferential migration of the non-CD4 cells into the inflamed eye. It is of note that a large portion of the inflammatory cell population expressed CD8, but no CD3. It is assumed that these CD8+ cells include DC and NK cells that express CD8. All these cells are affected by TLR ligands (39, 40). Our finding that PGN selectively promotes CD8 cells is in accord with the report of Cottalorda et al., that treatment with another TLR2 ligand, Pam3CysSK4, enhances activation of CD8 cells (41).
The flow cytometric analysis recorded in Fig. 8 also shows a separation between two populations of cells, expressing low or medium levels of Gr-1. We assume the Gr-1 “low” cells are mainly macrophages, in line with the data of Zehntner et al. (42). We also suggest that the Gr-1 “medium” population consists of immature PMNs and some macrophages.
In summary, this study provides new data concerning the process whereby microbial products, that function as ligands for TLRs, trigger differentiation of naïve CD4 cells into pathogenic T-helper cells. Analysis of the newly generated effector cells revealed that the different tested TLR ligands varied in their activity, generating different proportions of Th1 and Th17 among the cells that acquired pathogenic capacity and initiated inflammation. These findings shed new light on the mechanism of autoimmune inflammation triggered by microbial infection and provide new strategies for their prevention and treatment.
Acknowledgments
We thank R. Steven Lee for tail DNA analysis, the National Eye Institute Flow Cytometry Core for technical support, and the Histology Core for tissue section preparations.
Abbreviations used in this paper
- Tg
transgenic
- HEL
hen egg lysozyme
- PGN
peptidoglycan
Footnotes
This research was supported by the Intramural Research Program of the National Eye Institute, NIH.
References
- 1.Mills KH. TLR-dependent T cell activation in autoimmunity. Nat Rev Immunol. 2011;11:807–822. doi: 10.1038/nri3095. [DOI] [PubMed] [Google Scholar]
- 2.Takeda K, Kaisho T, Akira S. Toll-like receptors. Annu Rev Immunol. 2003;21:335–376. doi: 10.1146/annurev.immunol.21.120601.141126. [DOI] [PubMed] [Google Scholar]
- 3.Lang KS, Recher M, Junt T, Navarini AA, Harris NL, Freigang S, Odermatt B, Conrad C, Ittner LM, Bauer S, Luther SA, Uematsu S, Akira S, Hengartner H, Zinkernagel RM. Toll-like receptor engagement converts T-cell autoreactivity into overt autoimmune disease. Nat Med. 2005;11:138–145. doi: 10.1038/nm1176. [DOI] [PubMed] [Google Scholar]
- 4.Akira S, Takeda K. Toll-like receptor signalling. Nat Rev Immunol. 2004;4:499–511. doi: 10.1038/nri1391. [DOI] [PubMed] [Google Scholar]
- 5.Liew FY, Xu D, Brint EK, O'Neill LA. Negative regulation of toll-like receptor-mediated immune responses. Nat Rev Immunol. 2005;5:446–458. doi: 10.1038/nri1630. [DOI] [PubMed] [Google Scholar]
- 6.van Heel DA, Ghosh S, Butler M, Hunt K, Foxwell BM, Mengin-Lecreulx D, Playford RJ. Synergistic enhancement of Toll-like receptor responses by NOD1 activation. Eur J Immunol. 2005;35:2471–2476. doi: 10.1002/eji.200526296. [DOI] [PubMed] [Google Scholar]
- 7.Radstake TR, Roelofs MF, Jenniskens YM, Oppers-Walgreen B, van Riel PL, Barrera P, Joosten LA, van den Berg WB. Expression of toll-like receptors 2 and 4 in rheumatoid synovial tissue and regulation by proinflammatory cytokines interleukin-12 and interleukin-18 via interferon-γ. Arthritis Rheum. 2004;50:3856–3865. doi: 10.1002/art.20678. [DOI] [PubMed] [Google Scholar]
- 8.Visser L, Melief MJ, van Riel D, van Meurs M, Sick EA, Inamura S, Bajramovic JJ, Amor S, Hintzen RQ, Boven LA, ’t Hart BA, Laman JD. Phagocytes containing a disease-promoting Toll-like receptor/Nod ligand are present in the brain during demyelinating disease in primates. Am J Pathol. 2006;169:1671–1685. doi: 10.2353/ajpath.2006.060143. [DOI] [PMC free article] [PubMed] [Google Scholar]
- 9.Seibl R, Birchler T, Loeliger S, Hossle JP, Gay RE, Saurenmann T, Michel BA, Seger RA, Gay S, Lauener RP. Expression and regulation of Toll-like receptor 2 in rheumatoid arthritis synovium. Am J Pathol. 2003;162:1221–1227. doi: 10.1016/S0002-9440(10)63918-1. [DOI] [PMC free article] [PubMed] [Google Scholar]
- 10.Roelofs MF, Joosten LA, Abdollahi-Roodsaz S, van Lieshout AW, Sprong T, van den Hoogen FH, van den Berg WB, Radstake TR. The expression of toll-like receptors 3 and 7 in rheumatoid arthritis synovium is increased and costimulation of toll-like receptors 3, 4, and 7/8 results in synergistic cytokine production by dendritic cells. Arthritis Rheum. 2005;52:2313–2322. doi: 10.1002/art.21278. [DOI] [PubMed] [Google Scholar]
- 11.Roep BO. T-cell responses to autoantigens in IDDM. The search for the Holy Grail. Diabetes. 1996;45:1147–1156. doi: 10.2337/diab.45.9.1147. [DOI] [PubMed] [Google Scholar]
- 12.Torok HP, Glas J, Tonenchi L, Bruennler G, Folwaczny M, Folwaczny C. Crohn's disease is associated with a toll-like receptor-9 polymorphism. Gastroenterology. 2004;127:365–366. doi: 10.1053/j.gastro.2004.05.051. [DOI] [PubMed] [Google Scholar]
- 13.Leadbetter EA, Rifkin IR, Hohlbaum AM, Beaudette BC, Shlomchik MJ, Marshak-Rothstein A. Chromatin-IgG complexes activate B cells by dual engagement of IgM and Toll-like receptors. Nature. 2002;416:603–607. doi: 10.1038/416603a. [DOI] [PubMed] [Google Scholar]
- 14.Waldner H, Collins M, Kuchroo VK. Activation of antigen-presenting cells by microbial products breaks self tolerance and induces autoimmune disease. J Clin Invest. 2004;113:990–997. doi: 10.1172/JCI19388. [DOI] [PMC free article] [PubMed] [Google Scholar]
- 15.Fujimoto C, Yu CR, Shi G, Vistica BP, Wawrousek EF, Klinman DM, Chan CC, Egwuagu CE, Gery I. Pertussis toxin is superior to TLR ligands in enhancing pathogenic autoimmunity, targeted at a neo-self antigen, by triggering robust expansion of Th1 cells and their cytokine production. J Immunol. 2006;177:6896–6903. doi: 10.4049/jimmunol.177.10.6896. [DOI] [PubMed] [Google Scholar]
- 16.Goodnow CC. Multistep pathogenesis of autoimmune disease. Cell. 2007;130:25–35. doi: 10.1016/j.cell.2007.06.033. [DOI] [PubMed] [Google Scholar]
- 17.Strober W. Epithelial cells pay a Toll for protection. Nat Med. 2004;10:898–900. doi: 10.1038/nm0904-898. [DOI] [PubMed] [Google Scholar]
- 18.Reynolds JM, Pappu BP, Peng J, Martinez GJ, Zhang Y, Chung Y, Ma L, Yang XO, Nurieva RI, Tian Q, Dong C. Toll-like receptor 2 signaling in CD4(+) T lymphocytes promotes T helper 17 responses and regulates the pathogenesis of autoimmune disease. Immunity. 32:692–702. doi: 10.1016/j.immuni.2010.04.010. [DOI] [PMC free article] [PubMed] [Google Scholar]
- 19.Sutmuller RP, den Brok MH, Kramer M, Bennink EJ, Toonen LW, Kullberg BJ, Joosten LA, Akira S, Netea MG, Adema GJ. Toll-like receptor 2 controls expansion and function of regulatory T cells. J Clin Invest. 2006;116:485–494. doi: 10.1172/JCI25439. [DOI] [PMC free article] [PubMed] [Google Scholar]
- 20.Caramalho I, Lopes-Carvalho T, Ostler D, Zelenay S, Haury M, Demengeot J. Regulatory T cells selectively express toll-like receptors and are activated by lipopolysaccharide. J Exp Med. 2003;197:403–411. doi: 10.1084/jem.20021633. [DOI] [PMC free article] [PubMed] [Google Scholar]
- 21.Veldhoen M, Hocking RJ, Atkins CJ, Locksley RM, Stockinger B. TGF-β in the context of an inflammatory cytokine milieu supports de novo differentiation of IL-17-producing T cells. Immunity. 2006;24:179–189. doi: 10.1016/j.immuni.2006.01.001. [DOI] [PubMed] [Google Scholar]
- 22.Trinchieri G. Interleukin-12: a cytokine produced by antigen-presenting cells with immunoregulatory functions in the generation of T-helper cells type 1 and cytotoxic lymphocytes. Blood. 1994;84:4008–4027. [PubMed] [Google Scholar]
- 23.Longhi MP, Trumpfheller C, Idoyaga J, Caskey M, Matos I, Kluger C, Salazar AM, Colonna M, Steinman RM. Dendritic cells require a systemic type I interferon response to mature and induce CD4+ Th1 immunity with poly IC as adjuvant. J Exp Med. 2009;206:1589–1602. doi: 10.1084/jem.20090247. [DOI] [PMC free article] [PubMed] [Google Scholar]
- 24.Pulendran B. Modulating vaccine responses with dendritic cells and Toll-like receptors. Immunol Rev. 2004;199:227–250. doi: 10.1111/j.0105-2896.2004.00144.x. [DOI] [PubMed] [Google Scholar]
- 25.Yang R, Murillo FM, Cui H, Blosser R, Uematsu S, Takeda K, Akira S, Viscidi RP, Roden RB. Papillomavirus-like particles stimulate murine bone marrow-derived dendritic cells to produce alpha interferon and Th1 immune responses via MyD88. J Virol. 2004;78:11152–11160. doi: 10.1128/JVI.78.20.11152-11160.2004. [DOI] [PMC free article] [PubMed] [Google Scholar]
- 26.Barton GM, Medzhitov R. Control of adaptive immune responses by Toll-like receptors. Curr Opin Immunol. 2002;14:380–383. doi: 10.1016/s0952-7915(02)00343-6. [DOI] [PubMed] [Google Scholar]
- 27.Shi G, Cox CA, Vistica BP, Tan C, Wawrousek EF, Gery I. Phenotype switching by inflammation-inducing polarized Th17 cells, but not by Th1 cells. J Immunol. 2008;181:7205–7213. doi: 10.4049/jimmunol.181.10.7205. [DOI] [PMC free article] [PubMed] [Google Scholar]
- 28.Shi G, Ramaswamy M, Vistica BP, Cox CA, Tan C, Wawrousek EF, Siegel RM, Gery I. Unlike Th1, Th17 cells mediate sustained autoimmune inflammation and are highly resistant to restimulation-induced cell death. J Immunol. 2009;183:7547–7556. doi: 10.4049/jimmunol.0900519. [DOI] [PMC free article] [PubMed] [Google Scholar]
- 29.Chen J, Vistica BP, Takase H, Ham DI, Fariss RN, Wawrousek EF, Chan CC, DeMartino JA, Farber JM, Gery I. A unique pattern of up- and down-regulation of chemokine receptor CXCR3 on inflammation-inducing Th1 cells. Eur J Immunol. 2004;34:2885–2894. doi: 10.1002/eji.200425318. [DOI] [PubMed] [Google Scholar]
- 30.Bettelli E, Korn T, Oukka M, Kuchroo VK. Induction and effector functions of T(H)17 cells. Nature. 2008;453:1051–1057. doi: 10.1038/nature07036. [DOI] [PMC free article] [PubMed] [Google Scholar]
- 31.Reiner SL. Development in motion: helper T cells at work. Cell. 2007;129:33–36. doi: 10.1016/j.cell.2007.03.019. [DOI] [PubMed] [Google Scholar]
- 32.Hori S, Nomura T, Sakaguchi S. Control of regulatory T cell development by the transcription factor Foxp3. Science. 2003;299:1057–1061. [PubMed] [Google Scholar]
- 33.Jordan MS, Boesteanu A, Reed AJ, Petrone AL, Holenbeck AE, Lerman MA, Naji A, Caton AJ. Thymic selection of CD4+CD25+ regulatory T cells induced by an agonist self-peptide. Nat Immunol. 2001;2:301–306. doi: 10.1038/86302. [DOI] [PubMed] [Google Scholar]
- 34.Lambe T, Leung JC, Ferry H, Bouriez-Jones T, Makinen K, Crockford TL, Jiang HR, Nickerson JM, Peltonen L, Forrester JV, Cornall RJ. Limited peripheral T cell anergy predisposes to retinal autoimmunity. J Immunol. 2007;178:4276–4283. doi: 10.4049/jimmunol.178.7.4276. [DOI] [PubMed] [Google Scholar]
- 35.Panopoulos AD, Zhang L, Snow JW, Jones DM, Smith AM, El Kasmi KC, Liu F, Goldsmith MA, Link DC, Murray PJ, Watowich SS. STAT3 governs distinct pathways in emergency granulopoiesis and mature neutrophils. Blood. 2006;108:3682–3690. doi: 10.1182/blood-2006-02-003012. [DOI] [PMC free article] [PubMed] [Google Scholar]
- 36.Zhou L, Ivanov II, Spolski R, Min R, Shenderov K, Egawa T, Levy DE, Leonard WJ, Littman DR. IL-6 programs T(H)-17 cell differentiation by promoting sequential engagement of the IL-21 and IL-23 pathways. Nat Immunol. 2007;8:967–974. doi: 10.1038/ni1488. [DOI] [PubMed] [Google Scholar]
- 37.Barr TA, Shen P, Brown S, Lampropoulou V, Roch T, Lawrie S, Fan B, O'Connor RA, Anderton SM, Bar-Or A, Fillatreau S, Gray D. B cell depletion therapy ameliorates autoimmune disease through ablation of IL-6-producing B cells. The Journal of experimental medicine. 2012;209:1001–1010. doi: 10.1084/jem.20111675. [DOI] [PMC free article] [PubMed] [Google Scholar]
- 38.Summers SA, Steinmetz OM, Gan PY, Ooi JD, Odobasic D, Kitching AR, Holdsworth SR. Toll-like receptor 2 induces Th17 myeloperoxidase autoimmunity while Toll-like receptor 9 drives Th1 autoimmunity in murine vasculitis. Arthritis Rheum. 2011;63:1124–1135. doi: 10.1002/art.30208. [DOI] [PubMed] [Google Scholar]
- 39.Yang Q, Goding SR, Hokland ME, Basse PH. Antitumor activity of NK cells. Immunol Res. 2006;36:13–25. doi: 10.1385/IR:36:1:13. [DOI] [PubMed] [Google Scholar]
- 40.Beauchamp NM, Yammani RD, Alexander-Miller MA. CD8 marks a subpopulation of lung-derived dendritic cells with differential responsiveness to viral infection and toll-like receptor stimulation. Journal of virology. 2012;86:10640–10650. doi: 10.1128/JVI.01413-12. [DOI] [PMC free article] [PubMed] [Google Scholar]
- 41.Cottalorda A, Verschelde C, Marcais A, Tomkowiak M, Musette P, Uematsu S, Akira S, Marvel J, Bonnefoy-Berard N. TLR2 engagement on CD8 T cells lowers the threshold for optimal antigen-induced T cell activation. European journal of immunology. 2006;36:1684–1693. doi: 10.1002/eji.200636181. [DOI] [PubMed] [Google Scholar]
- 42.Zehntner SP, Brickman C, Bourbonniere L, Remington L, Caruso M, Owens T. Neutrophils that infiltrate the central nervous system regulate T cell responses. Journal of immunology. 2005;174:5124–5131. doi: 10.4049/jimmunol.174.8.5124. [DOI] [PubMed] [Google Scholar]


