

Abstract
Background
Although it is well known that many clinical and genetic factors have been associated with beta-amyloid deposition, few studies have examined the interactions of such factors across different stages of Alzheimer’s pathogenesis.
Methods
We used 18F-florbetapir F18 PET imaging to quantify neuritic beta-amyloid plaque density across four cortical regions in 602 elderly (55–94 years) subjects from the national ADNI biomarker study. Group comprised of 194 normal elderly, 212 early mild cognitive impairment [EMCI], 132 late mild cognitive impairment [LMCI], and 64 mild Alzheimer’s (AD).
Findings
In a model incorporating multiple predictive factors, the effect of apolipoprotein E ε4 and diagnosis was significant on all four cortical regions. The highest signals were seen in cingulate followed by frontal and parietal with lowest signals in temporal lobe (p<0.0001). The effect of apolipoprotein E ε4 (Cohen’s D 0.96) on beta-amyloid plaque density was approximately twice as large as the effect of a diagnosis of AD (Cohen’s D 0.51) and thrice as large as the effect of a diagnosis of LMCI (Cohen’s D 0.34) (p<0.0001). Surprisingly, ApoE ε4+ normal controls had greater mean plaque density across all cortical regions than ε4− EMCI and ε4− LMCI (p<0.0001, p=0.0009) and showed higher, though non-significant, mean value than ε4− AD patients (p<0.27). ApoE ε4+ EMCI and LMCI subjects had significantly greater mean plaque density across all cortical regions than ε4− AD patients (p<0.027, p<0.0001).
Interpretation
Neuritic amyloid plaque load across progressive clinical stages of AD varies strongly by ApoE4 genotype. These findings support the need for better pathology based and supported diagnosis in routine practice. Our data also provides additional evidence for a temporal offset between amyloid deposition and clinically-relevant symptoms.
Keywords: ApoE4, Alzheimer’s disease, 18F-florbetapir PET, beta-amyloid deposition
Introduction
Accumulation of amyloid-beta 42 (Aβ42) fibrils in the form of amyloid plaques is a neuropathological hallmark of Alzheimer’s disease (AD)23,39. While studies have shown that Aβ42 is markedly elevated in AD and have clarified many of the molecular steps involved23, it is still not fully known why or how this accumulation occurs. This is important since the degree of Aβ42 plaque in clinically diagnosed AD and MCI subjects is variable with some 30% of clinically diagnosed AD patients and half of MCI subjects failing to show significant Aβ42 plaques at autopsy and likewise about a third of cognitively normal elderly subjects show some degree of Aβ42 pathology at autopsy29. These findings suggest a need for better pathology-based and supported diagnoses, rather than clinical diagnostic groupings (such as probable AD or MCI) as a major determinant of Aβ42 pathology.
The introduction of PET ligands with high affinity and specificity to Aβ42 has made it easier to perform clinic-pathologic correlative studies2,6,20. An example of such a tracer is 18F-florbetapir6. A recent multicenter clinical-histopathologic validation study has shown a high correlation between florbetapir PET measurements in living subjects and autopsy measured Aβ42 pathology6. Florbetapir PET was recently approved by the FDA for clinical use as a diagnostic adjunct to assess the presence or absence of Aβ42 plaque. PET studies examining determinants of Aβ42 plaque build-up in late-life have linked it to a number of factors, though increasing age, memory impairments (e.g. MCI or AD) and apolipoprotein ε4 carrier status are the most consistently replicated findings1,2,5,6,7,8,9,10,13,15,16,17,18,19,20,22,24,25,27,28,30,31.
In this study, we analyzed florbetapir PET data from a national biomarker study (Alzheimer’s Disease Neuroimaging Initiative, ADNI)18,31 to examine the relative contribution of various factors and the effect of their interactions on the accumulation of regional cortical amyloid in 602 subjects across four stages of progressive cognitive impairment – normal controls (C, n=194), early mild cognitive impairment (EMCI, n=212), late MCI (LMCI, N=132), mild AD (N=64).
Methods
Study Design
Data used in the preparation of this article were obtained from the Alzheimer’s Disease Neuroimaging Initiative (ADNI) database (adni.loni.ucla.edu)31. The primary goal of ADNI has been to test whether serial magnetic resonance imaging (MRI), positron emission tomography (PET), other biological markers, and clinical and neuropsychological assessment can be combined to measure the progression of mild cognitive impairment (MCI) and early Alzheimer’s disease (AD). Determination of sensitive and specific markers of very early AD progression is intended to aid researchers and clinicians to develop new treatments and monitor their effectiveness, as well as lessen the time and cost of clinical trials. ADNI is the result of efforts of many co-investigators from a broad range of academic institutions and private corporations, and subjects have been recruited from over 50 sites across the U.S. and Canada.
All subjects, and guardians as appropriate, gave written informed consent and the study was approved by institutional ethics committees at each site. They include newly recruited and former participants of the three phases of ADNI including ADNI-1, ADNI-GO, and ADNI-2. ADNI-1 enrolled participants considered either normal, MCI, or AD. ADNI-GO then began and comprised of 200 subjects that could be diagnosed as early MCI (EMCI) to reflect even more discrete memory changes, when the patients display less rigorous logical memory cut-offs, but continue to meet other MCI criteria. Then, ADNI 2 enrolled around 550 subjects spanning the diagnoses of normal, EMCI, MCI, and AD. Florbetapir and cognitive measurements were obtained for all newly enrolled and continuing participants in ADNI-GO and ADNI2 and the cognitive measures taken closest to PET scan are used for this study. For up-to-date information, see www.adni-info.org.
Participants
The study population included 602 ADNI participants who received a florbetapir PET scan between May 2010 and March 2012. The 602 subjects received memory diagnoses prior to receiving an amyloid detecting PET scan which resulted in the diagnostic groups: 194 normal controls (C), 212 early mild cognitive impairment (EMCI), 132 late MCI (MCI), and 64 Alzheimer’s disease (AD) patients (see Table II). Complete details regarding inclusion/exclusion criteria can be found at www.adni-info.org. In summary, the subjects range in age from 55–94 years, had completed a minimum of 6 years of education, were fluent in Spanish or English, and did not have any other significant neurological disease. After complete description of the study to the subjects, written informed consent was obtained. MCI participants gave a subjective memory complaint with a Clinical Dementia Rating (CDR) of 0.5 and displayed a logical memory deficit were in the category of single- or multi-domain amnestic. The education-adjusted scores for the delayed paragraph recall subscore on the WMS-R Logical Memory II differentiated the EMCI group such that EMCI scores were between normals and MCI, but continued to display a CDR of 0.5. The CDR scores for Normal subjects were 0, and patients with AD met standard diagnostic criteria.
Table II. Effect Sizes for Clinical diagnosis, ApoE4 and Age on Florbetapir PET measured Regional Cortical Amyloid Burden.
The model was fitted as a linear mixed effects model using the nlme package in the R software platform. All comparisons are to the cingulate of an ApoE4− cognitively normal control subjects, thus the cingulate is not contained in the table since it serves as the arbitrarily chosen region of comparison. See Methods for details of fitted model. The estimates indicate the magnitude of differences from control group. Cohen’s D of 0.2 may be considered a small effect, 0.5 as a medium effect and 0.8 as a large effect but more precisely a Cohen’s D of 0.8 indicates a significantly larger non-overlap than a Cohen’s D of 0.2.
| Estimate | p-value | Cohen’s D | |
|---|---|---|---|
| (Intercept) | 0.11 | <0.0001 | 0.42 |
| AD | 0.14 | <0.0001 | 0.51 |
| EMCI | 0.05 | <0.0001 | 0.25 |
| LMCI | 0.07 | <0.0001 | 0.34 |
| Age | 0.001 | 0.63 | 0.04 |
| FRONTAL | −0.08 | <0.0001 | −1.36 |
| PARIETAL | −0.07 | <0.0001 | −1.14 |
| TEMPORAL | −0.14 | <0.0001 | −2.2 |
| APOE4 | 0.16 | <0.0001 | 0.96 |
| AD : Age | −0.01 | 0.04 | −0.17 |
| EMCI : Age | 0.01 | 0.01 | 0.22 |
| LMCI : Age | 0.002 | 0.39 | 0.07 |
| FRONTAL : Apoe4 | 0.01 | 0.003 | 0.14 |
| PARIETAL : Apoe4 | −0.002 | 0.68 | −0.02 |
| TEMPORAL : Apoe4 | −0.01 | 0.15 | −0.07 |
APOE Status
Sample collection and apolipoprotein E (APOE ε4) genotyping methods are described (www.ADNI.org). APOE data was missing for 16 subjects (4 N, 8 EMCI, 3 MCI, 1 AD) so these subjects were excluded from genetic analysis (Table II). A person was designated a carrier of APOE if they have one or two copies of allele 4 (heterozygous or homozygous 4), and noncarriers if they had no allele 4 in their genotype. We did not examine dose effects or examine each genotype separately due to insufficient numbers of homozygotes within NC and EMCI groups.
Florbetapir image acquisition and analysis
PET scans producing the imaging data were acquired 50–70 minutes following intravenous injection of 10 mCi (370 MBq) of 18F-florbetapir (Figure I). Details of PET scanners used in the study, imaging protocol and quality control measures have been published18. Images were spatially aligned, averaged, interpolated to a standard voxel size, and smoothed to a resolution of 8-mm full width at half maximum. In order to quantify florbetapir values, we used one or two structural 1.5 T or 3T MRI scans which were acquired within 12 months of the florbetapir PET scan to define cortical regions of interest (ROIs) and also the cerebellum reference region. For any subjects with unavailable MRI scans within a year of the florbetapir, the most recent scan was used. We used Freesurfer v. 4.5.0 (surfer.nmr.mgh.harvard.edu/) to segment and parcellate images into individual cortical regions of interest (frontal, anterior/posterior cingulate, lateral parietal, lateral temporal) so that the mean florbetapir uptake from grey matter relative to uptake in the whole cerebellum (white and grey matter) could be extracted. The ratio of ROI-to-whole cerebellum generates standard uptake value ratios (SUVRs) for each subject in the four florbetapir cortical regions. An average across the four regions (frontal, parietal, temporal, cingulate) compared to whole cerebellum accounts for the composite/global ratios for each subject. The specific regions comprising the ROIs can be found in Appendix I. Complete details on acquiring ADNI PET image data can be found online (adni.loni.ucla.edu/about-data-samples/image-data/), and details regarding processing are also described online (adni.loni.ucla.edu/research/pet-post-processing/) and at Landau S & Jagust W. Florbetapir processing methods. http://adni.loni.ucla.edu/wp-content/uploads/2011/03/ADNI_AV45_Methods_JagustLab_04.17.12.pdf.
Figure I. PET Scans Depicting Florbetapir Uptake for Each Diagnosis.
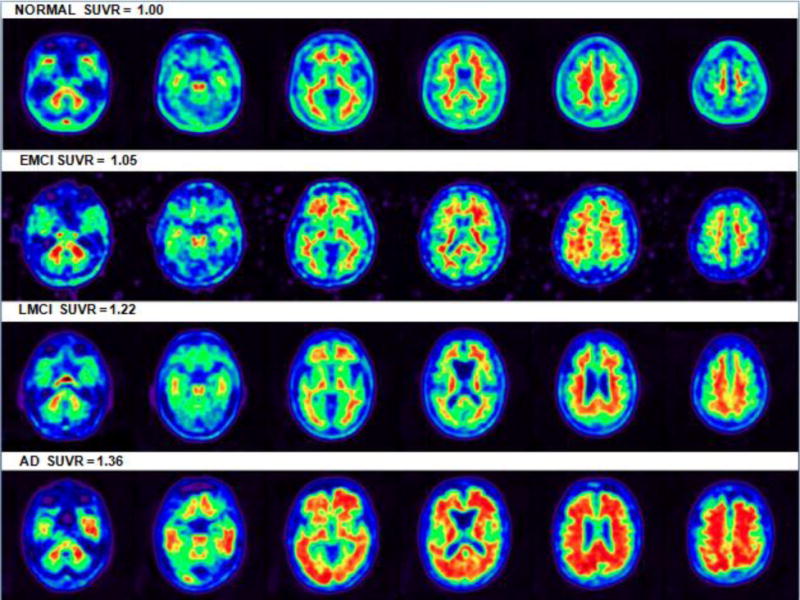
Axial brain slices of four florbetapir-PET subjects inferior to superior reflecting approximate median representations of amyloid deposition for each diagnosis. Images depicted in native space with white matter uptake seen to a degree in each subject. SUVR color images are depicted for illustration purposes only. (Note that the remnants of signal outside the EMCI slices are due to image reconstruction and should not be considered.)
Statistical analyses
We examined cross-sectional relationships between concurrent florbetapir-PET β-amyloid levels (global and regional), APOE carrier status, and clinical cognitive diagnosis and stage at scan (NC, EMCI, LMCI, AD). We considered a multivariate analysis involving all predictors in the dataset and their interactions. After stepwise deletion of non-significant terms, we determined the best fit model (R2 = 0.35, Equation I).
| Equation I |
Equation I: Where a is the baseline mean SUVR in the Cingulate region for a subject in the control group, of age 50 and ApoE4 non-carrier, pi is a random effect for the i-th patient, assumed to have a zero mean Gaussian distribution. Similarly aEI is the mean in someone the EMCI group (across all regions, across ApoE4 status and at Age 50) etc. b is the slope of the Age term in the control group, similarly bEI is the mean in the EMCI group etc. c is the effect of ApoE4, dFI is the effect of the Frontal region, d1FI is the interaction effect of the Frontal region and those who are ApoE4 positive. εi is measurement error in the i-th patients, assumed to have a zero mean Gaussian distribution. Cingulate was arbitrarily chosen as a comparison region. Due to repeated measurements (caused by multiple ROIs) on the same subject, the model was fitted as a linear mixed effects model using the nlme package in the R software platform. The log transformation was chosen because it makes the distribution of the errors approximately Gaussian in shape. Coefficients are given in Table II below. Our initial model (Equation 1) did not include gender but we also ran the same model subsequently with the addition of a term for gender and report those results.
Cohen’s D indicates effect size. Significance was determined by two-sided Wald tests. All statistical analysis was set two-tailed, p<0.05 a priori for terms in the multivariate. Pairwise comparisons between combinations of diagnostic class and ApoE allele were conducted using the two sample t-test. P-values were adjusted using Holm’s method for multiple comparisons (Holm, S. A simple sequentially rejective multiple test procedure. Scandinavian Journal of Statistics, 6, 65–70, 1979) and are shown in Table III.
Table III. Pairwise comparisons of Amyloid by Diagnosis and E4 status.
P-values for pairwise comparisons using the two sample t-test were adjusted for multiple comparisons as described in Methods. The directionality of the differences with means/sd are depicted in Figure 2 and shown by colors in the Table – Yellow indicates the row mean SUVR value is higher than column mean and green means column mean is higher than row mean. For example, in the first cell with a p-value, E4+ AD SUVR values are higher than E4− AD values so the p-value is colored yellow. The p-value for the comparison of E4+ EMCI versus E4− AD is shaded yellow since the EMCI group had higher mean values (p<0.027). These p-values differ slightly from p-values in Table 1 because they use a different statistic and are adjusted for multiplicity.
| AD− | AD+ | LMCI− | LMCI+ | EMCI− | EMCI+ | N− | |
|---|---|---|---|---|---|---|---|
| AD+ | <0.0001 | ||||||
| LMCI− | 0.2722 | <0.0001 | |||||
| LMCI+ | <0.0001 | 0.0005 | <0.0001 | ||||
| EMCI− | 0.0348 | <0.0001 | 0.1164 | <0.0001 | |||
| EMCI+ | 0.0274 | <0.0001 | <0.0001 | <0.0001 | <0.0001 | ||
| N− | 0.0014 | <0.0001 | 0.0001 | <0.0001 | 0.0247 | <0.0001 | |
| N+ | 0.2722 | <0.0001 | 0.0009 | <0.0001 | <0.0001 | 0.1164 | <0.0001 |
Results
Table I depicts the baseline demographics of the 602 subjects in this study. The diagnostic groups were reasonably close in terms of age and educational level and ApoE4 prevalence was highest in AD and lowest in NC. As expected there was a cognitive progression from NC to EMCI to LMCI to AD and likewise mean global amyloid SUVR values were highest in AD followed by LMCI, EMCI and NC (Table I, Figure I). Regional cortical SUVRs were highest in cingulate followed by frontal and parietal, and lowest in the temporal lobe (Table I).
Table I.
Characteristics of ADNI Florbetapir Study Sample
| N | EMCI | LMCI | AD | |
|---|---|---|---|---|
| Sample Size (n) | 194 | 212 | 132 | 64 |
| Age (mean/sd) | 77.0(6.1) | 71.3(7.5) | 75.8(7.9) | 75.8(8.4) |
| Age range (yrs) | 64–94 | 55–89 | 55–92 | 56–90 |
| Education years (mean/sd) | 16.3(2.8) | 15.9(2.6) | 16.1(2.8) | 16.2(2.8) |
| PET Global SUVR (means/sd) | 1.10(0.2) | 1.15(0.2) | 1.23(0.2) | 1.34(0.3) |
| PET Cingulate SUVR (means/sd) | 1.18(0.2) | 1.25(0.2) | 1.32(0.3) | 1.43(0.3) |
| PET Frontal SUVR (means/sd) | 1.08(0.2) | 1.15(0.2) | 1.23(0.2) | 1.35(0.3) |
| PET Parietal SUVR (means/sd) | 1.10(0.2) | 1.15(0.2) | 1.23(0.2) | 1.35(0.3) |
| PET Temporal SUVR (means/sd) | 1.03(0.2) | 1.07(0.2) | 1.15(0.2) | 1.25(0.2) |
| Gender ratio (M/F) | 1.00 | 1.30 | 1.59 | 1.56 |
| APOE ε4 status (ε4−/ε4+)* | 146/44 | 121/83 | 71/58 | 22/41 |
APOE data missing for 16 subjects (4 N, 8 EMCI, 3 MCI, 1 AD); they were omitted from genetic analysis.
In a linear mixed effects model with all variables, the effect of each clinical diagnosis stage (compared to controls) on amyloid SUVR levels was significant (p<0.0001 for all) (Table II, Figure I shows illustrative PET images). Each diagnostic stage also differs from the other in amyloid burden (p<0.036 to p<0.001) with the exception of the comparison of EMCI with LMCI (p<0.82). The difference between AD and control (estimate 0.14, p<0.0001) is roughly twice that of difference between LMCI and control (estimate 0.07, p<0.0001) and thrice that of difference between EMCI and control (estimate 005, p<0.0001) (Table I).
The effect of Apo E ε4+ on amyloid SUVR was highly significant (p<0.0001). As shown in Figure II, the stage-specific amyloid load is markedly different by genotype. E4+ AD subjects have higher SUVRs than all other groups (p<0.0005). However, ApoE ε4+ normal controls had highly significantly greater mean plaque density across all cortical regions than ε4− EMCI and ε4− LMCI (p<0.0001, p=0.0009) and showed higher, though non-significant, mean value than ε4−AD patients (p<0.27). Likewise, ApoE ε4+ EMCI and LMCI subjects had significantly greater mean plaque density across all cortical regions than ε4− AD patients (p<0.027, p<0.0001) (see Table III, all values adjusted for multiple comparisons). Lastly, the mean SUVR difference between ApoE ε4+ and ε4− AD subjects was greater than the difference between ApoE ε4+ AD and ε4+ control subjects. Relative effect sizes (Cohen’s D) for each of the variables showed that the effect size for ApoE4 (0.96) was almost twice as large as that of an AD diagnosis (0.51), thrice that of an LMCI diagnosis (0.34) and four times as much as an EMCI diagnosis (0.25).
Figure II.
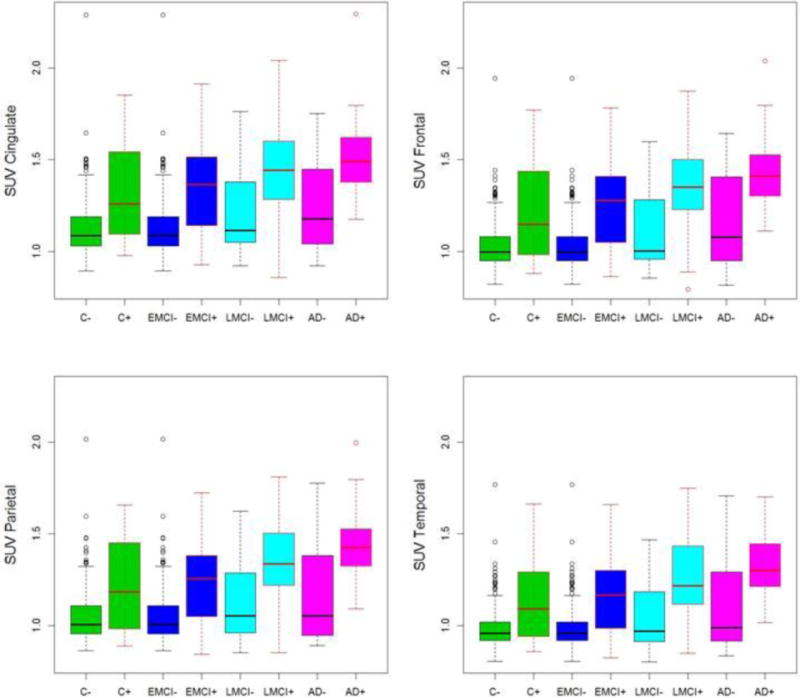
Box plot figures of beta-amyloid PET SUVR by diagnosis and E4 status in 4 cortical regions. As can be seen the effect of E4 status is far more striking than the effect of clinical diagnosis. For example, E4+ controls had higher mean SUVRs than E4− EMCI, E4− LMCI and E4− AD. E4+ MCI subjects had higher mean SUVRs than E4− AD. See methods and results for details of fitted models. The cingulate has the highest signal of the four regions across all groups.
The effect of age on SUVR was not significant (p<0.63) in this model but there were weak interactive effects for age in some diagnostic groups, notably AD (p<0.05). We also examined regional cortical SUVR differences by cognitive stage. Each of the cortical regional amyloid SUVRs differed from the other (p<0.001) with highest values in cingulate followed by parietal and frontal and lowest in the temporal lobes (Figure II, Table II). This difference was seen in all four cognitive/diagnosis stages. The interaction between regional SUVR and ε4+ status was significant for frontal lobe with increased SUVRs.
In the second model, which included all of the above terms plus gender, the effects of ApoE4 and diagnosis remained highly significant. The effect of gender was marginally significant (p=0.03) with women showing higher SUVRs than men.
Discussion
To our knowledge, this is the largest study to examine the effects of age and genotype on the growth (cross-sectionally) of regional cortical neuritic beta-amyloid deposition across the different cognitive stages leading to clinical AD. Although many studies have noted amyloid PET uptake differences between various diagnostic groups or between ApoE genotypes1,2,5,6,7,8,9,10,13,15,16,17,18,19,20,22,24,25,27,28,30,31, the key finding that distinguishes our study is the demonstration of the large magnitude of the effect of the ApoE4 allele relative to the effect of age or a clinical MCI or AD diagnosis, which has not been fully appreciated before. We found that ApoE ε4+ normal controls had significantly greater mean cortical plaque density than ε4− EMCI and LMCI and similar levels to ε4− AD patients. We also found that the mean difference between ApoE ε4+ and ε4− AD subjects was greater than the difference between ApoE ε4+ AD and ε4+ control subjects. Both these findings are striking and not previously reported. The effect size for ApoE4’s association with beta-amyloid (Cohen’s D 0.96) was much larger than and nonoverlapping with that of age.
Age has previously been considered a very strong predictor of amyloid deposition in prior pathology and imaging studies9,15,17,27,29, but our multivariate model suggests that age effects are small after covarying for ApoE4 and cognitive status. Fleisher et al. recently showed substantial age effects9. However, Fleisher et al. had two control groups – older controls (> 50 years) and younger (< 50 yrs) controls. For their age analyses, they combined both older normal (68+/−11 yrs) and younger normal (mean age 27 +/− 8 yrs) into a single group with an age range was 18–92 years. In our study, we used just the ADNI older control group, which has a much more restricted age range, since ADNI has no younger controls. Thus, our study may have been unable to show an age effect due to a population sample that is too old. In addition, the Fleisher study showed that age and APOE have spatially independent effects, as well as having age × APOE4 interactions, with age showing a more frontal predominant pattern than APOE4. The current study shows an interaction between APOE4 and SUVR in the frontal lobe, but did not test for the same interactions. Thus, differences in sampling and statistical methods may explain the different findings which will need to be resolved by future studies.
Our study also documents that there are regional differences in fibrillar amyloid plaque density with the highest levels in cingulate and lowest in temporal cortex, and that these differences are relatively stable across each of the diagnostic stages and genotypes, except for an interaction with frontal lobe where the ApoE4 effect was significant. To our knowledge, this is the first multicenter study to document such differences across the cognitive spectrum. The burden is 1% higher in the frontal lobe when the ApoE ε4+ is present. The magnitude of interaction effects between region and ApoE are small (relative to the main effects of diagnosis, region and ApoE ε4+), suggesting each region discriminates between the genotypes with relatively equal ability. Thus, fibrillar beta-amyloid, as detected by PET, increases relatively uniformly across each of the four cortical regions from the preclinical to prodromal to mild AD stages, suggesting that the spatial triggers for Aβ42 aggregation are already present in all four cortical regions long before the onset of clinical AD. Further, the presence of a relatively high amyloid density in the cingulate, supports functional MRI, SPECT and FDG-PET data pointing to regions within the cingulate as a site of early metabolic and connectivity dysfunction in AD14 as well as findings of high amyloid density in the cingulate in presenelin 1 mutation carriers11. We did not examine subregions with each main region in this report to avoid too many comparisons and risk of a Type 1 error, but this may be important to study further.
Overall, these results suggest that ApoE4 genetic information is a better predictor of amyloid pathology than age, gender or clinical diagnosis. It’s possible that the lower SUVRs seen in E4− AD patients may reflect an inaccurate diagnosis, lower levels of intrinsic pathology or both. Likewise the lower levels of pathology in E4− MCI subjects reflects the heterogeneous nature of MCI. Thus, our findings offer strong support for the need for a pathology based and supported diagnosis.
The use of a large carefully diagnosed and studied national sample of subjects,18,31 in addition to a well validated PET tracer florbetapir,6 are strengths of the study. The limitations of our study are the cross-sectional nature, use of largely academic research sites for this study, and potential for bias from variables not measured (such as other genes, vascular risk factors, soluble amyloid). Our use of the term “growth” is intended to reflect cross-sectional increases in SUVR across progressive diagnostic stages and we do not mean to say the slopes were different between ApoE groups. Clearly growth within a given subject or slope differences over time between groups can only be measured through longitudinal studies. Likewise we use the term “effect” as a statistical term rather than to imply cause and effect since our findings are associations. We also interpret our SUVR findings to imply changes in amyloid density but acknowledge that PET imaging is only a surrogate marker of pathology. Despite such limitations, our data are consistent with strong evidence that ApoE4 protein decreases cellular clearance of Aβ42 and enhances the stability of extracellular Aβ42 aggregates in brain4. These data are also consistent with prior imaging data from ApoE4+ normals 8,9,17, 22, 24 and familial AD mutation carriers3, and suggest a significant temporal offset between deposition of amyloid, functional disruption, and emergence of clinical symptoms12,21,26. Our data also suggests the variance in amyloid deposition in elderly subjects is not fully accounted for by ApoE4, suggesting a role for both non-genetic factors and yet to be identified genes consistent with a recent genetic study28.
Lastly, our data also show that genetic factors reflect a great deal of valuable information when evaluating a patient’s condition and direct measurement of pathology in-vivo, such as with florbetapir PET, may help us better study genetic-pathologic correlates. Such findings might be useful for clinicians to know as they implement amyloid imaging in routine practice. Our findings highlight the need for genotype-specific biomarker based pathologic classification of AD stages and suggest further that the ApoE4−associated amyloid plaque growth should be a major target for preventive therapy.
Highlights.
Effect of ApoE on β-amyloid was about twice the effect of an AD diagnosis.
Effect of ApoE on β-amyloid was thrice the effect of LMCI diagnosis.
ApoE ε4+ normals had greater amyloid across all cortical regions than ε4− EMCI/LMCI.
ApoE ε4+ EMCI and LMCI subjects had greater amyloid across cortical regions than ε4− AD.
Results provide guidance about the clinical interpretation of Abeta-PET.
Acknowledgments
Data collection and sharing for this project was funded by the Alzheimer’s Disease Neuroimaging Initiative (ADNI) (National Institutes of Health Grant U01 AG024904). ADNI is funded by the National Institute on Aging, the National Institute of Biomedical Imaging and Bioengineering, and through generous contributions from the following: Abbott; Alzheimer’s Association; Alzheimer’s Drug Discovery Foundation; Amorfix Life Sciences Ltd.; AstraZeneca; Bayer HealthCare; BioClinica, Inc.; Biogen Idec Inc.; Bristol-Myers Squibb Company; Eisai Inc.; Elan Pharmaceuticals Inc.; Eli Lilly and Company; F. Hoffmann-La Roche Ltd and its affiliated company Genentech, Inc.; GE Healthcare; Innogenetics, N.V.; IXICO Ltd.; Janssen Alzheimer Immunotherapy Research & Development, LLC.; Johnson & Johnson Pharmaceutical Research & Development LLC.; Medpace, Inc.; Merck & Co., Inc.; Meso Scale Diagnostics, LLC.; Novartis Pharmaceuticals Corporation; Pfizer Inc.; Servier; Synarc Inc.; and Takeda Pharmaceutical Company. The Canadian Institutes of Health Research is providing funds to support ADNI clinical sites in Canada. Private sector contributions are facilitated by the Foundation for the National Institutes of Health (www.fnih.org). The grantee organization is the Northern California Institute for Research and Education, and the study is coordinated by the Alzheimer’s Disease Cooperative Study at the University of California, San Diego. ADNI data are disseminated by the Laboratory for Neuro Imaging at the University of California, Los Angeles. This research was also supported by NIH grants P30 AG010129 and K01 AG030514.
PMD, TZW, SML and JRP have received research grants and/or advisory fees from several government agencies, advocacy groups and pharmaceutical/imaging companies. SML is a consultant for Avid Radiopharmaceuticals, Synarc, and Biogen Idec, and has consulted previously for Janssen AI. PMD received a grant from ADNI to support data collection for this study and he owns stock in Sonexa and Clarimedix, whose products are not discussed here.
APPENDIX I
Freesurfer delineation of cortical regions (frontal, angerior/posterior cingulate, lateral parietal, lateral temporal) was comprised of the following subregions, according to the Desikan atlas that is used in Freesurfer:
Frontal regions
ctx-lh-caudalmiddlefrontal, ctx-lh-lateralorbitofrontal, ctx-lh-medialorbitofrontal
ctx-lh-parsopercularis, ctx-lh-parsorbitalis, ctx-lh-parstriangularis, ctx-lh-rostralmiddlefrontal
ctx-lh-superiorfrontal, ctx-lh-frontalpole, ctx-rh-caudalmiddlefrontal, ctx-rh-lateralorbitofrontal
ctx-rh-medialorbitofrontal, ctx-rh-parsopercularis, ctx-rh-parsorbitalis, ctx-rh-parstriangularis
ctx-rh-rostralmiddlefrontal, ctx-rh-superiorfrontal, ctx-rh-frontalpole
Anterior/posterior cingulate regions
ctx-lh-caudalanteriorcingulate, ctx-lh-isthmuscingulate, ctx-lh-posteriorcingulate
ctx-lh-rostralanteriorcingulate, ctx-rh-caudalanteriorcingulate, ctx-rh-isthmuscingulate
ctx-rh-posteriorcingulate, ctx-rh-rostralanteriorcingulate
Lateral parietal regions
ctx-lh-inferiorparietal, ctx-lh-precuneus, ctx-lh-superiorparietal, ctx-lh-supramarginal
ctx-rh-inferiorparietal, ctx-rh-precuneus, ctx-rh-superiorparietal, ctx-rh-supramarginal
Lateral temporal regions
ctx-lh-middletemporal, ctx-lh-superiortemporal, ctx-rh-middletemporal
ctx-rh-superiortemporal
Footnotes
Publisher's Disclaimer: This is a PDF file of an unedited manuscript that has been accepted for publication. As a service to our customers we are providing this early version of the manuscript. The manuscript will undergo copyediting, typesetting, and review of the resulting proof before it is published in its final citable form. Please note that during the production process errors may be discovered which could affect the content, and all legal disclaimers that apply to the journal pertain.
References
- 1.Bahar-Fuchs A, Villemagne V, et al. Prediction of Amyloid-beta Pathology in Amnestic Mild Cognitive Impairment with Neuropsychological Tests. J Alzheimers Dis. 2012 doi: 10.3233/JAD-2012-121315. [DOI] [PubMed] [Google Scholar]
- 2.Barthel H, Gertz HJ, et al. Cerebral amyloid-beta PET with florbetaben (18F) in patients with Alzheimer’s disease and healthy controls: a multicentre phase 2 diagnostic study. Lancet Neurol. 2011;10(5):424–35. doi: 10.1016/S1474-4422(11)70077-1. [DOI] [PubMed] [Google Scholar]
- 3.Bateman RJ, Xiong C, et al. Clinical and biomarker changes in dominantly inherited Alzheimer’s disease. N Engl J Med. 2012;367(9):795–804. doi: 10.1056/NEJMoa1202753. [DOI] [PMC free article] [PubMed] [Google Scholar]
- 4.Castellano JM, et al. Human apoE isoforms differentially regulate brain amyloid-β peptide clearance. Sci Transl Med. 2011;3:89ra57. doi: 10.1126/scitranslmed.3002156. [DOI] [PMC free article] [PubMed] [Google Scholar]
- 5.Chetelat G, Villemagne VL, et al. Relationship between memory performance and beta-amyloid deposition at different stages of Alzheimer’s disease. Neurodegener Dis. 2012;10(1–4):141–4. doi: 10.1159/000334295. [DOI] [PubMed] [Google Scholar]
- 6.Clark CM, Schneider JA, Bedell BJ, et al. Use of florbetapir-PET for imaging beta-amyloid pathology. JAMA. 2011;305:275–283. doi: 10.1001/jama.2010.2008. [DOI] [PMC free article] [PubMed] [Google Scholar]
- 7.Doraiswamy PM, Sperling RA, et al. Amyloid-beta assessed by florbetapir F 18 PET and 18-month cognitive decline: A multicenter study. Neurology. 2012;79(16):1636–1644. doi: 10.1212/WNL.0b013e3182661f74. [DOI] [PMC free article] [PubMed] [Google Scholar]
- 8.Drzezga A, Grimme T, et al. Effect of APOE genotype on amyloid plaque load and gray matter volume in Alzheimer disease. Neurology. 2009;72(17):1487–94. doi: 10.1212/WNL.0b013e3181a2e8d0. [DOI] [PubMed] [Google Scholar]
- 9.Fleisher AS, Chen K, Liu X, et al. Apolipoprotien E ε4 and age effects on florbetapir positron emission tomography in healthy aging and Alzheimer disease. Neurobiol Aging. 2013;34(1):1–12. doi: 10.1016/j.neurobiolaging.2012.04.017. [DOI] [PubMed] [Google Scholar]
- 10.Fleisher AS, Chen K, et al. Using positron emission tomography and florbetapir F18 to image cortical amyloid in patients with mild cognitive impairment or dementia due to Alzheimer disease. Arch Neurol. 2011;68(11):1404–11. doi: 10.1001/archneurol.2011.150. [DOI] [PubMed] [Google Scholar]
- 11.Fleisher AS, Chen K, Quiroz YT, et al. Florbetapir PET analyses of amyloid depositon in the presenelin 1 E280A autosomal dominant Alzheimer’s disease kindred: a cross-sectional study. Lancet Neurology. 2012 doi: 10.1016/S1474-4422(12)70227-2. (Epub) [DOI] [PMC free article] [PubMed] [Google Scholar]
- 12.Frisoni GB. Alzheimer disease: biomarker trajectories across stages of Alzheimer disease. Nat Rev Neurol. 2012 May 8;8(6):299–300. doi: 10.1038/nrneurol.2012.81. [DOI] [PubMed] [Google Scholar]
- 13.Grimmer T, Tholen S, et al. Progression of cerebral amyloid load is associated with the apolipoprotein E epsilon4 genotype in Alzheimer’s disease. Biol Psychiatry. 2010;68(10):879–84. doi: 10.1016/j.biopsych.2010.05.013. [DOI] [PMC free article] [PubMed] [Google Scholar]
- 14.Huang C, Wahlund LO, Svennson L, Winblad B, Julin P. Cingulate cortex hypoperfusion predicts Alzheimer’s disease in MCI patients. BMC Neurology. 2002;2:9. doi: 10.1186/1471-2377-2-9. [DOI] [PMC free article] [PubMed] [Google Scholar]
- 15.Huang Y, Potter R, et al. Effects of age and amyloid deposition on Abeta dynamics in the human central nervous system. Arch Neurol. 2012;69(1):51–8. doi: 10.1001/archneurol.2011.235. [DOI] [PMC free article] [PubMed] [Google Scholar]
- 16.Jack CR, Jr, Vemuri P, et al. Shapes of the trajectories of 5 major biomarkers of Alzheimer disease. Arch Neurol. 2012;69(7):856–67. doi: 10.1001/archneurol.2011.3405. [DOI] [PMC free article] [PubMed] [Google Scholar]
- 17.Kantarci K, Lowe V, et al. APOE modifies the association between Abeta load and cognition in cognitively normal older adults. Neurology. 2012;78(4):232–40. doi: 10.1212/WNL.0b013e31824365ab. [DOI] [PMC free article] [PubMed] [Google Scholar]
- 18.Landau SM, Mintun MA, Joshi AD, et al. Amyloid deposition, hypometabolism, and longitudinal cognitive decline. Annals of Neurology. 2012 doi: 10.1002/ana.23650. (Epub). [DOI] [PMC free article] [PubMed] [Google Scholar]
- 19.Mosconi L, Rinne JO, et al. Increased fibrillar amyloid-{beta} burden in normal individuals with a family history of late-onset Alzheimer’s. Proc Natl Acad Sci U S A. 2010;107(13):5949–54. doi: 10.1073/pnas.0914141107. [DOI] [PMC free article] [PubMed] [Google Scholar]
- 20.Nordberg A, Rinne JO, Kadir A, Långström B. The use of PET in Alzheimer disease. Nat Rev Neurol. 2010;6:78–87. doi: 10.1038/nrneurol.2009.217. [DOI] [PubMed] [Google Scholar]
- 21.Pievani M, de Haan W, Wu T, Seeley WW, Frisoni GB. Functional network disruption in the degenerative dementias. Lancet Neurol. 10(9):829–43. 201. doi: 10.1016/S1474-4422(11)70158-2. [DOI] [PMC free article] [PubMed] [Google Scholar]
- 22.Reiman EM, Chen K, Liu X, Bandy D, Yu M, Lee W, et al. Fibrillar amyloid-beta burden in cognitively normal people at 3 levels of genetic risk for Alzheimer’s disease. Proc Natl Acad Sci USA. 2009;106(16):6820–5. doi: 10.1073/pnas.0900345106. [DOI] [PMC free article] [PubMed] [Google Scholar]
- 23.Selkoe DJ. Preventing Alzheimer’s disease. Science. 2012;337(6101):1488–92. doi: 10.1126/science.1228541. [DOI] [PubMed] [Google Scholar]
- 24.Small GW, Siddarth P, et al. Influence of cognitive status, age, and APOE-4 genetic risk on brain FDDNP positron-emission tomography imaging in persons without dementia. Arch Gen Psychiatry. 2009;66(1):81–7. doi: 10.1001/archgenpsychiatry.2008.516. [DOI] [PMC free article] [PubMed] [Google Scholar]
- 25.Sojkova J, Zhou Y, et al. Longitudinal patterns of beta-amyloid deposition in nondemented older adults. Arch Neurol. 2011;68(5):644–9. doi: 10.1001/archneurol.2011.77. [DOI] [PMC free article] [PubMed] [Google Scholar]
- 26.Sperling RA, Aisen PS, Beckett LA, et al. Toward defining the preclinical stages of Alzheimer’s disease: Recommendations from the National Institute on Aging and the Alzheimer’s Association workgroup. Alzheimers Dement. 2011;7:280–92. doi: 10.1016/j.jalz.2011.03.003. [DOI] [PMC free article] [PubMed] [Google Scholar]
- 27.Sperling RA, Johnson KA, et al. Amyloid deposition detected with florbetapir F 18 ((18)F-AV-45) is related to lower episodic memory performance in clinically normal older individuals. Neurobiol Aging. 2012 doi: 10.1016/j.neurobiolaging.2012.06.014. [DOI] [PMC free article] [PubMed] [Google Scholar]
- 28.Swaminathan S, Shen L, et al. Amyloid pathway-based candidate gene analysis of [(11)C]PiB-PET in the Alzheimer’s Disease Neuroimaging Initiative (ADNI) cohort. Brain Imaging Behav. 2012;6(1):1–15. doi: 10.1007/s11682-011-9136-1. [DOI] [PMC free article] [PubMed] [Google Scholar]
- 29.The National Institute on Aging and Reagan Institute Working Group on diagnostic Criteria for the neuropathological Assessment of Alzheimer’s disease. Neurobiology of Aging. 1997;18:S1–S2. [PubMed] [Google Scholar]
- 30.Vlassenko AG, Mintun MA, et al. Amyloid-beta plaque growth in cognitively normal adults: longitudinal [11C]Pittsburgh compound B data. Ann Neurol. 2011;70(5):857–61. doi: 10.1002/ana.22608. [DOI] [PMC free article] [PubMed] [Google Scholar]
- 31.Weiner MW, Aisen PS, Jack CR, Jr, et al. Alzheimer’s Disease Neuroimaging Initiative Alzheimer’s disease neuroimaging initiative: progress report and future plans. Alzheimer’s Dement. 2010;6:202–11. doi: 10.1016/j.jalz.2010.03.007. [DOI] [PMC free article] [PubMed] [Google Scholar]