
Figure 10.
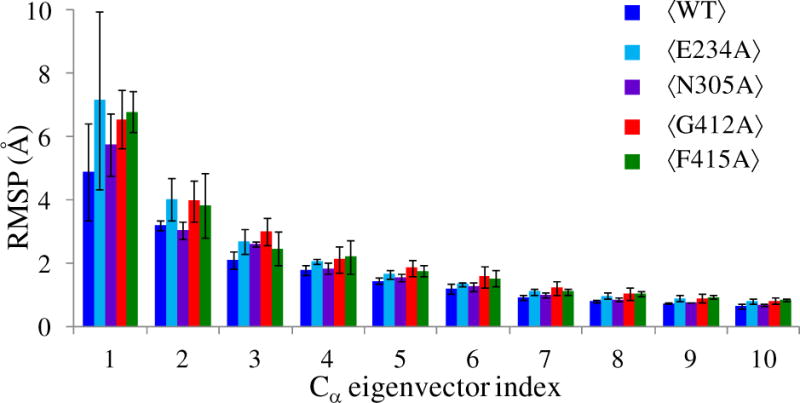
Analysis of root-mean-square projections (RMSP) of the PBL Cα atoms for WT ProRS and the four variant proteins. The angular bracket indicates that the RMSP values are averaged over the three replica simulations. These average RMSPs and standard deviations for eigenvectors 1 – 10 are shown.