

Abstract
During angiogenesis, endothelial cells (ECs) use both soluble and insoluble cues to expand the existing vascular network to meet the changing trophic needs of the tissue. Fundamental to this expansion are physical interactions between ECs and extracellular matrix (ECM) that influence sprout migration, lumen formation and stabilization. These physical interactions suggest that ECM mechanical properties may influence sprouting ECs and, therefore, angiogenic responses. In a three-dimensional angiogenic model in which a monolayer of ECs is induced to invade an underlying collagen matrix, angiogenic responses were measured as a function of collagen matrix stiffness by inducing collagen crosslinking with microbial transglutaminase (mTG). By biaxial mechanical testing, stiffer collagen matrices were measured with both mTG treatment and incubation time. Using two-photon excited fluorescence (TPF) and second harmonic generation (SHG), it was shown that collagen TPF intensity increased with mTG treatment, and the TPF/SHG ratio correlated with biaxially tested mechanical stiffness. SHG and OCM were further used to show that other ECM physical properties such as porosity and pore size did not change with mTG treatment, thus verifying that matrix stiffness was tuned independently of matrix density. The results showed that stiffer matrices promote more angiogenic sprouts that invade deeper. No differences in lumen size were observed between control and mTG stiffened matrices, but greater remodeling was revealed in stiffer gels using SHG and OCM. The results of this study show that angiogenic responses are influenced by stiffness and suggest that ECM properties may be useful in regenerative medicine applications to engineer angiogenesis.
Keywords: Angiogenesis, Second harmonic generation, Two-photon excited fluorescence, Collagen, Microbial transglutaminase
1. Introduction
Endothelial cells (ECs) stimulated by pro-angiogenic signals undergo a coordinated process in which ECs detach from the existing vessel wall, degrade and penetrate the underlying basement membrane, invade the surrounding three-dimensional (3D) extracellular matrix (ECM), and re-establish a vessel lumen to expand vascular networks. This process of angiogenesis is necessary for normal physiological growth and wound healing, but can also be co-opted to enable progression of diseases including psoriasis, rheumatoid arthritis and cancer [1]. Recent work has revealed how biochemical signals stimulate angiogenesis, particularly growth factors and lipids [2–4], and coordinate tip and stalk EC roles competitively and dynamically determined through lateral inhibition via the notch signaling pathway [5,6]. With this increased understanding, it has also become increasingly clear that the angiogenic processes of migration, proliferation and lumen formation are enabled through interactions with ECM [7,8] and, thus, recent attention has included how ECM physical properties and 3D organization may influence angiogenic responses.
ECM mechanical properties have been found to influence cell behavior, including ECs [9–12], smooth muscle cells [13–15], fibroblasts [10,16], macrophages [17], leukocytes [12,18] and stem cells [19,20]. Indeed, ECM stiffness has been found to correlate with aggressive malignancies and tumor cell proliferation [21,22]. Prominent cell responses to ECM stiffness include increased focal adhesions, cell stiffness [23,24] and cell traction forces [23–25]. Studies that characterize cell responses to ECM physical properties are most tractable in vitro and have been performed in both two-dimensional (2D) [26] and 3D systems [9,27–37]. However, in both synthetic and, especially, natural polymer ECM systems, studying biological responses to one ECM property (e.g., stiffness) while keeping other variables constant remains challenging. Previous works characterizing angiogenic responses to collagen [9,27,36,37] and fibrin matrices [30,31,33–35] with increasing densities would be expected to also vary in mechanics, porosity and ligand density. Here, angiogenic responses to 3D ECM mechanical properties are studied by controlling collagen crosslinking enzymatically using microbial transglutaminase (mTG). mTG-treated collagen is characterized both mechanically using biaxial mechanical testing and optically using endogenous two-photon excited fluorescence (TPF) and second harmonic generation (SHG) with no change in ligand density. In addition, microstructural properties, such as porosity, are characterized using TPF and SHG microscopy on hydrated collagen matrices.
Collagen is a strong promoter of EC morphogenesis [29] and a common natural polymer, used for creating 3D matrices. Its microstructure, biophysical properties and gelation kinetics can be tuned by controlling concentration [38,39], temperature [40–42], ionic strength [38], phosphate content and pH [28,41,43] during fibrillogenesis. In addition, the self-assembly of non-centrosymmetric molecules into higher-order structures (fibers) with long-range molecular order satisfies conditions for SHG facilitating non-invasive microscopic imaging of collagen with high sensitivity and specificity [44–50]. A common approach to changing collagen stiffness without changing density has been to induce crosslinking physically [51–53], chemically (e.g., glutaraldehyde [41,54] and carbodiimide [55]), enzymatically (tissue transglutaminase, tTG [56,57], mTG [58,59], lysyl oxidase [60]) and non-enzymatically (glycation [61–63]). Here, mTG was chosen to work with over other physiologic enzymes tTG and lysyl oxidase, because its activity is Ca2+ independent, it has a higher reaction rate, and it has broader substrate specificity [64,65]. mTG was used with the 3D angiogenesis culture model [4] in which a monolayer of ECs is induced to invade an underlying collagen matrix.
With the 3D culture model, the present study measured the formation of more angiogenic sprouts from the monolayer that invaded deeper and exhibited greater matrix remodeling during lumenogenesis in mTG-treated compared with control collagen matrices. With mechanical testing and multimodal microscopy, it was shown that these measured angiogenic responses are due to stiffening of the underlying collagen matrix independent of its microstructural properties. With biaxial mechanical testing, it was shown that mTG-induced crosslinking dose-dependently stiffened collagen mechanical properties. SHG and optical coherence microscopy (OCM) in hydrated collagen matrices also showed that there were no significant changes in microscopic properties of porosity and pore size with mTG treatment.
2. Materials and methods
2.1. Reagents and chemicals
Type I rat-tail collagen was obtained from BD Biosciences (San Jose, CA). Recombinant human vascular endothelial growth factor (VEGF) and fibroblast growth factor-2 (FGF-2) were purchased from R&D Systems (Minneapolis, MN). Medium 199 (M199) and fetal bovine serum (FBS) were purchased from Invitrogen (Grand Island, NY). Tumor promoting antigen (TPA, phorbol 12-myristate 13-acetate) and ascorbic acid (AA) were purchased from Sigma (St. Louis, MO). Sphingosine-1-phosphate (S1P) was purchased from Avanti Polar Lipids (Alabaster, AL). Microspheres for mechanical testing measurements were purchased from Cospheric (Santa Barbara, CA), and a stock solution was prepared at 2 mg ml−1 in 70% methanol.
ACTIVA WM, a gift from Ajinomoto (Japan), was derived from Streptoverticillium mobaraense. mTG has a high specific activity to crosslink collagen over a wide range of temperatures and pH, and its activity is Ca2+ independent. To purify mTG, ACTIVA WM was dissolved in ice-cold 50 mM sodium phosphate buffer (pH 6.0) and then dialyzed against 20 mM sodium acetate (pH 5.5) three times at 12 h intervals before centrifugation at 3000g for 30 min to collect the supernatant. Supernatant was loaded to a 50 ml SP Sepharose (Sigma) column with a continuous flow rate of 5 ml min−1. The column was washed and protein eluted at the same flow rate with a 0–500 mM NaCl gradient in 20 mM sodium acetate buffer (pH 5.5). Fractions containing mTG were analyzed with SDS–PAGE gels stained with 0.3% Coomassie blue in 30% methanol and 10% acetic acid. Fractions containing 39 kDa protein were pooled and dialyzed against distilled water three times at 12 h intervals. Dialyzed product was lyophilized, weighed and dissolved with M199. Final concentration was determined with a BCA protein assay (Pierce) and stored at −70 °C.
2.2. Cell culture
Primary human umbilical vein ECs were purchased from Lonza and used at passage 2–6. ECs were grown on gelatin-coated tissue culture flasks (1 mg ml−1) in culture media of M199 containing 15% FBS, 400 μgml−1 bovine hypothalamic extract [66], 100 μg ml−1 heparin (Sigma), 0.1% gentamycin and 1% penicillin/streptomycin (Invitrogen). Cells were passaged once a week. EC lines stably expressing enhanced green fluorescent protein (EGFP) were generated using a recombinant lentivirus system (Invitrogen) [8].
2.3. Collagen gel for optical and mechanical properties measurement and angiogenic evaluation
Fibrous collagen gels were formed with rat tail type I collagen, 5× Dulbecco’s modified Eagle’s medium and reconstitution buffer and neutralized with 1 M NaOH [50] and mTG to create 3.5 mg ml−1 collagen matrices with final mTG concentrations of 0, 100 and 500 μgml−1. Acellular collagen gels, used for optical and mechanical properties measurements, were formed within a cruciform-shaped mold. After washing 3 ml microspheres in PBS twice and removing the supernatant, beads were resuspended in 5 ml of ice-cold collagen–mTG mixture. This solution was placed within the cruciform-shaped mold inside the incubator for 12 h for polymerization. The acellular gels were covered with 200 ml M199 prior to imaging with the TPF–SHG–OCM combined system and mechanical testing with the biaxial bioreactor.
For EC invasion studies, 80 μl collagen–mTG mixtures containing 1 μM S1P were polymerized in a humidified 96-well plate at 37 °C and 5% CO2 incubator for 12 h, then covered with 160 μl M199 for an additional 24 h. After washing three times with 160 μl M199 at 10-min intervals, 3D angiogenesis invasion assays were initiated by seeding an EC monolayer on the 3D collagen surface with a cell density of 7 × 10⁴ per well of a 96-well plate in serum-free M199 containing reduced serum supplement II (RSII) [67], recombinant VEGF (40 ng ml−1), recombinant FGF (40 ng ml−1), AA (50 μgml−1) and TPA (50 ng ml−1). Angiogenesis invasion assays were performed on “day 1” collagen gels. Cultures were allowed to proceed for the times indicated before fixing in 4% paraformaldehyde in phosphate buffered saline (PBS) prior to imaging.
2.4. Non-linear optical microscopy–optical coherence microscopy (NLOM–OCM) combined system
2.4.1. System setup
The custom-built NLOM–OCM combined system capable of simultaneous TPF, SHG and OCM imaging has been described previously [68]. Briefly, dispersion-compensated sub-10-fs pulses (800 nm, full width at half maximum = 133 nm) from a Ti:Al2O3 oscillator (Femtosource, Femtolasers) pumped by a Nd:YVO4 solid state laser (Verdi, Coherent) were split by a 10/90 beam splitter. One beam (sample arm) was coupled into the epi-fluorescence port of an upright microscope (Axioskop2 MAT, Carl Zeiss GmBH) via dual-axis galvanometer-driven mirrors (Model 6220, Cambridge Technology) mounted on an elevated breadboard, and the other beam was used as a reference arm. The beam of the sample arm was directed to the microscope objective by a short pass dichroic mirror (635dcspxruv3p, Chroma). Non-linear optical signals were collected by the 40× focusing objective (NA = 0.8) and directed to a custom-built two-channel detector unit mounted on one of the dual accessory ports of the binocular head. The detector unit housed two dichroic mirrors and bandpass filters (Chroma), focusing lenses (PCX, focal length: 50 mm, 31 2321, Linos Photonics), and a pair of photon-counting photomultiplier tubes (R7400P, Hamamatsu). Appropriate long pass dichroic mirrors and bandpass filters were used for SHG (430dcxru and HQ405/40, respectively; Chroma) and TPF detection (580dcxr and HQ480/40, respectively; Chroma). Each photomultiplier tube was connected to a preamplifier/discriminator (F-100T, Advanced Research Technologies) that thresholded signal current and converted to TTL pulses for photon counting. Image intensities were displayed in photon counts on a PC (Optiplex GX280, Dell). For simultaneous OCM acquisition, back-scatter laser light in the sample arm was combined with return light from the reference arm, focused into single mode optical fiber, and directed into a home-made spectrometer for Fourier domain detection. Throughout this experiment, <40mWof laser power was incident on the scanning mirrors, ~10mW at the sample. The NLOM– OCM combined system is sensitive to endogenous collagen signals TPF and SHG, enabling simultaneous visualization of both for better characterization of the collagen non-linear optical properties. Collagen TPF has previously been shown to correlate with crosslinking [69], of which one fluorescent crosslink is reportedly pryridinoline [70]. Collagen SHG results from the mixing of light within its quasi-crystalline structure and is thus sensitive to molecular symmetry and long-range order of collagen structures [49,50].
2.4.2. Image acquisition and analysis
Samples of cruciform-shaped acellular collagen gels or of 3D angiogenesis assays were imaged without stains using the NLOM–OCM combined system rendering en face, 2D images integrated over four scans at each focal depth. A stack of images was generated by incrementally changing the depth of focus. For acellular matrices, five image stacks were acquired at least 1 mmapart, and each stack contained 10 images in depth from 10 to 100 μm below the gel surface. For 3D angiogenesis assays, image stacks with 5 μm increment were acquired from structures containing lumens from monolayer to sprout tip. SHG, TPF and OCM signals were collected simultaneously. Image files acquired from NLOM were converted from 16-bit to 8-bit files via MATLAB by scaling the maximum pixel value to 255.
2.4.3. Optical and microstructural properties of acellular matrices
A fuzzy thresholding algorithm written with MATLAB code was applied to SHG images to create binary masks of collagen fibers. The automated MATLAB algorithm included steps for increasing dynamic range with intensity transformation and for smoothing images with fuzzy transformation. Based on histograms of smoothed images, a binary mask was created that corresponded to collagen fibers [71]. The binary mask of SHG (collagen fibers) was used to quantify porosity, pore size and pore number. A negative binary mask was used to highlight void regions or pore locations, and porosity was calculated by taking the ratio of void region pixel number to total pixel number (256 × 256), resulting in a value between 0 and 1. The number of void regions was reported as the pore number. Pore size was calculated by converting the void region pixel number into actual area in units of square micrometers.
The binary mask of collagen SHG was multiplied by SHG and TPF images of acellular matrices to quantify its optical properties. Thus, in calculating the intensities and ratio of TPF to SHG in collagen gels as a function of mTG treatment, only signals from collagen fibers were used for quantification. In addition to experimental parameters such as laser power, PMT voltage, SHG and TPF intensities acquired from different imaging sessions were normalized to noise measured in void regions. Optical properties, including SHG mean, TPF mean and SHG/TPF ratio, were calculated after accounting for this background noise. SHG and TPF mean were calculated by their total intensities divided by the total number of pixels occupied by collagen. TPF/SHG ratio was similarly calculated on a per (collagen occupied) pixel basis.
2.4.4. Lumen area and collagen intensity ratio
Image processing algorithms used to create collagen SHG binary masks were also applied to TPF images to identify EC lining lumens. The combination of collagen SHG and EC TPF binary masks was used to generate continuous outlines of lumens of interest. The enclosed area was used to calculate lumen size in units of square micrometers. Collagen intensity ratio (CIR) from SHG and OCM was calculated by taking the ratio of average signal intensities from around the lumen to that of the surrounding matrix [15].
2.4.5. Biaxial bioreactor for mechanical testing measurements
The cruciform-shaped gel was coupled to load bars of biaxial bioreactor filled with 1× PBS (Sigma). Force transducers (50 g, Honeywell) were integrated on each axis of the bioreactor. The bioreactor was mounted onto the testing platform coupled to four computer-controlled stepper motors, and positioned beneath a CCD camera to trace tissue-embedded microsphere movements for strain measurements [72,73]. Reported stress–strain curves were acquired after preconditioning the tissue sample through three equibiaxial stretch cycles.
2.4.6. Transmitted light microscopy image acquisition and quantification
The 3D angiogenesis cultures were fixed in 3% glutaraldehyde in PBS and stained with toluidine blue, as previously described [4]. Invading structure number per field of view (1 mm2) was acquired with 10× objective. To quantify the invasion distance, digital photographs of transverse sectioned cultures were acquired with an Olympus CKX41 microscope equipped with a Q color 3 Olympus camera. The invasion distance and lumen diameter were measured using Image Pro Analyzer software.
3. Statistics
Student’s t-tests were used in evaluating the results of the optical and microstructural properties and angiogenic responses from the control and experiment. A P-value <0.05 was considered a significant difference. Significant differences are labeled or tabulated in Figs. 2, 6 and 8, and Appendix Figs. A1 and A3.
Fig. 2.

TPF/SHG ratio correlates with mTG dose and incubation time. (A) Representative TPF and SHG images of control and mTG-treated acellular collagen ECM at day 1 and day 7. (B) TPF/SHG ratio of collagen as a function of mTG dose treatment and incubation time. In the statistics table, black regions represent significant difference with P < 0.05. Error bars represent mean ± STD. Scale bar is 50 μm.
Fig. 6.

Stiffer matrix promotes angiogenic invasion with more structures invading deeper into collagen gel. (A) Cross-sectional images of control, 100 and 500 μgml−1 mTG-treated cultures stained with toluidine blue at 48 h. Scale bar is 250 μm. Quantification of (B) invading structure number, (C) invasion distance and (D) lumen diameter in control, 100 and 500 μg ml−1 mTG-treated collagen gels at 48 h. Sample number n = 4 gels in (B), n = 130, 101, 149 structures in (C) and n = 53, 37, 46 structures in (D) for control, 100, 500 μgml−1 mTG-treated gels, respectively. Symbol * represents P < 0.05.
Fig. 8.

Greater matrix remodeling is observed during lumenogenesis in stiffer matrices. Bar graph of (A) lumen area, (B) lumenal CIR and (C) CIR normalized by lumen area in control and mTG-treated cultures. (D) Correlative plot of OCM and SHG derived CIR showing correspondence between linear and non-linear optical signals. Error bars represent mean ± SE. Sampling number n = 35, 25, 50 in (A, B) and n = 304, 218, 503 in (C) for control, 100 and 500 μgml−1 mTG, respectively. Symbol * represents P < 0.05.
4. Results
4.1. Non-linear mechanical and optical properties of mTG crosslinked collagen matrices
This study sought to characterize angiogenic responses to changes in 3D collagen matrix stiffness while keeping density constant. To accomplish this, 3.5 mg ml−1 collagen gels were crosslinked with mTG, and it was reasoned (and later confirmed) that, by holding the density constant, other microstructural properties such as porosity would not change. Cruciform-shaped collagen gels (3.5 mg ml−1) were mechanically tested in the custom biaxial bioreactor. From these tests, first Piola–Kirchhoff (nominal) stress as a function of engineering strain is plotted in Fig. 1 for collagen gels treated with mTG (control, 100, 500 μgml−1) and incubated with M199 for 1 (Fig. 1A), 2 (Fig. 1B) and 7 days (Fig. 1C). The mechanical testing curves exhibited non-linear and viscoelastic responses characteristic of soft tissues. For each day, stress to induce 5% strain increased with mTG dose (which saturated with doses over 500 μgml−1; data not shown), and stress increased with each day of measurement. Collagen gels treated with 500 μgml−1 mTG were consistently stiffer than all other treatment groups. On day 1, stresses at 5% strain were 0.45, 0.59 and 0.89 kPa for control, 100 and 500 μgml−1 mTG-treated collagen gels, respectively (see Fig. 1A). On day 2 (Fig. 1B), stresses at 5% strain were 0.50, 0.55 and 1.13 kPa for control, 100 and 500 μgml−1 mTG, respectively, indicating an increase in load bearing for control as well as mTG-treated gels. On day 7, these trends continued with stresses at 5% strain of 0.91 and 2.47 kPa for control and 500 μg ml−1 mTG-treated gels, respectively.
Fig. 1.

Biaxial mechanical tests on acellular cruciform-shaped collagen gels revealed non-linear viscoelastic response curves with larger loads for higher mTG doses and incubation times. First Piola–Kirchhoff stress (kPa)–engineering strain curves of control and mTG-treated collagen gels tested on (A) day 1, (B) day 2 and (C) day 7. Note changes in scale of first Piola–Kirchhoff stress (kPa) axes.
SHG and TPF images of acellular collagen matrices were acquired at days 1 and 7 of control and mTG-treated gels (Fig. 2A). Under each condition, collagen TPF intensity was noticeably higher on day 7 than on day 1, especially comparing image signal to noise. Quantification of SHG and TPF images revealed that TPF and TPF/SHG was enhanced in mTG-treated gels with doses up to 500 μgml−1, but not SHG; see Fig. 2B (TPF, SHG data not shown). Consistent with the mechanical testing results, measurements of the TPF-to-SHG ratio increased from day 1 to day 7. On each day (day 1, day 2 and day 7), the TPF/SHG ratio increased with mTG dose and was highest for 500 μgml−1 mTG treatment (Fig. 2B) with a significant difference compared with the control. On day 1, TPF/SHG of acellular collagen increased from 0.083 ± 0.004 for control to 0.085 ± 0.003 and 0.115 ± 0.003 when treated with 100 and 500 μg ml−1 mTG, respectively. On day 2, TPF/SHG exhibited a trend similar to day 1 with values of 0.081 ± 0.003 for control and 0.096 ± 0.005 and 0.119 ± 0.006 for 100 and 500 μgml−1 mTG-treated gels, respectively. The most prominent difference in collagen TPF/SHG ratio was observed at day 7, where TPF/SHG values nearly doubled from day 1. Collagen TPF/SHG ratios measured on day 7 were 0.142 ± 0.007, 0.153 ± 0.005 and 0.212 ± 0.008 for control, 100 and 500 μgml−1 mTG-treated gels, respectively.
If the collagen TPF/SHG ratio did indeed correlate with collagen crosslinking, the optical measurements should correlate with the mechanical testing measurements. As an indicator of the collagen mechanical properties, load (g) at 5% stretch was used. Fig. 3 shows correlative plots of load (g) at 5% stretch with SHG (Fig. 3A), TPF (Fig. 3B) and TPF/SHG (Fig. 3C). Consistent with previous work [69], SHG was observed not to depend on collagen crosslinking and, thus, did not show a correlation with load at 5% stretch. Collagen TPF did show increased intensity with mTG treatment and mechanical properties, though its correlation coefficient with load at 5% stretch was weak (r = 0.666). Collagen TPF/SHG exhibited the highest correlation with load at 5% stretch with a correlation coefficient r = 0.918.
Fig. 3.
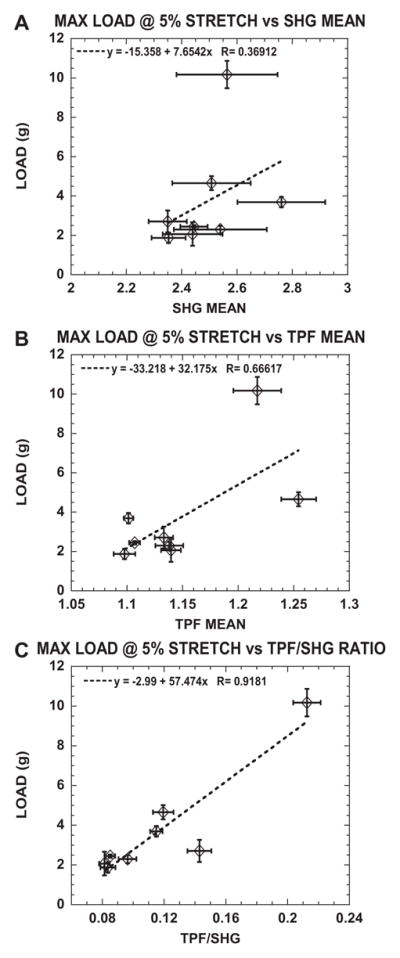
Load (g) at 5% stretch correlates well with TPF/SHG ratio compared with SHG mean and TPF mean measured in control and mTG-treated acellular cruciform-shaped collagen gels. Plots of load (g) at 5% stretch as a function of (A) SHG mean, (B) TPF mean and (C) TPF/SHG ratio.
4.2. Microstructural properties of collagen matrices remained unchanged with mTG treatment
Mechanical testing and NLOM experiments demonstrated that collagen non-linear mechanical and optical properties were modulated with mTG treatment. Gel microstructural properties were next characterized with SHG. Representative and processed SHG images are shown in Fig. 4 of control and 100 and 500 μg ml−1 mTG-treated collagen gels. Binary masks of collagen fibrous structures were obtained by applying fuzzy thresholding algorithms non-discriminately to all images (see Section 2). The negative of these masks was used to highlight gel porosity. These negative binary masks were used to further quantify the physical properties of porosity, pore size and pore number per unit area (see Fig. 5). Porosity is defined as the ratio of void to total area. Porosity was quantified for control and mTG-treated collagen gels and is shown in Fig. 5A. The bar graph reveals no significant difference in porosity compared with control, with values of 0.765 ± 0.050, 0.760 ± 0.034 and 0.764 ± 0.032 for control, 100 and 500 μg ml−1 mTG-treated gels, respectively. Pore sizes of control and 100 and 500 μg ml−1 mTG-treated collagen gels were quantified and are shown in the boxplot in Fig. 5B. Median pore sizes measured 14 μm2, and there were no differences between each group. Pore number was quantified under the same field of view (80 × 80 μm); see Fig. 5C. For control and 100 and 500 μgml−1 mTG-treated collagen gels, pore numbers were 253.7 ± 57.9, 258.8 ± 50.7 and 254.6 ± 47.5, respectively, with no significant difference from control.
Fig. 4.

Representative SHG images of control and mTG-treated collagen ECM (left column) used to create collagen matrix mask (middle column), which can be inverted to highlight matrix porosity (negative mask, right column). Scale bar is 50 μm.
Fig. 5.
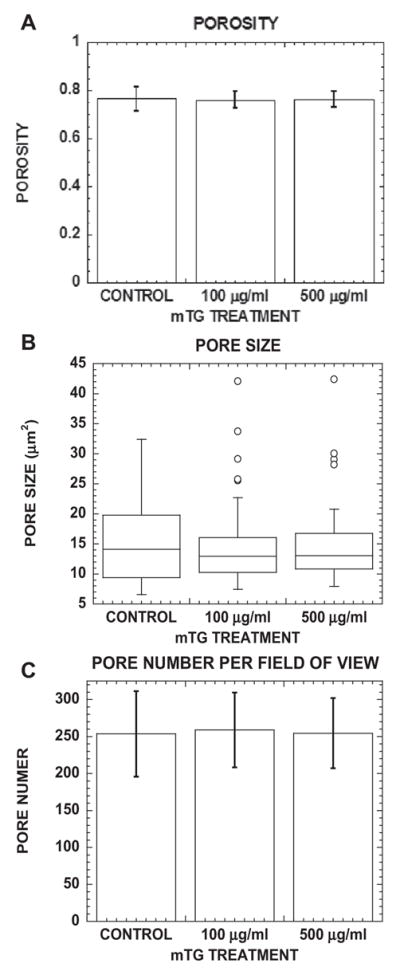
Porosity, pore size and pore number per field of view of collagen ECM do not change with mTG treatment. (A) Bar graph of porosity (void fraction), (B) boxplot of pore size and (C) bar graph of pore number per field of view in control and mTG--treated collagen ECM. Fifty SHG images were analyzed. Error bars in (A) and (C) represent mean ± STD.
4.3. Matrix stiffness influenced angiogenic responses
Increasing mTG dose and incubation time will induce collagen gels (3.5 mg ml−1) to bear higher loads without concurrent changes in microstructural properties. As an initial study, angiogenic responses to increased 3D collagen matrix stiffness independent of density and microstructural organization (e.g., porosity) were measured. These angiogenic responses were measured in “day 1” collagen gels. Monolayers of human umbilical vein EC were induced to undergo angiogenic morphogenesis, i.e., invade the underlying collagen gel and form lumens. After 48 h, cultures were fixed, stained with toluidine blue and sectioned transversely for cross-sectional views. Representative photographs of sectioned cultures from control, 100 and 500 μgml−1 mTG-treated collagen gels are shown in Fig. 6A and illustrate that stiffer matrices promoted angiogenic responses, including more invading structures and deeper invasion distances. The number of invading angiogenic structures was quantified using a 10× objective (~1mm2) and is shown in the bar graph in Fig. 6B. The highest number of invading structures was observed in collagen gels stiffened with 500 μgml−1 mTG (76.7 ± 3.2), which was significantly (statistically) greater than the number measured in control (59 ± 8.9) and 100 μgml−1 mTG-treated collagen gels (68 ± 6.1). Also, angiogenic sprouts invaded deeper in collagen matrices stiffened with 500 μgml−1 mTG (266.4 ± 94.2 μm) than controls (173.2 ± 66.5 μm) and 100 μgml−1 mTG (225.7 ± 74.1 μm), as shown in Fig. 6C. However, collagen gel stiffness did not appear to affect diameters of the lumens formed. There was no significant difference among lumen diameters formed in control (24.5 ± 14.4 μm), 100 μg ml−1 (20.7 ± 12.0 μm) and 500 μgml−1 (20.4 ± 12.1 μm) mTG-treated collagen gels, as shown in Fig. 6D.
4.4. Lumenogenesis in stiffer matrices resulted in more collagen matrix remodeling
It was shown previously that NLOM is capable of observing and quantifying EC–matrix interactions non-invasively without using stains or dyes [8]. In the previous study, collagen remodeling associated with lumenogenesis was observed, indicated by higher perilumenal collagen density than that of the surrounding collagen matrix. This elevated perilumenal collagen density was quantified as CIR and found to vary proportionally with lumen size. CIR was calculated by normalizing perilumenal collagen SHG intensity by that of the surrounding collagen matrix. Thus, CIR may be used as a measure of local collagen density (as a multiplicative factor of the surrounding matrix density) assuming no changes in collagen fiber diameters. In this study, CIR was measured as a function of matrix stiffness, and recently integrated OCM was used [68] to validate local measures of collagen density.
Angiogenic 3D cultures were imaged with NLOM–OCM after 72 h. Representative SHG, TPF and OCM images are shown in Fig. 7 of the lumen cross section formed within control and 100 and 500 μgml−1 mTG-treated collagen gels. SHG was used to specifically image collagen and its spatial distribution around a lumen- forming sprout. TPF was used to specifically image EGFP expressing EC lining the formed lumen. In contrast, OCM derived contrast from both EC and collagen matrix.
Fig. 7.

Representative images of angiogenic structures by simultaneously acquired collagen SHG, cellular TPF and non-specific OCM from within control (no mTG treatment) and mTG-treated 3D collagen gels. Angiogenesis cultures were allowed to develop for 72 h, then fixed with 4% paraformaldehyde, and imaged with NLOM– OCM. Scale bar is 50 μm.
When visualized with NLOM–OCM en face images from within intact 3D collagen gels, lumen areas may be measured in contrast to lumen diameters when using transverse sections of 3D cultures (as in Fig. 6). Consistent with lumen diameters quantified with transverse sections, no significant difference in lumen area was measured in mTG-treated collagen matrices (5414.5 ± 500.9 and 5752.2 ± 404.8 μm2 in 100 and 500 μgml−1 mTG, respectively) compared with controls (5872.2 ± 651.0 μm2), as shown in Fig. 8A. However, the amount of collagen remodeling as quantified by CIR around lumens was higher in stiffer matrices. CIR around lumens formed in 500 μgml−1 mTG-treated collagen gels measured 2.2 ± 0.1 times higher density than surrounding matrix, compared with 1.9 ± 0.1 and 1.8 ± 0.1 for control and 100 μg ml−1 mTG-treated gels, respectively (see Fig. 8B). Furthermore, if each CIR measurement was normalized to lumen area, matrix remodeling (as measured by CIR/lumen area) during lumenogenesis increased in stiffer matrices (Fig. 8C).
Finally, SHG measures of CIR were validated with OCM. A complicating factor when quantifying collagen density with SHG is that its intensity has a quadratic relationship with path length. In other words, SHG intensity will vary quadratically with path length in any non-linear medium, in this case, the collagen fiber. OCM contrast, however, depends on backscattered light. Thus, using the same image regions, CIR was calculated with simultaneously acquired SHG and OCM, and their correlation is plotted in Fig. 8D. A dotted line is shown for exact correspondence, i.e., CIR(− SHG) = CIR(OCM). The correlative plot exhibited high correlation, with coefficient r = 0.8247.
5. Discussion
Pro-angiogenic signals guide the sprouting of new vasculature, but, to do so, ECs must navigate the surrounding fibrous ECM. In many of the cellular processes used to increase and expand the vascular network, including migration, proliferation, lumenogenesis and expansion, and matrix remodeling, ECM fibers can impede, but also provide mechanical support for sprouting EC activities. Thus, this study characterized angiogenic responses to ECM physical properties, in particular, mechanical stiffness, independent of changes in protein density and microstructural properties of porosity and pore size.
In the 3D model of angiogenesis, mTG was used to enzymatically crosslink and thereby stiffen collagen matrices. Biaxial mechanical testing of 3D collagen matrices exhibited non-linear mechanical responses characteristic of soft biological tissues, i.e., that they stiffen with stretch. The first Piola–Kirchhoff (nominal) stress is presented as a function of strain to illustrate that 3D collagen matrices exhibited stiffer mechanical responses with increased mTG dose and also with culture time. This stiffening with culture time was true even for untreated (control) collagen matrices, where mechanical tests and optical measurements suggested this stiffening was due to increased crosslinking; see Figs. 1 and 2. At this time, the present authors do not know why mTG-treated and untreated collagen matrices stiffen with culture time, but one possibility is that the presence of glucose (5.5 mM) in M199 may contribute to this effect, consistent with previous studies on glycation [74]. Furthermore, it should be noted that the true (Cauchy) stress values are probably higher than reported, because of thinning of the collagen matrices with stretch. Indeed, in a concurrent report in which the thickness of reconstituted (collagen and fibrin) matrices was measured as a function of stretch, 3D collagen matrices exhibited non-linear mechanical and compressible behavior [73]. Thus, derivation of tissue (true) stress requires thickness measurements as a function of strain, and the non-linear dependence of stress on strain indicates tissue stiffness will depend on strain as well.
Consistent with mechanical testing, collagen TPF also increased with mTG dose and culture time, which indicated that the stiffening was due to increased collagen crosslinking. In control experiments, collagen treatment with heat-inactivated mTG did not result in changes from control matrices in TPF or TPF/SHG signal (see Appendix Fig. A1). Ratio of collagen TPF/SHG exhibited high correlation with load at 5% stretch providing correspondence between collagen crosslinking and mechanical responses. The observed increase in collagen TPF and stiffness with mTG treatment is consistent with similar observations when inducing crosslinking with glutaraldehyde [42]. One source of collagen autofluorescence has been traced to the crosslink pyridinoline [70,75,76]. However, it has not been addressed whether these fluorescent crosslinks were identical to those induced by mTG treatment.
It was also shown that mTG-induced crosslinking did not affect collagen microstructural properties porosity, pore size and pore number as measured by SHG in hydrated matrices. Collagen SHG has been reported to change with high-dose glycation treatment [74], but not with genipin [77]. No significant differences in SHG signal from acellular collagen among the different mTG treatment conditions also reflected the unchanged collagen microstructure. The measured median pore size of 14 μm2 for 3.5 mg ml−1 collagen matrices was comparable with those reported by others, e.g., 10 μm2 pore and 4 μm mesh size for 4.0 and 3.5 mg ml−1 collagen gels, respectively [43,78].
The present authors were not able to optically resolve any differences in collagen fiber diameters due to mTG treatment with OCM or SHG. However, by using the linear dependence of light scattering on collagen concentration [79] and quadratic dependence of SHG on path length, i.e., fiber diameter, the unchanging collagen OCM/SHG ratio with mTG treatment spectroscopically suggested that fiber diameters did not change with mTG-induced crosslinking (see Appendix Fig. A2). This spectroscopic evidence combined with unchanging microstructural organization of the collagen matrices suggested that the mTG-induced crosslinking was intrafibrillar. This is consistent with previous reports that mTG can only react with denatured collagen [59], though this point will benefit from further investigation. Nevertheless, the approach using mTG to induce crosslinking orthogonalized matrix parameters stiffness and porosity, and produced a series of 3.5 mg ml−1 collagen matrices of different stiffness, which may be used to characterize angiogenic responses.
In this initial study, “day 1” 3D collagen matrices were used to characterize angiogenic responses to changes in matrix stiffness while keeping density and microstructural organization (e.g., porosity) comparable. The number of invading sprouts (per area), sprout invasion distance, lumen size and matrix remodeling were quantified. In stiffer matrices, more invading sprouts that invaded deeper than in more compliant ones were measured (see Fig. 6). Furthermore, more matrix remodeling was observed resulting in higher concentrations of perilumenal collagen (CIR) around lumens formed in stiffer matrices than in compliant ones (see Figs. 7 and 8). Lumen size (diameter in Fig. 6 and cross-sectional area in Fig. 8), however, was not dependent on matrix stiffness. These conditional angiogenic responses were observed in 3D collagen matrices with admittedly small changes in mechanical stiffness (see mechanical response curves from day 1; Fig. 1A). It is likely that optimal conditions will emerge as angiogenic responses are measured in matrices of higher stiffness. Furthermore, although changes in matrix stiffness without modifying collagen density and microstructural organization were verified, one cannot rule out the possibility of potential collateral biochemical effects from mTG activity, such as altered growth factor binding [80] or adhesive ligand presentation, which may also modulate angiogenic responses.
The observations that different metrics of angiogenic responses, including invasion frequency, invasion distance and matrix remodeling, depend on matrix stiffness are not unprecedented. For example, cell traction magnitude and focal adhesion size have been shown to depend on ECM stiffness [81], and cell traction has been shown to be necessary for focal adhesion growth and maintenance [82]. More frequent sprout invasion in stiffer matrices may result from higher VEGFR expression, which is governed by two antagonistic transcription factors, TFII-1 and GATA2, of a mechanosensitive pathway [83] and from mechanosensitive protease secretion [84]. Cell–ECM traction modulates the tension in cell–cell contacts [85] and the size of cell–cell junctions [86]. Also, cell mobility may be regulated by crosstalk between cell–cell junctions and integrin adhesions [87]. It was previously reported that, during lumenogenesis, both cell traction and membrane-associated metalloproteinases are engaged to expand the lumen. Lumen expansion by these processes resulted in local increases in perilumenal collagen concentration, suggesting matrix remodeling that was observed with NLOM and quantified by CIR [8]. Higher CIR values in stiffer matrices (see Figs. 7 and 8) may suggest higher EC-generated traction, which may be necessary to maintain vessel integrity and control vessel permeability [88]. It was also observed that lumen size was not affected by matrix stiffness, albeit over a limited range, which suggests its regulation is not as mechanosensitive as other metrics of angiogenic responses.
Previous studies have measured modulated angiogenic responses to changes in collagen [9,27] or fibrin [26,30,31,33] concentrations. From these, it was concluded that lower ECM protein concentrations favored angiogenesis, e.g., angiogenic network length, but it was not clear whether this effect was predominantly due to matrix compliance or porosity. Others have taken a similar approach to that reported here, where crosslinking is induced to modulate matrix stiffness independent of ECM protein concentration [28,61]. However, it was found that, with these schemes, crosslinking modulated matrix microstructural properties as well as mechanical responses, e.g., glyoxal [89,90] and ribose [61]. In addition, crosslinking agents may have a biological effect on resident cells; the control experiments showed mTG treatment of EC had a suppressive angiogenic effect (see Appendix Fig. A3). The retardation of EC invasion with topically applied mTG (in media) may be due to crosslinking of cell junctions, as previously reported [91]. Thus, while the present authors posit that induced crosslinking is a viable strategy to orthogonalize 3D matrix properties of porosity and stiffness, microscopic and mechanical characterizations are needed to verify their orthonormality and desired outcomes.
6. Conclusions
It has been shown that stiffer 3D matrices result in increased endothelial sprouting, and those sprouts invade deeper without affecting lumen size. Stiffer matrices also resulted in higher perilumenal collagen concentration from remodeling to accommodate lumenogenesis and expansion. The present authors were able to modulate stiffness independent of ECM collagen concentration by inducing crosslinking enzymatically using mTG, and these matrices were characterized with biaxial mechanical testing. Integrated NLOM–OCM was used to verify that microstructural properties porosity, pore number and pore size did not change with mTG treatment. Thus, the differences in measured angiogenic responses were probably due to matrix stiffness, while collagen density and microstructural organization were comparable. It is suggested that, with mTG crosslinking and varied collagen density, a series of 3D matrices may be generated that characterize angiogenic responses as a function of porosity and density while keeping mechanical properties constant. Such studies will enable better understanding of how ECM properties affect cell behavior, particularly angiogenesis, and help guide the design of vascularized tissue constructs for applications in regenerative medicine.
Acknowledgments
The authors thank Ajinomoto Company for samples of ACTIVA WM from which mTG was purified. This work was supported by NIH EB008366, NSF CBET-1033660 (to A.T.Y.) and NIH HL 095786 (to K.J.B.).
Appendix A
Fig. A1.

(A) Scatter plot of TPF/SHG ratio from 45 images in acellular, denatured mTG-treated collagen gels. (B) Scatter plot of TPF/SHG ratio from 75 images in acellular mTG-treated collagen gels. (C) Bar graph of mean TPF/SHG ratio in acellular mTG- and denatured mTG-treated collagen gels. In the statistics table, black regions represent significant difference with P < 0.05. Error bars represent mean ± STD.
Fig. A2.

(A) Representative SHG and OCM images of acellular control and mTG-treated collagen gels. (B) Scatter plot of OCM/SHG ratio from 75 images in acellular control and mTG-treated collagen gels. (C) Bar graph of mean OCM/SHG ratio in acellular control and mTG-treated collagen gels. Error bars represent mean ± STD.
Fig. A3.

(A) Cross-sectional images of cultures at 72 h stained with toluidine blue in control and topically applied mTG in media above monolayer. Scale bar is 250 μm. (B) Invading structure number, (C) invasion distance and (D) lumen diameter in control and cultures with topically applied mTG. Sample number n = 4 gels in (B), n = 127, 111 structures in (C) and n = 57, 44 structures in (D) for control, 500 μgml−1 mTG-treated gels, respectively. Symbol * represents P < 0.05.
Appendix B. Figures with essential colour discrimination
Certain figures in this article, particularly Figs. 6, 8 and A3 are difficult to interpret in black and white. The full colour images can be found in the on-line version, at http://dx.doi.org/10.1016/j.actbio.2013.04.001.
References
- 1.Folkman J. Angiogenesis. Annu Rev Med. 2006;57:1–18. doi: 10.1146/annurev.med.57.121304.131306. [DOI] [PubMed] [Google Scholar]
- 2.Lee H, Goetzl EJ, An S. Effects of lysophosphatidic acid and sphingosine 1- phosphate on endothelial cells. FASEB J. 1999;13:A706-A. [Google Scholar]
- 3.Lee OH, Kim YM, Lee YM, Moon EJ, Lee DJ, Kim JH, et al. Sphingosine 1- phosphate induces angiogenesis: its angiogenic action and signaling mechanism in human umbilical vein endothelial cells. Biochem Biophys Res Commun. 1999;264:743–50. doi: 10.1006/bbrc.1999.1586. [DOI] [PubMed] [Google Scholar]
- 4.Su SC, Bayless KJ. Utilizing sphingosine-1-phosphate to stimulate sprouting angiogenesis. Methods Mol Biol. 2012;874:201–13. doi: 10.1007/978-1-61779-800-9_16. [DOI] [PubMed] [Google Scholar]
- 5.Wacker A, Gerhardt H. Endothelial development taking shape. Curr Opin Cell Biol. 2011;23:676–85. doi: 10.1016/j.ceb.2011.10.002. [DOI] [PubMed] [Google Scholar]
- 6.Sainson RC, Harris AL. Regulation of angiogenesis by homotypic and heterotypic notch signalling in endothelial cells and pericytes: from basic research to potential therapies. Angiogenesis. 2008;11:41–51. doi: 10.1007/s10456-008-9098-0. [DOI] [PubMed] [Google Scholar]
- 7.Davis GE, Senger DR. Endothelial extracellular matrix—biosynthesis, remodeling, and functions during vascular morphogenesis and neovessel stabilization. Circ Res. 2005;97:1093–107. doi: 10.1161/01.RES.0000191547.64391.e3. [DOI] [PubMed] [Google Scholar]
- 8.Lee PF, Yeh AT, Bayless KJ. Nonlinear optical microscopy reveals invading endothelial cells anisotropically alter three-dimensional collagen matrices. Exp Cell Res. 2009;315:396–410. doi: 10.1016/j.yexcr.2008.10.040. [DOI] [PubMed] [Google Scholar]
- 9.Sieminski AL, Hebbel RP, Gooch KJ. The relative magnitudes of endothelial force generation and matrix stiffness modulate capillary morphogenesis in vitro. Exp Cell Res. 2004;297:574–84. doi: 10.1016/j.yexcr.2004.03.035. [DOI] [PubMed] [Google Scholar]
- 10.Yeung T, Georges PC, Flanagan LA, Marg B, Ortiz M, Funaki M, et al. Effects of substrate stiffness on cell morphology, cytoskeletal structure, and adhesion. Cell Motil Cytoskelet. 2005;60:24–34. doi: 10.1002/cm.20041. [DOI] [PubMed] [Google Scholar]
- 11.Reinhart-King CA, Dembo M, Hammer DA. Cell–cell mechanical communication through compliant substrates. Biophys J. 2008;95:6044–51. doi: 10.1529/biophysj.107.127662. [DOI] [PMC free article] [PubMed] [Google Scholar]
- 12.Stroka KM, Aranda-Espinoza H. A biophysical view of the interplay between mechanical forces and signaling pathways during transendothelial cell migration. FEBS J. 2010;277:1145–58. doi: 10.1111/j.1742-4658.2009.07545.x. [DOI] [PubMed] [Google Scholar]
- 13.Peyton SR, Putnam AJ. Extracellular matrix rigidity governs smooth muscle cell motility in a biphasic fashion. J Cell Physiol. 2005;204:198–209. doi: 10.1002/jcp.20274. [DOI] [PubMed] [Google Scholar]
- 14.Engler A, Bacakova L, Newman C, Hategan A, Griffin M, Discher D. Substrate compliance versus ligand density in cell on gel responses. Biophys J. 2004;86:617–28. doi: 10.1016/S0006-3495(04)74140-5. [DOI] [PMC free article] [PubMed] [Google Scholar]
- 15.McDaniel DP, Shaw GA, Elliott JT, Bhadriraju K, Meuse C, Chung KH, et al. The stiffness of collagen fibrils influences vascular smooth muscle cell phenotype. Biophys J. 2007;92:1759–69. doi: 10.1529/biophysj.106.089003. [DOI] [PMC free article] [PubMed] [Google Scholar]
- 16.Miron-Mendoza M, Seemann J, Grinnell F. The differential regulation of cell motile activity through matrix stiffness and porosity in three dimensional collagen matrices. Biomaterials. 2010;31:6425–35. doi: 10.1016/j.biomaterials.2010.04.064. [DOI] [PMC free article] [PubMed] [Google Scholar]
- 17.Fereol S, Fodil R, Labat B, Galiacy S, Laurent VM, Louis B, et al. Sensitivity of alveolar macrophages to substrate mechanical and adhesive properties. Cell Motil Cytoskelet. 2006;63:321–40. doi: 10.1002/cm.20130. [DOI] [PubMed] [Google Scholar]
- 18.Stroka KM, Aranda-Espinoza H. Neutrophils display biphasic relationship between migration and substrate stiffness. Cell Motil Cytoskelet. 2009;66:328–41. doi: 10.1002/cm.20363. [DOI] [PubMed] [Google Scholar]
- 19.Engler AJ, Sen S, Sweeney HL, Discher DE. Matrix elasticity directs stem cell lineage specification. Cell. 2006;126:677–89. doi: 10.1016/j.cell.2006.06.044. [DOI] [PubMed] [Google Scholar]
- 20.Saha K, Keung AJ, Irwin EF, Li Y, Little L, Schaffer DV, et al. Substrate modulus directs neural stem cell behavior. Biophys J. 2008;95:4426–38. doi: 10.1529/biophysj.108.132217. [DOI] [PMC free article] [PubMed] [Google Scholar]
- 21.Erler JT, Weaver VM. Three-dimensional context regulation of metastasis. Clin Exp Metastasis. 2009;26:35–49. doi: 10.1007/s10585-008-9209-8. [DOI] [PMC free article] [PubMed] [Google Scholar]
- 22.Paszek MJ, Zahir N, Johnson KR, Lakins JN, Rozenberg GI, Gefen A, et al. Tensional homeostasis and the malignant phenotype. Cancer Cell. 2005;8:241–54. doi: 10.1016/j.ccr.2005.08.010. [DOI] [PubMed] [Google Scholar]
- 23.An SS, Kim J, Ahn K, Trepat X, Drake KJ, Kumar S, et al. Cell stiffness, contractile stress and the role of extracellular matrix. Biochem Biophys Res Commun. 2009;382:697–703. doi: 10.1016/j.bbrc.2009.03.118. [DOI] [PMC free article] [PubMed] [Google Scholar]
- 24.Pathak A, Kumar S. Independent regulation of tumor cell migration by matrix stiffness and confinement. Proc Natl Acad Sci USA. 2012;109:10334–9. doi: 10.1073/pnas.1118073109. [DOI] [PMC free article] [PubMed] [Google Scholar]
- 25.Pelham RJ, Jr, Wang Y. Cell locomotion and focal adhesions are regulated by substrate flexibility. Proc Natl Acad Sci USA. 1997;94:13661–5. doi: 10.1073/pnas.94.25.13661. [DOI] [PMC free article] [PubMed] [Google Scholar]
- 26.Stephanou A, Meskaoui G, Vailhe B, Tracqui P. The rigidity in fibrin gels as a contributing factor to the dynamics of in vitro vascular cord formation. Microvasc Res. 2007;73:182–90. doi: 10.1016/j.mvr.2006.12.002. [DOI] [PubMed] [Google Scholar]
- 27.Critser PJ, Kreger ST, Voytik-Harbin SL, Yoder MC. Collagen matrix physical properties modulate endothelial colony forming cell-derived vessels in vivo. Microvasc Res. 2010;80:23–30. doi: 10.1016/j.mvr.2010.03.001. [DOI] [PMC free article] [PubMed] [Google Scholar]
- 28.Yamamura N, Sudo R, Ikeda M, Tanishita K. Effects of the mechanical properties of collagen gel on the in vitro formation of microvessel networks by endothelial cells. Tissue Eng. 2007;13:1443–53. doi: 10.1089/ten.2006.0333. [DOI] [PubMed] [Google Scholar]
- 29.Francis-Sedlak ME, Moya ML, Huang JJ, Lucas SA, Chandrasekharan N, Larson JC, et al. Collagen glycation alters neovascularization in vitro and in vivo. Microvasc Res. 2010;80:3–9. doi: 10.1016/j.mvr.2009.12.005. [DOI] [PubMed] [Google Scholar]
- 30.Kniazeva E, Putnam AJ. Endothelial cell traction and ECM density influence both capillary morphogenesis and maintenance in 3-D. Am J Physiol Cell Physiol. 2009;297:C179–87. doi: 10.1152/ajpcell.00018.2009. [DOI] [PubMed] [Google Scholar]
- 31.Ghajar CM, Chen X, Harris JW, Suresh V, Hughes CC, Jeon NL, et al. The effect of matrix density on the regulation of 3-D capillary morphogenesis. Biophys J. 2008;94:1930–41. doi: 10.1529/biophysj.107.120774. [DOI] [PMC free article] [PubMed] [Google Scholar]
- 32.Sieminski AL, Was AS, Kim G, Gong H, Kamm RD. The stiffness of three-dimensional ionic self-assembling peptide gels affects the extent of capillary-like network formation. Cell Biochem Biophys. 2007;49:73–83. doi: 10.1007/s12013-007-0046-1. [DOI] [PubMed] [Google Scholar]
- 33.Kniazeva E, Weidling JW, Singh R, Botvinick EL, Digman MA, Gratton E, et al. Quantification of local matrix deformations and mechanical properties during capillary morphogenesis in 3D. Integr Biol. 2012;4:431–9. doi: 10.1039/c2ib00120a. [DOI] [PMC free article] [PubMed] [Google Scholar]
- 34.Nehls V, Herrmann R. The configuration of fibrin clots determines capillary morphogenesis and endothelial cell migration. Microvasc Res. 1996;51:347–64. doi: 10.1006/mvre.1996.0032. [DOI] [PubMed] [Google Scholar]
- 35.Vailhe B, Ronot X, Tracqui P, Usson Y, Tranqui L. In vitro angiogenesis is modulated by the mechanical properties of fibrin gels and is related to alpha(v)beta3 integrin localization. In Vitro Cell Dev Biol Anim. 1997;33:763–73. doi: 10.1007/s11626-997-0155-6. [DOI] [PubMed] [Google Scholar]
- 36.Kanzawa S, Endo H, Shioya N. Improved in vitro angiogenesis model by collagen density reduction and the use of type III collagen. Ann Plast Surg. 1993;30:244–51. doi: 10.1097/00000637-199303000-00008. [DOI] [PubMed] [Google Scholar]
- 37.Hoying JB, Boswell CA, Williams SK. Angiogenic potential of microvessel fragments established in three-dimensional collagen gels. In Vitro Cell Dev Biol Anim. 1996;32:409–19. doi: 10.1007/BF02723003. [DOI] [PubMed] [Google Scholar]
- 38.Gobeaux F, Mosser G, Anglo A, Panine P, Davidson P, Giraud-Guille MM, et al. Fibrillogenesis in dense collagen solutions: a physicochemical study. J Mol Biol. 2008;376:1509–22. doi: 10.1016/j.jmb.2007.12.047. [DOI] [PubMed] [Google Scholar]
- 39.Mosser G, Anglo A, Helary C, Bouligand Y, Giraud-Guille MM. Dense tissue-like collagen matrices formed in cell-free conditions. Matrix Biol. 2006;25:3–13. doi: 10.1016/j.matbio.2005.09.002. [DOI] [PubMed] [Google Scholar]
- 40.Yang YL, Motte S, Kaufman LJ. Pore size variable type I collagen gels and their interaction with glioma cells. Biomaterials. 2010;31:5678–88. doi: 10.1016/j.biomaterials.2010.03.039. [DOI] [PubMed] [Google Scholar]
- 41.Johnson TD, Lin SY, Christman KL. Tailoring material properties of a nanofibrous extracellular matrix derived hydrogel. Nanotechnology. 2011;22:494015. doi: 10.1088/0957-4484/22/49/494015. [DOI] [PMC free article] [PubMed] [Google Scholar]
- 42.Raub CB, Suresh V, Krasieva T, Lyubovitsky J, Mih JD, Putnam AJ, et al. Noninvasive assessment of collagen gel microstructure and mechanics using multiphoton microscopy. Biophys J. 2007;92:2212–22. doi: 10.1529/biophysj.106.097998. [DOI] [PMC free article] [PubMed] [Google Scholar]
- 43.Raub CB, Unruh J, Suresh V, Krasieva T, Lindmo T, Gratton E, et al. Image correlation spectroscopy of multiphoton images correlates with collagen mechanical properties. Biophys J. 2008;94:2361–73. doi: 10.1529/biophysj.107.120006. [DOI] [PMC free article] [PubMed] [Google Scholar]
- 44.Freund I, Deutsch M, Sprecher A. Connective-tissue polarity—optical 2nd-harmonic microscopy, crossed-beam summation, and small-angle scattering in rat-tail tendon. Biophys J. 1986;50:693–712. doi: 10.1016/S0006-3495(86)83510-X. [DOI] [PMC free article] [PubMed] [Google Scholar]
- 45.Williams RM, Zipfel WR, Webb WW. Multiphoton microscopy in biological research. Curr Opin Chem Biol. 2001;5:603–8. doi: 10.1016/s1367-5931(00)00241-6. [DOI] [PubMed] [Google Scholar]
- 46.Zoumi A, Yeh A, Tromberg BJ. Imaging cells and extracellular matrix in vivo by using second-harmonic generation and two-photon excited fluorescence. Proc Natl Acad Sci USA. 2002;99:11014–9. doi: 10.1073/pnas.172368799. [DOI] [PMC free article] [PubMed] [Google Scholar]
- 47.Campagnola PJ, Millard AC, Terasaki M, Hoppe PE, Malone CJ, Mohler WA. Three-dimensional high-resolution second-harmonic generation imaging of endogenous structural proteins in biological tissues. Biophys J. 2002;82:493–508. doi: 10.1016/S0006-3495(02)75414-3. [DOI] [PMC free article] [PubMed] [Google Scholar]
- 48.Brown E, McKee T, DiTomaso E, Pluen A, Seed B, Boucher Y, et al. Dynamic imaging of collagen and its modulation in tumors in vivo using second-harmonic generation. Nat Med. 2003;9:796–800. doi: 10.1038/nm879. [DOI] [PubMed] [Google Scholar]
- 49.Yeh AT, Choi B, Nelson JS, Tromberg BJ. Reversible dissociation of collagen in tissues. J Invest Dermatol. 2003;121:1332–5. doi: 10.1046/j.1523-1747.2003.12634.x. [DOI] [PubMed] [Google Scholar]
- 50.Yeh AT, Kao BS, Jung WG, Chen ZP, Nelson JS, Tromberg BJ. Imaging wound healing using optical coherence tomography and multiphoton microscopy in an in vitro skin-equivalent tissue model. J Biomed Opt. 2004;9:248–53. doi: 10.1117/1.1648646. [DOI] [PubMed] [Google Scholar]
- 51.Weadock KS, Miller EJ, Bellincampi LD, Zawadsky JP, Dunn MG. Physical crosslinking of collagen fibers: comparison of ultraviolet irradiation and dehydrothermal treatment. J Biomed Mater Res. 1995;29:1373–9. doi: 10.1002/jbm.820291108. [DOI] [PubMed] [Google Scholar]
- 52.Ohan MP, Weadock KS, Dunn MG. Synergistic effects of glucose and ultraviolet irradiation on the physical properties of collagen. J Biomed Mater Res. 2002;60:384–91. doi: 10.1002/jbm.10111. [DOI] [PubMed] [Google Scholar]
- 53.Lai ES, Anderson CM, Fuller GG. Designing a tubular matrix of oriented collagen fibrils for tissue engineering. Acta Biomater. 2011;7:2448–56. doi: 10.1016/j.actbio.2011.03.012. [DOI] [PubMed] [Google Scholar]
- 54.Wu X, Black L, Santacana-Laffitte G, Patrick CW., Jr Preparation and assessment of glutaraldehyde-crosslinked collagen-chitosan hydrogels for adipose tissue engineering. J Biomed Mater Res Part A. 2007;81:59–65. doi: 10.1002/jbm.a.31003. [DOI] [PubMed] [Google Scholar]
- 55.Powell HM, Boyce ST. EDC cross-linking improves skin substitute strength and stability. Biomaterials. 2006;27:5821–7. doi: 10.1016/j.biomaterials.2006.07.030. [DOI] [PubMed] [Google Scholar]
- 56.Yung CW, Wu LQ, Tullman JA, Payne GF, Bentley WE, Barbari TA. Transglutaminase crosslinked gelatin as a tissue engineering scaffold. J Biomed Mater Res Part A. 2007;83A:1039–46. doi: 10.1002/jbm.a.31431. [DOI] [PubMed] [Google Scholar]
- 57.Khew ST, Yang QJ, Tong YW. Enzymatically crosslinked collagen-mimetic dendrimers that promote integrin-targeted cell adhesion. Biomaterials. 2008;29:3034–45. doi: 10.1016/j.biomaterials.2008.03.023. [DOI] [PubMed] [Google Scholar]
- 58.Garcia Y, Hemantkumar N, Collighan R, Griffin M, Rodriguez-Cabello JC, Pandit A. In vitro characterization of a collagen scaffold enzymatically cross-linked with a tailored elastin-like polymer. Tissue Eng Part A. 2009;15:887–99. doi: 10.1089/ten.tea.2008.0104. [DOI] [PubMed] [Google Scholar]
- 59.Chen RN, Ho HO, Sheu MT. Characterization of collagen matrices crosslinked using microbial transglutaminase. Biomaterials. 2005;26:4229–35. doi: 10.1016/j.biomaterials.2004.11.012. [DOI] [PubMed] [Google Scholar]
- 60.Elbjeirami WM, Yonter EO, Starcher BC, West JL. Enhancing mechanical properties of tissue-engineered constructs via lysyl oxidase crosslinking activity. J Biomed Mater Res Part A. 2003;66:513–21. doi: 10.1002/jbm.a.10021. [DOI] [PubMed] [Google Scholar]
- 61.Mason BN, Starchenko A, Williams RM, Bonassar LJ, Reinhart-King CA. Tuning three-dimensional collagen matrix stiffness independently of collagen concentration modulates endothelial cell behavior. Acta Biomater. 2013;9:4635–44. doi: 10.1016/j.actbio.2012.08.007. [DOI] [PMC free article] [PubMed] [Google Scholar]
- 62.Roy R, Boskey A, Bonassar LJ. Processing of type I collagen gels using nonenzymatic glycation. J Biomed Mater Res Part A. 2010;93:843–51. doi: 10.1002/jbm.a.32231. [DOI] [PMC free article] [PubMed] [Google Scholar]
- 63.Girton TS, Oegema TR, Grassl ED, Isenberg BC, Tranquillo RT. Mechanisms of stiffening and strengthening in media-equivalents fabricated using glycation. J Biomech Eng. 2000;122:216–23. doi: 10.1115/1.429652. [DOI] [PubMed] [Google Scholar]
- 64.Ciardelli G, Gentile P, Chiono V, Mattioli-Belmonte M, Vozzi G, Barbani N, et al. Enzymatically crosslinked porous composite matrices for bone tissue regeneration. J Biomed Mater Res Part A. 2010;92:137–51. doi: 10.1002/jbm.a.32344. [DOI] [PubMed] [Google Scholar]
- 65.Macedo JA, Sette LD, Sato HH. A comparative biochemical characterization of microbial transglutaminases: commercial vs. a newly isolated enzyme from Streptomyces Sp. Food Bioprocess Technol. 2010:3. [Google Scholar]
- 66.Maciag T, Cerundolo J, Ilsley S, Kelley PR, Forand R. Endothelial cell-growth factor from bovine hypothalamus—identification and partial characterization. Proc Natl Acad Sci USA. 1979;76:5674–8. doi: 10.1073/pnas.76.11.5674. [DOI] [PMC free article] [PubMed] [Google Scholar]
- 67.Su SC, Mendoza EA, Kwak HI, Bayless KJ. Molecular profile of endothelial invasion of three-dimensional collagen matrices: insights into angiogenic sprout induction in wound healing. Am J Physiol. 2008;295:c1215–29. doi: 10.1152/ajpcell.00336.2008. [DOI] [PubMed] [Google Scholar]
- 68.Wu Q, Applegate BE, Yeh AT. Cornea microstructure and mechanical responses measured with nonlinear optical and optical coherence microscopy using sub- 10-fs pulses. Biomed Opt Express. 2011;2:1135–46. doi: 10.1364/BOE.2.001135. [DOI] [PMC free article] [PubMed] [Google Scholar]
- 69.Kirkpatrick ND, Hoying JB, Botting SK, Weiss JA, Utzinger U. In vitro model for endogenous optical signatures of collagen. J Biomed Opt. 2006;11:054021. doi: 10.1117/1.2360516. [DOI] [PubMed] [Google Scholar]
- 70.Fujimoto D. Isolation and characterization of a fluorescent material in bovine achilles tendon collagen. Biochem Biophys Res Commun. 1977;76:1124–9. doi: 10.1016/0006-291x(77)90972-x. [DOI] [PubMed] [Google Scholar]
- 71.Gonzales RC, Woods RE, Eddins SL. Digital image processing using MATLAB. 2. Gatesmark: 2009. [Google Scholar]
- 72.Hu JJ, Humphrey JD, Yeh AT. Characterization of engineered tissue development under biaxial stretch using nonlinear optical microscopy. Tissue Eng Part A. 2009;15:1553–64. doi: 10.1089/ten.tea.2008.0287. [DOI] [PMC free article] [PubMed] [Google Scholar]
- 73.Bai Y, Lee PF, Humphrey JD, Yeh AT. Intravital characterization of engineered tissues by multimodal optical imaging and biaxial mechanical testing. submitted for publication. [Google Scholar]
- 74.Hwang YJ, Granelli J, Lyubovitsky JG. Multiphoton optical image guided spectroscopy method for characterization of collagen-based materials modified by glycation. Anal Chem. 2011;83:200–6. doi: 10.1021/ac102235g. [DOI] [PMC free article] [PubMed] [Google Scholar]
- 75.Sell DR, Monnier VM. Isolation, purification and partial characterization of novel fluorophores from aging human insoluble collagen-rich tissue. Connect Tissue Res. 1989;19:77–92. doi: 10.3109/03008208909016816. [DOI] [PubMed] [Google Scholar]
- 76.Migneault I, Dartiguenave C, Bertrand MJ, Waldron KC. Glutaraldehyde: behavior in aqueous solution, reaction with proteins, and application to enzyme crosslinking. Biotechniques. 2004;37:790–6. 802–8. doi: 10.2144/04375RV01. [DOI] [PubMed] [Google Scholar]
- 77.Hwang YJ, Larsen J, Krasieva TB, Lyubovitsky JG. Effect of genipin crosslinking on the optical spectral properties and structures of collagen hydrogels. ACS Appl Mater Interfaces. 2011;3:2579–84. doi: 10.1021/am200416h. [DOI] [PMC free article] [PubMed] [Google Scholar]
- 78.Yang YL, Leone LM, Kaufman LJ. Elastic moduli of collagen gels can be predicted from two-dimensional confocal microscopy. Biophys J. 2009;97:2051–60. doi: 10.1016/j.bpj.2009.07.035. [DOI] [PMC free article] [PubMed] [Google Scholar]
- 79.LaCroix JT, Haidekker MA. Quantifying light scattering with single-mode fiber-optic confocal microscopy. BMC Med Imaging. 2009;9:19. doi: 10.1186/1471-2342-9-19. [DOI] [PMC free article] [PubMed] [Google Scholar]
- 80.Leight JL, Wozniak MA, Chen S, Lynch ML, Chen CS. Matrix rigidity regulates a switch between TGF-beta1-induced apoptosis and epithelial–mesenchymal transition. Mol Biol Cell. 2012;23:781–91. doi: 10.1091/mbc.E11-06-0537. [DOI] [PMC free article] [PubMed] [Google Scholar]
- 81.Califano JP, Reinhart-King CA. Exogenous and endogenous force regulation of endothelial cell behavior. J Biomech. 2010;43:79–86. doi: 10.1016/j.jbiomech.2009.09.012. [DOI] [PubMed] [Google Scholar]
- 82.Totsukawa G, Wu Y, Sasaki Y, Hartshorne DJ, Yamakita Y, Yamashiro S, et al. Distinct roles of MLCK and ROCK in the regulation of membrane protrusions and focal adhesion dynamics during cell migration of fibroblasts. J Cell Biol. 2004;164:427–39. doi: 10.1083/jcb.200306172. [DOI] [PMC free article] [PubMed] [Google Scholar]
- 83.Mammoto A, Connor KM, Mammoto T, Yung CW, Huh D, Aderman CM, et al. A mechanosensitive transcriptional mechanism that controls angiogenesis. Nature. 2009;457:1103–U57. doi: 10.1038/nature07765. [DOI] [PMC free article] [PubMed] [Google Scholar]
- 84.Dao Thi MU, Trocme C, Montmasson MP, Fanchon E, Toussaint B, Tracqui P. Investigating metalloproteinases MMP-2 and MMP-9 mechanosensitivity to feedback loops involved in the regulation of in vitro angiogenesis by endogenous mechanical stresses. Acta Biotheor. 2012;60:21–40. doi: 10.1007/s10441-012-9147-3. [DOI] [PubMed] [Google Scholar]
- 85.Maruthamuthu V, Sabass B, Schwarz US, Gardel ML. Cell-ECM traction force modulates endogenous tension at cell–cell contacts. Proc Natl Acad Sci USA. 2011;108:4708–13. doi: 10.1073/pnas.1011123108. [DOI] [PMC free article] [PubMed] [Google Scholar]
- 86.Liu Z, Tan JL, Cohen DM, Yang MT, Sniadecki NJ, Ruiz SA, et al. Mechanical tugging force regulates the size of cell–cell junctions. Proc Natl Acad Sci USA. 2010;107:9944–9. doi: 10.1073/pnas.0914547107. [DOI] [PMC free article] [PubMed] [Google Scholar]
- 87.Borghi N, Lowndes M, Maruthamuthu V, Gardel ML, Nelson WJ. Regulation of cell motile behavior by crosstalk between cadherin- and integrin-mediated adhesions. Proc Natl Acad Sci USA. 2010;107:13324–9. doi: 10.1073/pnas.1002662107. [DOI] [PMC free article] [PubMed] [Google Scholar]
- 88.Peyton SR, Ghajar CM, Khatiwala CB, Putnam AJ. The emergence of ECM mechanics and cytoskeletal tension as important regulators of cell function. Cell Biochem Biophys. 2007;47:300–20. doi: 10.1007/s12013-007-0004-y. [DOI] [PubMed] [Google Scholar]
- 89.Rao RR, Jiao A, Kohn DH, Stegemann JP. Exogenous mineralization of cell-seeded and unseeded collagen-chitosan hydrogels using modified culture medium. Acta Biomater. 2012;8:1560–5. doi: 10.1016/j.actbio.2012.01.001. [DOI] [PMC free article] [PubMed] [Google Scholar]
- 90.Rao RR, Peterson AW, Ceccarelli J, Putnam AJ, Stegemann JP. Matrix composition regulates three-dimensional network formation by endothelial cells and mesenchymal stem cells in collagen/fibrin materials. Angiogenesis. 2012;15:253–64. doi: 10.1007/s10456-012-9257-1. [DOI] [PMC free article] [PubMed] [Google Scholar]
- 91.Hiiragi T, Sasaki H, Nagafuchi A, Sabe H, Shen SC, Matsuki M, et al. Transglutaminase type 1 and its cross-linking activity are concentrated at adherens junctions in simple epithelial cells. J Biol Chem. 1999;274:34148–54. doi: 10.1074/jbc.274.48.34148. [DOI] [PubMed] [Google Scholar]