

Abstract
Background
APOE ε4’s role as a modulator of the relationship between soluble plasma beta-amyloid (Aβ) and fibrillar brain Aβ measured by Pittsburgh Compound-B positron emission tomography ([11C]PiB PET) has not been assessed.
Methods
Ninety-six Alzheimer’s Disease Neuroimaging Initiative participants with [11C]PiB scans and plasma Aβ1-40 and Aβ1-42 measurements at time of scan were included. Regional and voxel-wise analyses of [11C]PiB data were used to determine the influence of APOE ε4 on association of plasma Aβ1-40, Aβ1-42, and Aβ1-40/Aβ1-42 with [11C]PiB uptake.
Results
In APOE ε4− but not ε4+ participants, positive relationships between plasma Aβ1-40/Aβ1-42 and [11C]PiB uptake were observed. Modeling the interaction of APOE and plasma Aβ1-40/Aβ1-42 improved the explained variance in [11C]PiB binding compared to using APOE and plasma Aβ1-40/Aβ1-42 as separate terms.
Conclusions
The results suggest that plasma Aβ is a potential Alzheimer’s disease biomarker and highlight the importance of genetic variation in interpretation of plasma Aβ levels.
Keywords: Alzheimer’s disease (AD), mild cognitive impairment (MCI), Alzheimer’s Disease Neuroimaging Initiative (ADNI), beta-amyloid (Aβ), plasma beta-amyloid, positron emission tomography (PET), Pittsburgh Compound-B ([11C]PiB), Apolipoprotein E (APOE)
1. Introduction
Alzheimer’s disease (AD) is the most common type of dementia, affecting an estimated 5.4 million Americans. At present, there are no treatments that can stop its progression. However, worldwide research efforts are being conducted to identify improved methods to prevent, diagnose, and treat this disease [1]. Objective measures of biological or pathogenic processes, termed biomarkers, can help in the evaluation of disease risk or prognosis. To date, no reliable biomarkers for AD in peripheral blood have been found [2].
AD is characterized by declining memory and cognition. Amnestic mild cognitive impairment (MCI) is a clinical condition thought to be a prodromal stage of AD, in which an individual has cognitive problems not normal for his/her age, but are not severe enough to interfere significantly with daily life activities. An estimated 14–18% of individuals aged 70 years and older have MCI, and approximately 10–15% of these individuals with MCI will progress to dementia, mostly AD, each year [3, 4].
Accumulation of beta-amyloid (Aβ) fragments into amyloid plaques in the brain is one of the defining pathologies of AD. Attempts to monitor the presence and/or progression of amyloid deposition have primarily focused on measurements of Aβ in the brain and cerebrospinal fluid (CSF). The level of CSF Aβ1-42 has been shown to be a sensitive biomarker for detection and diagnosis of AD [5–7]. Positron emission tomography (PET) imaging techniques with ligands such as Pittsburgh Compound-B ([11C]PiB) [8] and [18F]florbetapir [9, 10], which bind fibrillar Aβ plaques with high affinity are being studied for their efficacy in predicting and diagnosing AD and have shown some promise [11–13].
Identifying a peripheral biomarker of central Aβ deposition may help in the diagnosis and treatment of the disease at earlier stages. Measuring soluble Aβ levels in plasma would provide an easy method to study Aβ species, as the procedure is minimally invasive and relatively inexpensive. The utility of plasma Aβ as a potential AD biomarker has been assessed in previous studies, but the results have been inconsistent [14–17]. Possible reasons for the inconsistent results could be the use of different enzyme-linked immunosorbent assays and platforms, and timing of sample collection in relation to the stage of disease progression. Therefore, additional studies are needed to fully characterize the utility of plasma Aβ measures as sensitive and effective biomarkers of AD.
Genetic factors, such as the APOE (apoliprotein E) gene, may play a role in amyloid accumulation and the development of AD. The APOE gene is expressed as three variants: ε2, ε3, and ε4. The APOE ε4 allele is the strongest genetic risk factor of late-onset AD and confers a dose-dependent increase in AD risk of approximately four-fold in carriers compared to non-carriers [18–20]. The ε4 allele is also associated with increased fibrillar Aβ [21] and decreased soluble plasma Aβ1-42 [22] in a dose-dependent manner. The APOE gene codes for the apoE protein, which is essential for maintaining blood brain barrier (BBB) integrity [23]. The apoE4 form of the apoE protein, coded for by the ε4 allele, has been associated with reduced Aβ clearance from the brain [24] and plasma [25] and with impaired tight junction integrity [26].
To our knowledge, only four studies have investigated the relationship of soluble plasma Aβ and fibrillar brain Aβ as measured by [11C]PiB [22, 27–29]. The first study [27] did not identify any relationships between plasma Aβ1-40 and Aβ1-42 levels and [11C]PiB binding. In the other studies, inverse correlations were observed between plasma Aβ1-42 and [11C]PiB uptake [22, 28] and between Aβ1-42/Aβ1-40 and brain amyloid [28, 29]. However, none of these studies examined the potential influence of genetic variation in AD-related genes (e.g., APOE ε4) on relationships between peripheral and central markers of Aβ. Furthermore, these studies only included regional measures of [11C]PiB uptake rather than voxel-based mapping across the whole brain, which may have limited the findings as extracting information from spatially large regions may dilute or obscure relevant results that are spatially constrained.
In the present report, we studied the associations among [11C]PiB brain uptake, soluble plasma Aβ measurements, and APOE ε4 genotype status in 96 participants from the Alzheimer’s Disease Neuroimaging Initiative (ADNI) to determine whether the relationship of soluble plasma Aβ measures and fibrillar brain amyloid was influenced by APOE ε4 status. First, we used the average regional [11C]PiB uptake across four target brain regions known to have amyloid deposition in AD as a quantitative phenotype in regression analyses. We then conducted whole-brain, voxel-wise regression analyses to identify spatially-specific clusters in which APOE ε4 genotype modulated the association of plasma and brain PET measurements of Aβ.
2. Methods
2.1. Alzheimer’s Disease Neuroimaging Initiative
Data used in the preparation of this report were obtained from the ADNI database (http://adni.loni.ucla.edu). The ADNI was initiated in 2003 as a $60 million, 5-year public-private partnership by the National Institute on Aging, the National Institute of Biomedical Imaging and Bioengineering, the Food and Drug Administration, private pharmaceutical companies and nonprofit organizations. ADNI’s primary goal is been to test whether serial magnetic resonance imaging (MRI), PET, other biological markers, genetics, and clinical and neuropsychological assessments can be combined to detect and measure the progression of MCI and early AD. Determining sensitive and specific markers of very early AD progression can aid researchers and clinicians in developing new treatments and monitoring their effectiveness, as well as lessen the time and cost of clinical trials.
Michael W. Weiner, MD, Veterans Affairs Medical Center and University of California-San Francisco, is the Principal Investigator of this initiative. ADNI is the result of the efforts of many co-investigators from a broad range of academic institutions and private corporations. As part of the initial phase of ADNI, more than 800 participants, ages 55 to 90, were recruited from over 50 sites across the USA and Canada, including approximately 200 cognitively healthy older individuals (healthy control or HC) to be followed for three years, 400 people with MCI to be followed for three years and 200 people with early AD to be followed for two years. Further information about ADNI can be found in [30] and at http://www.adni-info.org.
The study was conducted after Institutional Review Board approval at each site. Written informed consent was obtained from all study participants or their authorized representatives.
2.2. Participants
Data from ninety-six participants in the ADNI cohort were evaluated. Participant selection was based on the availability of the following data: [11C]PiB PET scans, plasma measurements of Aβ1-40 and Aβ1-42 at time of PET scan, and APOE ε4 genotype data. At the time of PET scan, 22 participants were in the AD group, 52 in the MCI group and 22 in the HC group. The participants included 89 non-Hispanic Caucasians, two non-Hispanic African Americans, two non-Hispanic Asians, two Hispanic Caucasians, and one Caucasian participant of unknown ethnicity. Additional demographic information about the included sample is presented in Table 1.
Table 1.
Sample characteristics
| AD (n=22) | MCI (n=52) | HC (n=22) | p value* | |
|---|---|---|---|---|
| Initial [11C]PiB scans at baseline/12-month/24-month visit | 3/13/6 | 11/36/5 | 0/20/2 | 0.034 |
| Age at time of scan (years, Mean±SD) | 74.06±9.09 | 75.35±7.93 | 77.14±6.17 | 0.428 |
| Sex (Male/Female) | 15/7 | 35/17 | 14/8 | 0.940 |
| Education (years, Mean±SD) | 15.73±3.04 | 16.31±2.65 | 15.50±3.32 | 0.492 |
| Handedness (Right/Left) | 20/2 | 48/4 | 17/5 | 0.165 |
| APOE ε4 status (ε4−/ε4+) | 8/14 | 24/28 | 16/6 | 0.039 |
| Average regional [11C]PiB uptakea (Mean±SD) | 2.01±0.31 | 1.81±0.44 | 1.56±0.34 | 0.001 |
| Plasma Aβ1-40 (pg/mL, Mean±SD) | 160.99±47.89 | 171.56±48.60 | 168.75±36.57 | 0.666 |
| Plasma Aβ1-42 (pg/mL, Mean±SD) | 36.05±9.19 | 40.81±12.48 | 41.93±9.06 | 0.160 |
| Plasma Aβ1-40/Aβ1-42 (Mean±SD) | 4.53±1.20 | 4.38±1.19 | 4.11±0.81 | 0.440 |
Abbreviations: AD, Alzheimer’s disease; MCI, mild cognitive impairment; HC, healthy control.
For categorical variables, Pearson chi-square was used to compute the p value. For continuous variables, one-way analysis of variance was used to compute the p value.
Average regional [11C]PiB uptake is the average of [11C]PiB uptake values from four brain regions: anterior cingulate, frontal cortex, parietal cortex and precuneus, normalized to cerebellum.
2.2.1. [11C]PiB PET image data
For all participants, PET data consisted of each participant’s initial [11C]PiB scan in the ADNI longitudinal imaging protocol. Initial scans were acquired at either the participant’s baseline visit, 12-month visit, or 24-month visit (Table 1). Methods for the acquisition and processing of [11C]PiB PET scans for the ADNI sample have been described elsewhere [31, 32]. The PET data used in the present study were what was available as of October 2010. The ADNI database includes normalized whole-brain [11C]PiB images, as well as normalized regional [11C]PiB average uptake values extracted from anatomically-defined regions of interest (ROIs). Both pre-existing ROI data and whole-brain [11C]PiB images were downloaded and analyzed in the present study. Regional [11C]PiB standardized uptake value ratios (SUVR) from four ROIs (anterior cingulate, frontal cortex, parietal cortex and precuneus) were averaged and used as a quantitative phenotype, which will be referred to as “average regional [11C]PiB uptake”. This metric has been previously used to classify participants as positive or negative for amyloid deposition [32].
The whole-brain [11C]PiB PET images evaluated in the present study were preprocessed (“PIB Coreg, Avg, Std Img and Vox Size, Uniform Resolution”), as has been previously described [32]. Briefly, the images were set to a standard orientation and voxel size, intensity normalized using a cerebellar grey matter (GM) ROI, and smoothed to a common resolution of 8 mm full-width at half maximum. These pre-processed scans were downloaded in Neuroimaging Informatics Technology Initiative (NIfTI) format from the ADNI scan repository (http://adni.loni.ucla.edu) and processed further using Statistical Parametric Mapping [33] version 5 (SPM5) (http://www.fil.ion.ucl.ac.uk/spm/) implemented via MATLAB v7.1.0 (MathWorks, Natick, MA, USA) [34]. Specifically, for all participants, 1.5 Tesla T1-weighted 3D magnetization prepared rapid acquisition gradient echo (MP-RAGE) MRI scans [35] acquired at the same time point as the [11C]PiB scans were also downloaded from the ADNI site (http://adni.loni.ucla.edu). The pre-processed [11C]PiB PET image of each participant was co-registered to their corresponding MRI scan. PET and MRI data were then spatially normalized to Montreal Neurological Institute (MNI) space using transformation parameters estimated from the SPM segmentation algorithm [36]. These spatially-normalized PET images were used for the whole-brain voxel-wise analysis.
2.2.2. Plasma Aβ data
Plasma Aβ1-40 and Aβ1-42 levels for participants with [11C]PiB PET scans from the same time point that the PET data were acquired were obtained from the ADNI database. The methods for the collection, measurement and quality control (QC) of plasma samples have been previously described [22, 37].
2.2.3. APOE ε4 genotyping
The APOE ε4 status of all participants was determined by two single nucleotide polymorphisms (rs429358 and rs7412), as previously described [38]. Participants were classified as APOE ε4− (absence of the ε4 allele), or APOE ε4+ (presence of the ε4 allele).
2.3. Statistical analyses
The influence of APOE ε4 status on the association between plasma Aβ and average regional [11C]PiB uptake was assessed in R version 2.10.0 [39] and SAS 9.3 (SAS Institute Inc., Cary, NC, USA) using the following regression models:
Average regional [11C]PiB uptake=Plasma Aβ1-40+APOE ε4 status+(Plasma Aβ1-40*APOE ε4 status)
Average regional [11C]PiB uptake=Plasma Aβ1-42+APOE ε4 status+(Plasma Aβ1-42*APOE ε4 status)
Average regional [11C]PiB uptake=Plasma Aβ1-40/Aβ1-42+APOE ε4 status+(Plasma Aβ1-40/Aβ1-42*APOE ε4 status)
Models with significant interactions between plasma Aβ and APOE ε4 status on average regional [11C]PiB uptake were identified. For these models, the variance in average regional [11C]PiB uptake explained by different terms in the model was determined using the following regression models:
-
Variance in average regional [11C]PiB uptake explained by plasma Aβ term alone:
Average regional [11C]PiB uptake=Plasma Aβ
-
Variance in average regional [11C]PiB uptake explained by APOE ε4 status term alone:
Average regional [11C]PiB uptake=APOE ε4 status
-
Variance in average regional [11C]PiB uptake explained by plasma Aβ and APOE ε4 status terms together:
Average regional [11C]PiB uptake=Plasma Aβ+APOE ε4 status
-
Variance in average regional [11C]PiB uptake explained by plasma Aβ, APOE ε4 status, and (plasma Aβ*APOE ε4 status) terms together:
Average regional [11C]PiB uptake=Plasma Aβ+APOE ε4 status+(Plasma Aβ*APOE ε4 status)
The influence of APOE ε4 status on the association between plasma Aβ and [11C]PiB uptake was further assessed in whole-brain voxel-wise analyses in SPM5 using the following regression models:
Voxel [11C]PiB uptake=Plasma Aβ1-40+APOE ε4 status+(Plasma Aβ1-40*APOE ε4 status)
Voxel [11C]PiB uptake=Plasma Aβ1-42+APOE ε4 status+(Plasma Aβ1-42*APOE ε4 status)
Voxel [11C]PiB uptake=Plasma Aβ1-40/Aβ1-42+APOE ε4 status+(Plasma Aβ1-40/Aβ1-42*APOE ε4 status)
In the voxel-wise analyses, an explicit GM mask was used to restrict analyses to GM regions. Significant interactions were determined using a voxel-level threshold of p<0.005 (uncorrected) and cluster-level threshold of k≥200 contiguous voxels to achieve cluster-level uncorrected p<0.05. Clusters identified in the left or right cerebellum were not considered as the [11C]PiB PET images had been intensity normalized using a cerebellar GM region of interest. Voxels at which significant relationships existed were displayed on a three-dimensional rendered brain. The MNI coordinates of voxels that were peak maxima and local maxima (voxels>4 mm apart) in each cluster were converted to Talairach coordinates, and queried in Talairach Client v2.4.2 [40, 41] software to determine the associated anatomic labels. Random field theory corrected p values (pcorr) were used to identify significant clusters. Mean [11C]PiB uptake from each significant cluster was extracted for all participants and their distribution in APOE ε4− and APOE ε4+ participants was further examined in R version 2.10.0 and SAS 9.3. We then further evaluated the relationship of mean [11C]PiB uptake from the biggest and most significant cluster and plasma Aβ levels. The variance in mean [11C]PiB uptake extracted from the significant cluster explained by different terms in the model was determined using the following regression models:
-
Variance in mean [11C]PiB uptake from the significant cluster explained by plasma Aβ term alone:
Mean [11C]PiB uptake from the significant cluster=Plasma Aβ
-
Variance in mean [11C]PiB uptake from the significant cluster explained by APOE ε4 status term alone:
Mean [11C]PiB uptake from the significant cluster=APOE ε4 status
-
Variance in mean [11C]PiB uptake from the significant cluster explained by plasma Aβ and APOE ε4 status terms together:
Mean [11C]PiB uptake from the significant cluster=Plasma Aβ+APOE ε4 status
-
Variance in mean [11C]PiB uptake from the significant cluster explained by plasma Aβ, APOE ε4 status, and (plasma Aβ*APOE ε4 status) terms together:
Mean [11C]PiB uptake from the significant cluster=Plasma Aβ+APOE ε4 status+(Plasma Aβ*APOE ε4 status)
3. Results
We first investigated the influence of APOE ε4 status on the association between plasma Aβ and average regional [11C]PiB uptake. No significant interactions between plasma Aβ1-40 and APOE ε4 status or between plasma Aβ1-42 and APOE ε4 status were observed on average regional [11C]PiB uptake. However, a significant interaction between plasma Aβ1-40/Aβ1-42 and APOE ε4 status (p=0.025) on average regional [11C]PiB uptake was observed. Inclusion of age at time of scan and gender as covariates did not alter this finding. APOE ε4 genotype status (ε4− or ε4+) conferred different patterns of association between plasma Aβ1-40/Aβ1-42 and average regional [11C]PiB uptake. Specifically, in the APOE ε4− participants, there was a positive relationship between plasma Aβ1-40/Aβ1-42 and average regional [11C]PiB uptake (Slope=0.162; p=0.008; r2=0.141) (Fig. 1A). However, this relationship did not exist in the APOE ε4+ participants (Slope=−0.005; p=0.901; r2<0.001) (Fig. 1B). The APOE ε4 status and plasma Aβ1-40/Aβ1-42 terms explained 17% and 6% of variation in average regional [11C]PiB uptake, respectively. The two terms together explained 19% of variation in average regional [11C]PiB uptake. Inclusion of the (plasma Aβ1-40/Aβ1-42*APOE ε4 status) interaction term in the model increased the explained variance in average regional [11C]PiB uptake to 24%.
Fig. 1.

Scatter plots of plasma Aβ1-40/Aβ1-42 versus average regional [11C]PiB uptake from the (Average regional [11C]PiB uptake=Plasma Aβ1-40/Aβ1-42+APOE ε4 status+(Plasma Aβ1-40/Aβ1-42*APOE ε4 status) model (A and B), and plasma Aβ1-40/Aβ1-42 versus mean [11C]PiB uptake from the cluster identified in the (Voxel [11C]PiB uptake=Plasma Aβ1-40/Aβ1-42+APOE ε4 status+(Plasma Aβ1-40/Aβ1-42*APOE ε4 status)) model (C and D).
To further examine the spatial extent of the potential influence of the APOE ε4 status on the association of plasma Aβ and [11C]PiB uptake, we performed whole-brain voxel-wise regression analyses. APOE genotype did not significantly affect the positive or negative associations between plasma Aβ1-40 and [11C]PiB uptake and between plasma Aβ1-42 and [11C]PiB uptake in cerebral regions. However, APOE genotype significantly altered the negative correlation of plasma Aβ1-40/Aβ1-42 and [11C]PiB uptake in a significant cluster in the left inferior frontal gyrus (MNI peak coordinates: x=−40, y=18, z=−6; k=6152 voxels; cluster-level pcorr<0.001) (Fig. 2 and Table 2). Similar to the data from the average regional [11C]PiB uptake analysis, there was a positive relationship between plasma Aβ1-40/Aβ1-42 and mean [11C]PiB uptake from the inferior frontal gyral cluster in the APOE ε4− participants (Slope=0.250; p=0.001; r2=0.213) (Fig. 1C), but not in the APOE ε4+ participants (Slope=−0.050; p=0.404; r2=0.015) (Fig. 1D). Inclusion of age at time of scan and gender as covariates again did not alter this finding. The APOE ε4 status and plasma Aβ1-40/Aβ1-42 terms by themselves explained 13% and 4% of variation in mean [11C]PiB uptake from the significant cluster, respectively. The two terms together explained 14% of variation in mean [11C]PiB uptake from the significant cluster. Inclusion of the (plasma Aβ1-40/Aβ1-42*APOE ε4 status) interaction term along with the two terms in the model increased the variance explained in mean [11C]PiB uptake from the significant cluster to 23%. No clusters were identified when considering the positive correlation of plasma Aβ1-40/Aβ1-42 and [11C]PiB uptake.
Fig. 2.
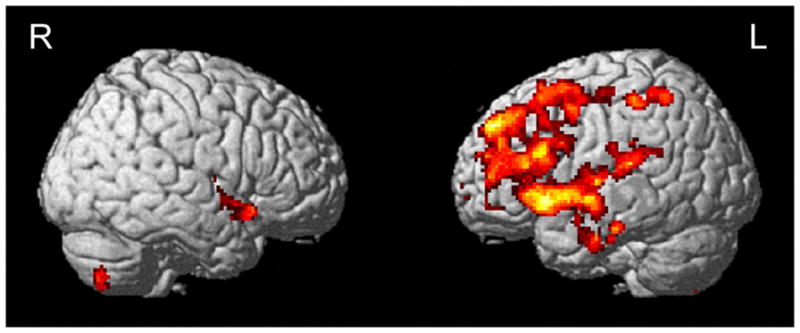
Brain regions identified in the (Voxel [11C]PiB uptake=Plasma Aβ1-40/Aβ1-42+APOE ε4 status+(Plasma Aβ1-40/Aβ1-42*APOE ε4 status)) model (voxel-level threshold of p<0.005 (uncorrected), cluster size≥200 voxels). The red-to-yellow scale indicates increasing statistical significance of association.
Table 2.
Brain regions identified in the (Voxel [11C]PiB uptake=Plasma Aβ1-40/Aβ1-42+APOE ε4 status+(Plasma Aβ1-40/Aβ1-42*APOE ε4 status) model (voxel-level threshold of p<0.005 (uncorrected), cluster size≥200 voxels)
| Region | Broadmann Area | Peak value coordinates (mm) | Voxel-level | Cluster-level | |||||
|---|---|---|---|---|---|---|---|---|---|
|
| |||||||||
| x | y | z | T value | pFWE-corr | k | puncorr | pcorr | ||
| Left inferior frontal gyrus | BA47 | −40 | 18 | −6 | 3.92 | 0.713 | 6152 | <0.001 | <0.001 |
| Left superior temporal gyrus | BA22 | −46 | 6 | −4 | 3.85 | 0.774 | |||
| Left middle frontal gyrus | BA6 | −30 | 12 | 60 | 3.81 | 0.816 | |||
| Left superior frontal gyrus | BA8 | −28 | 20 | 56 | 3.76 | 0.855 | |||
| Left precentral gyrus | BA4 | −34 | −20 | 52 | 3.68 | 0.910 | |||
| Left insula | BA13 | −42 | −8 | −8 | 3.58 | 0.955 | |||
| Left middle frontal gyrus | BA8 | −24 | 24 | 50 | 3.43 | 0.990 | |||
| Left middle frontal gyrus | BA10 | −36 | 42 | 14 | 3.40 | 0.993 | |||
| Left middle temporal gyrus | BA21 | −58 | −10 | −8 | 3.35 | 0.996 | |||
| Left superior frontal gyrus | BA9 | −18 | 48 | 34 | 3.29 | 0.998 | |||
| Left inferior frontal gyrus | BA45 | −50 | 20 | 20 | 3.24 | 0.999 | |||
| Left anterior cingulate | BA32 | 0 | 44 | 12 | 3.23 | 0.999 | |||
| Left superior frontal gyrus | BA10 | −26 | 42 | 30 | 3.19 | 1.000 | |||
| Left medial frontal gyrus | BA10 | −2 | 58 | −4 | 3.17 | 1.000 | |||
| Left inferior parietal lobule | BA40 | −54 | −22 | 26 | 3.16 | 1.000 | |||
| Left transverse temporal gyrus | BA41 | −48 | −26 | 10 | 3.16 | 1.000 | |||
| Left postcentral gyrus | BA40 | −48 | −34 | 54 | 3.73 | 0.878 | 273 | 0.023 | 0.448 |
| Left inferior parietal lobule | BA40 | −36 | −52 | 56 | 3.54 | 0.968 | |||
| Left inferior temporal gyrus | BA20 | −64 | −8 | −26 | 3.32 | 0.998 | 231 | 0.035 | 0.586 |
| Left fusiform gyrus | BA20 | −62 | −4 | −28 | 3.20 | 1.000 | |||
| Left middle temporal gyrus | BA21 | −54 | 0 | −18 | 2.84 | 1.000 | |||
| Right inferior frontal gyrus | BA47 | 42 | 14 | −14 | 3.32 | 0.998 | 262 | 0.026 | 0.482 |
| Right superior temporal gyrus | BA22 | 46 | 0 | −4 | 3.16 | 1.000 | |||
| Right sub-gyral | BA13 | 44 | 2 | −8 | 3.08 | 1.000 | |||
| Right insula | BA13 | 42 | −6 | 4 | 2.92 | 1.000 | |||
Abbreviations: pFWE-corr, Voxel-level p value after family-wise error correction; k, number of voxels in cluster; puncorr, Cluster-level uncorrected p value; pcorr, Cluster-level p value after random field theory correction.
4. Discussion
The investigation of Aβ species in plasma offers advantages over conventional methods for measuring Aβ levels in the brain and CSF. Obtaining and analyzing plasma samples is relatively inexpensive, minimally invasive, and can easily be performed at multiple time points. Therefore, a plasma-based biomarker for early detection and diagnosis of AD would be ideal. In the ADNI cohort, a strong association has been observed between CSF Aβ1-42 and fibrillar brain Aβ (indexed with [11C]PiB) [31], while a weak but significant association has been observed between CSF Aβ1-42 and soluble plasma Aβ1-42 [37]. However, the association between soluble plasma Aβ and fibrillar brain Aβ is unclear.
In the present report, we investigated the relationship of soluble plasma Aβ (Aβ1-40, Aβ1-42 and Aβ1-40/Aβ1-42), APOE ε4 status, and fibrillar brain Aβ (indexed with [11C]PiB) in the ADNI cohort. In two types of analytic approaches, APOE ε4 genotype status had a significant effect on the relationship between plasma Aβ1-40/Aβ1-42 and [11C]PiB uptake. Specifically, a positive relationship between plasma Aβ1-40/Aβ1-42 and [11C]PiB signal was observed in APOE ε4− participants, but not in APOE ε4+ participants (Fig. 1). This finding may reflect a stronger relationship between plasma Aβ and accumulation of fibrillar amyloid in the brain in individuals at an earlier and/or less severe disease state (e.g. APOE ε4−). A recent study suggested that plasma Aβ levels in cognitively stable individuals tend to increase slightly with age [15]. Cognitively normal individuals with higher plasma Aβ levels are thought to be at an increased risk of progression to AD. Plasma Aβ levels in individuals who go on to develop AD tend to be elevated in the pre-dementia stage, reach a peak, and then fall prior to developing clinical AD symptoms. Increasing brain amyloid deposits in the later stages of disease may perhaps reduce interstitial Aβ in the brain and CSF, confounding the relationship between plasma Aβ and brain amyloid.
The molecular mechanism by which the APOE ε4 allele leads to increased risk for AD is unclear. The APOE gene codes for the apoE protein, which is essential for maintaining BBB integrity [23]. Furthermore, the various apoE protein isoforms are thought to differentially clear Aβ from the brain into the plasma across the BBB. In a recent study, the authors found that mice expressing the human apoE4 protein had greater Aβ concentrations in the interstitial fluid of the brain and hippocampus and showed reduced Aβ clearance from the interstitial fluid of the brain when compared to mice expressing the human apoE2 or apoE3 proteins [24]. However, the authors did not find differences in Aβ synthesis or amyloidogenic processing between mice expressing the different apoE protein isoforms. In another study conducted in APOE ε2, ε3, and ε4 knock-in and APOE knock-out (KO) mice injected with lipidated recombinant apoE2, E3, and E4 proteins, the authors found a difference in peripheral Aβ clearance from the plasma by APOE genotype [25]. The results suggested that APOE ε4 gene expression results in a protein (apoE4) with lowered efficiency of peripheral Aβ clearance from the plasma. Tight junction integrity in the BBB is also regulated by the apoE protein in an isoform-dependent manner, with impaired tight junction integrity and increased BBB permeability observed in mice with the apoE4 isoform compared to mice with expression of the apoE3 isoform [26]. Thus, reduced Aβ clearance by apoE4 protein may lead to an impaired BBB, in turn, affecting Aβ levels in the brain and plasma and the relationship between these compartments.
Binding of the apoE protein to Aβ may also influence Aβ clearance from the brain into the plasma. The apoE protein binds strongly to Aβ, but the binding characteristics of the apoE4 isoform are different than those of the apoE3 isoform [42, 43]. Oxidized apoE4 binds more rapidly to synthetic Aβ than oxidized apoE3. Binding by oxidized apoE4 was also more sensitive to pH changes than oxidized apoE3. In addition, the APOE ε4 allele is associated with increased vascular and plaque amyloid deposits [44]. APOE ε4 homozygotes have higher amyloid deposits in the vasculature and tissue compared to APOE ε3 homozygotes. APOE ε3/ε4 heterozygotes have intermediate amyloid deposits. In a recent study, free apoE protein was shown to facilitate a greater removal of Aβ from the brain into the periphery across the BBB compared with apoE protein bound to Aβ [45]. Furthermore, apoE isoform-specific differences were observed in Aβ transport. Specifically, Aβ bound to the apoE4 isoform had increased blood to brain transport when compared to Aβ bound to the apoE3 isoform. Similar to a previous study, the authors found that the apoE4 isoform had decreased Aβ clearance across the BBB in comparison to the apoE3 isoform. More recently, the authors in a different study observed that retinoid X receptor stimulation increased Aβ clearance across the BBB, an effect which was believe to be partially mediated by the apoE protein [46].
The apoE protein has been shown to be present in greater amounts in the AD brain relative to those of healthy elders. Furthermore, apoE undergoes significantly more cleavage in the AD brain than in HC, especially in APOE ε4 carriers [47]. The N-terminal domain of the apoE protein contains the major receptor binding region and the C-terminal domain contains the lipid binding region. The C-terminal domain of both the apoE3 and apoE4 isoforms has been shown to interact closely with Aβ [47]. Isolated C-terminal–truncated apoE4 protein fragments have been shown to be associated with Aβ plaques [47]. Finally, inefficient clearance of Aβ peptides produces neuronal and behavioral deficits in mice [48]. Thus, differential clearance of Aβ by apoE protein isoform, which is coded for by different APOE genotypes, may be a potential explanation for the APOE genotype effects observed in the present study. Further investigation of mechanistic explanations is warranted.
It is important to discuss the limitations of the present study. First, the sample size in the present study was relatively modest, as only 96 participants in the ADNI cohort had both [11C]PiB PET scans and concomitant plasma measurements of Aβ1-40 and Aβ1-42. Our results suggest a complex relationship between plasma Aβ, brain Aβ, and APOE genotype, warranting further investigation in independent and larger samples. Second, a majority of the participants (n=52) in the present study had a diagnosis of MCI. Therefore, it is possible that the observed association may have been driven primarily by these participants. Due to the relatively small number of participants in the three diagnostic groups, we were unable to perform analyses within each diagnostic group to determine if there was an effect of diagnosis. Finally, genetic factors other than APOE may also play a role in modulating the association of plasma and brain Aβ. Investigation of the impact of other known and novel AD-associated genetic variants on the relationship between plasma and brain Aβ represents a possible future direction of this work.
5. Conclusions
In summary, we detected an association between soluble plasma Aβ and fibrillar brain Aβ that was modulated by APOE ε4 status. Replication and additional study in independent samples is needed to clarify the nature of this interaction, as well as to understand the underlying biological mechanisms. The present report suggests that plasma Aβ levels have great potential as an AD biomarker and underscores the importance of genetic variation in the interpretation of plasma Aβ levels.
Acknowledgments
Data collection and sharing for this project was funded by the Alzheimer’s Disease Neuroimaging Initiative (ADNI) (National Institutes of Health (NIH) Grant U01AG024904; RC2AG036535). ADNI is funded by the National Institute on Aging (NIA), the National Institute of Biomedical Imaging and Bioengineering, and through generous contributions from the following: Abbott; Alzheimer’s Association; Alzheimer’s Drug Discovery Foundation; Amorfix Life Sciences Ltd.; AstraZeneca; Bayer HealthCare; BioClinica, Inc.; Biogen Idec Inc.; Bristol-Myers Squibb Company; Eisai Inc.; Elan Pharmaceuticals Inc.; Eli Lilly and Company; F. Hoffmann-La Roche Ltd and its affiliated company Genentech, Inc.; GE Healthcare; Innogenetics, N.V.; IXICO Ltd.; Janssen Alzheimer Immunotherapy Research & Development, LLC.; Johnson & Johnson Pharmaceutical Research & Development LLC.; Medpace, Inc.; Merck & Co., Inc.; Meso Scale Diagnostics, LLC.; Novartis Pharmaceuticals Corporation; Pfizer Inc.; Servier; Synarc Inc.; and Takeda Pharmaceutical Company. The Canadian Institutes of Health Research is providing funds to support ADNI clinical sites in Canada. Private sector contributions are facilitated by the Foundation for the National Institutes of Health (www.fnih.org). The grantee organization is the Northern California Institute for Research and Education, and the study is coordinated by the Alzheimer’s Disease Cooperative Study at the University of California, San Diego. ADNI data are disseminated by the Laboratory for Neuro Imaging at the University of California, Los Angeles. This research was also supported by NIH grants P30AG010129, K01AG030514, the Dana Foundation, U01AG032984 Alzheimer’s Disease Genetics Consortium grant, NIA R01AG19771, P30AG010133, the Indiana Economic Development Corporation (IEDC #87884), and Foundation for the NIH for data analysis. We also thank the following people: genotyping at TGen: Matthew Huentelman, PhD and David Craig, PhD, and sample processing, storage and distribution at the National Cell Repository for Alzheimer’s Disease (NCRAD): Kelley Faber and Colleen Mitchell. Samples from the NCRAD, which receives government support under a cooperative agreement (U24AG021886) awarded by the NIA were used in this study. The authors would like to thank contributors who collected samples as well as patients and their families, whose participation and help made this work possible.
Footnotes
Conflict of Interest Disclosure:
The authors declare no conflicts of interest relevant to the present work.
Publisher's Disclaimer: This is a PDF file of an unedited manuscript that has been accepted for publication. As a service to our customers we are providing this early version of the manuscript. The manuscript will undergo copyediting, typesetting, and review of the resulting proof before it is published in its final citable form. Please note that during the production process errors may be discovered which could affect the content, and all legal disclaimers that apply to the journal pertain.
References
- 1.Alzheimer’s Association. 2012 Alzheimer’s disease facts and figures. Alzheimers Dement. 2012;8:131–68. doi: 10.1016/j.jalz.2012.02.001. [DOI] [PubMed] [Google Scholar]
- 2.Hampel H, Frank R, Broich K, Teipel SJ, Katz RG, Hardy J, et al. Biomarkers for Alzheimer’s disease: academic, industry and regulatory perspectives. Nat Rev Drug Discov. 2010;9:560–74. doi: 10.1038/nrd3115. [DOI] [PubMed] [Google Scholar]
- 3.Petersen RC, Smith GE, Waring SC, Ivnik RJ, Tangalos EG, Kokmen E. Mild cognitive impairment: clinical characterization and outcome. Arch Neurol. 1999;56:303–8. doi: 10.1001/archneur.56.3.303. [DOI] [PubMed] [Google Scholar]
- 4.Albert MS, DeKosky ST, Dickson D, Dubois B, Feldman HH, Fox NC, et al. The diagnosis of mild cognitive impairment due to Alzheimer’s disease: recommendations from the National Institute on Aging-Alzheimer’s Association workgroups on diagnostic guidelines for Alzheimer’s disease. Alzheimers Dement. 2011;7:270–9. doi: 10.1016/j.jalz.2011.03.008. [DOI] [PMC free article] [PubMed] [Google Scholar]
- 5.Shaw LM, Vanderstichele H, Knapik-Czajka M, Clark CM, Aisen PS, Petersen RC, et al. Cerebrospinal fluid biomarker signature in Alzheimer’s disease neuroimaging initiative subjects. Ann Neurol. 2009;65:403–13. doi: 10.1002/ana.21610. [DOI] [PMC free article] [PubMed] [Google Scholar]
- 6.Okonkwo OC, Mielke MM, Griffith HR, Moghekar AR, O’Brien RJ, Shaw LM, et al. Cerebrospinal fluid profiles and prospective course and outcome in patients with amnestic mild cognitive impairment. Arch Neurol. 2011;68:113–9. doi: 10.1001/archneurol.2010.334. [DOI] [PMC free article] [PubMed] [Google Scholar]
- 7.Buchhave P, Minthon L, Zetterberg H, Wallin AK, Blennow K, Hansson O. Cerebrospinal fluid levels of beta-amyloid 1–42, but not of tau, are fully changed already 5 to 10 years before the onset of Alzheimer dementia. Arch Gen Psychiatry. 2012;69:98–106. doi: 10.1001/archgenpsychiatry.2011.155. [DOI] [PubMed] [Google Scholar]
- 8.Rabinovici GD, Jagust WJ. Amyloid imaging in aging and dementia: testing the amyloid hypothesis in vivo. Behav Neurol. 2009;21:117–28. doi: 10.3233/BEN-2009-0232. [DOI] [PMC free article] [PubMed] [Google Scholar]
- 9.Choi SR, Schneider JA, Bennett DA, Beach TG, Bedell BJ, Zehntner SP, et al. Correlation of amyloid PET ligand florbetapir F 18 binding with Abeta aggregation and neuritic plaque deposition in postmortem brain tissue. Alzheimer Dis Assoc Disord. 2012;26:8–16. doi: 10.1097/WAD.0b013e31821300bc. [DOI] [PMC free article] [PubMed] [Google Scholar]
- 10.Clark CM, Schneider JA, Bedell BJ, Beach TG, Bilker WB, Mintun MA, et al. Use of florbetapir-PET for imaging beta-amyloid pathology. JAMA. 2011;305:275–83. doi: 10.1001/jama.2010.2008. [DOI] [PMC free article] [PubMed] [Google Scholar]
- 11.Jack CR, Jr, Lowe VJ, Senjem ML, Weigand SD, Kemp BJ, Shiung MM, et al. 11C PiB and structural MRI provide complementary information in imaging of Alzheimer’s disease and amnestic mild cognitive impairment. Brain. 2008;131:665–80. doi: 10.1093/brain/awm336. [DOI] [PMC free article] [PubMed] [Google Scholar]
- 12.Klunk WE, Engler H, Nordberg A, Wang Y, Blomqvist G, Holt DP, et al. Imaging brain amyloid in Alzheimer’s disease with Pittsburgh Compound-B. Ann Neurol. 2004;55:306–19. doi: 10.1002/ana.20009. [DOI] [PubMed] [Google Scholar]
- 13.Wong DF, Rosenberg PB, Zhou Y, Kumar A, Raymont V, Ravert HT, et al. In vivo imaging of amyloid deposition in Alzheimer disease using the radioligand 18F-AV-45 (florbetapir [corrected] F 18) J Nucl Med. 2010;51:913–20. doi: 10.2967/jnumed.109.069088. [DOI] [PMC free article] [PubMed] [Google Scholar]
- 14.Mayeux R, Schupf N. Blood-based biomarkers for Alzheimer’s disease: plasma Abeta40 and Abeta42, and genetic variants. Neurobiol Aging. 2011;32 (Suppl 1):S10–9. doi: 10.1016/j.neurobiolaging.2011.09.004. [DOI] [PMC free article] [PubMed] [Google Scholar]
- 15.Song F, Poljak A, Valenzuela M, Mayeux R, Smythe GA, Sachdev PS. Meta-analysis of plasma amyloid-beta levels in Alzheimer’s disease. J Alzheimers Dis. 2011;26:365–75. doi: 10.3233/JAD-2011-101977. [DOI] [PMC free article] [PubMed] [Google Scholar]
- 16.Koyama A, Okereke OI, Yang T, Blacker D, Selkoe DJ, Grodstein F. Plasma Amyloid-beta as a Predictor of Dementia and Cognitive Decline: A Systematic Review and Meta-analysis. Arch Neurol. 2012 doi: 10.1001/archneurol.2011.1841. [DOI] [PMC free article] [PubMed] [Google Scholar]
- 17.Thambisetty M, Lovestone S. Blood-based biomarkers of Alzheimer’s disease: challenging but feasible. Biomark Med. 2010;4:65–79. doi: 10.2217/bmm.09.84. [DOI] [PMC free article] [PubMed] [Google Scholar]
- 18.Corder EH, Saunders AM, Strittmatter WJ, Schmechel DE, Gaskell PC, Small GW, et al. Gene dose of apolipoprotein E type 4 allele and the risk of Alzheimer’s disease in late onset families. Science. 1993;261:921–3. doi: 10.1126/science.8346443. [DOI] [PubMed] [Google Scholar]
- 19.Saunders AM, Strittmatter WJ, Schmechel D, George-Hyslop PH, Pericak-Vance MA, Joo SH, et al. Association of apolipoprotein E allele epsilon 4 with late-onset familial and sporadic Alzheimer’s disease. Neurology. 1993;43:1467–72. doi: 10.1212/wnl.43.8.1467. [DOI] [PubMed] [Google Scholar]
- 20.Farrer LA, Cupples LA, Haines JL, Hyman B, Kukull WA, Mayeux R, et al. Effects of age, sex, and ethnicity on the association between apolipoprotein E genotype and Alzheimer disease. A meta-analysis. APOE and Alzheimer Disease Meta Analysis Consortium. JAMA. 1997;278:1349–56. [PubMed] [Google Scholar]
- 21.Reiman EM, Chen K, Liu X, Bandy D, Yu M, Lee W, et al. Fibrillar amyloid-beta burden in cognitively normal people at 3 levels of genetic risk for Alzheimer’s disease. Proc Natl Acad Sci U S A. 2009;106:6820–5. doi: 10.1073/pnas.0900345106. [DOI] [PMC free article] [PubMed] [Google Scholar]
- 22.Toledo JB, Vanderstichele H, Figurski M, Aisen PS, Petersen RC, Weiner MW, et al. Factors affecting Abeta plasma levels and their utility as biomarkers in ADNI. Acta Neuropathol. 2011;122:401–13. doi: 10.1007/s00401-011-0861-8. [DOI] [PMC free article] [PubMed] [Google Scholar]
- 23.Donahue JE, Johanson CE. Apolipoprotein E, amyloid-beta, and blood-brain barrier permeability in Alzheimer disease. J Neuropathol Exp Neurol. 2008;67:261–70. doi: 10.1097/NEN.0b013e31816a0dc8. [DOI] [PubMed] [Google Scholar]
- 24.Castellano JM, Kim J, Stewart FR, Jiang H, DeMattos RB, Patterson BW, et al. Human apoE isoforms differentially regulate brain amyloid-beta peptide clearance. Sci Transl Med. 2011;3:89ra57. doi: 10.1126/scitranslmed.3002156. [DOI] [PMC free article] [PubMed] [Google Scholar]
- 25.Sharman MJ, Morici M, Hone E, Berger T, Taddei K, Martins IJ, et al. APOE genotype results in differential effects on the peripheral clearance of amyloid-beta42 in APOE knock-in and knock-out mice. J Alzheimers Dis. 2010;21:403–9. doi: 10.3233/JAD-2010-100141. [DOI] [PMC free article] [PubMed] [Google Scholar]
- 26.Nishitsuji K, Hosono T, Nakamura T, Bu G, Michikawa M. Apolipoprotein E regulates the integrity of tight junctions in an isoform-dependent manner in an in vitro blood-brain barrier model. J Biol Chem. 2011;286:17536–42. doi: 10.1074/jbc.M111.225532. [DOI] [PMC free article] [PubMed] [Google Scholar]
- 27.Fagan AM, Mintun MA, Mach RH, Lee SY, Dence CS, Shah AR, et al. Inverse relation between in vivo amyloid imaging load and cerebrospinal fluid Abeta42 in humans. Ann Neurol. 2006;59:512–9. doi: 10.1002/ana.20730. [DOI] [PubMed] [Google Scholar]
- 28.Lui JK, Laws SM, Li QX, Villemagne VL, Ames D, Brown B, et al. Plasma amyloid-beta as a biomarker in Alzheimer’s disease: the AIBL study of aging. J Alzheimers Dis. 2010;20:1233–42. doi: 10.3233/JAD-2010-090249. [DOI] [PubMed] [Google Scholar]
- 29.Devanand DP, Schupf N, Stern Y, Parsey R, Pelton GH, Mehta P, et al. Plasma Abeta and PET PiB binding are inversely related in mild cognitive impairment. Neurology. 2011;77:125–31. doi: 10.1212/WNL.0b013e318224afb7. [DOI] [PMC free article] [PubMed] [Google Scholar]
- 30.Weiner MW, Aisen PS, Jack CR, Jr, Jagust WJ, Trojanowski JQ, Shaw L, et al. The Alzheimer’s disease neuroimaging initiative: progress report and future plans. Alzheimers Dement. 2010;6:202–11. doi: 10.1016/j.jalz.2010.03.007. [DOI] [PMC free article] [PubMed] [Google Scholar]
- 31.Jagust WJ, Landau SM, Shaw LM, Trojanowski JQ, Koeppe RA, Reiman EM, et al. Relationships between biomarkers in aging and dementia. Neurology. 2009;73:1193–9. doi: 10.1212/WNL.0b013e3181bc010c. [DOI] [PMC free article] [PubMed] [Google Scholar]
- 32.Jagust WJ, Bandy D, Chen K, Foster NL, Landau SM, Mathis CA, et al. The Alzheimer’s Disease Neuroimaging Initiative positron emission tomography core. Alzheimers Dement. 2010;6:221–9. doi: 10.1016/j.jalz.2010.03.003. [DOI] [PMC free article] [PubMed] [Google Scholar]
- 33.Friston KJ, Holmes AP, Worsley KJ, Poline JP, Frith CD, Frackowiak RSJ. Statistical parametric maps in functional imaging: A general linear approach. Hum Brain Mapp. 1994;2:189–210. [Google Scholar]
- 34.Swaminathan S, Shen L, Risacher SL, Yoder KK, West JD, Kim S, et al. Amyloid pathway-based candidate gene analysis of [(11)C]PiB-PET in the Alzheimer’s Disease Neuroimaging Initiative (ADNI) cohort. Brain Imaging Behav. 2012;6:1–15. doi: 10.1007/s11682-011-9136-1. [DOI] [PMC free article] [PubMed] [Google Scholar]
- 35.Jack CR, Jr, Bernstein MA, Fox NC, Thompson P, Alexander G, Harvey D, et al. The Alzheimer’s Disease Neuroimaging Initiative (ADNI): MRI methods. J Magn Reson Imaging. 2008;27:685–91. doi: 10.1002/jmri.21049. [DOI] [PMC free article] [PubMed] [Google Scholar]
- 36.Risacher SL, Saykin AJ, West JD, Shen L, Firpi HA, McDonald BC, et al. Baseline MRI predictors of conversion from MCI to probable AD in the ADNI cohort. Curr Alzheimer Res. 2009;6:347–61. doi: 10.2174/156720509788929273. [DOI] [PMC free article] [PubMed] [Google Scholar]
- 37.Figurski MJ, Waligorska T, Toledo J, Vanderstichele H, Korecka M, Lee VM, et al. Improved protocol for measurement of plasma beta-amyloid in longitudinal evaluation of Alzheimer’s Disease Neuroimaging Initiative study patients. Alzheimers Dement. 2012;8:250–60. doi: 10.1016/j.jalz.2012.01.001. [DOI] [PMC free article] [PubMed] [Google Scholar]
- 38.Saykin AJ, Shen L, Foroud TM, Potkin SG, Swaminathan S, Kim S, et al. Alzheimer’s Disease Neuroimaging Initiative biomarkers as quantitative phenotypes: Genetics core aims, progress, and plans. Alzheimers Dement. 2010;6:265–73. doi: 10.1016/j.jalz.2010.03.013. [DOI] [PMC free article] [PubMed] [Google Scholar]
- 39.R Core Team. R: A Language and Environment for Statistical Computing. Vienna, Austria: R Foundation for Statistical Computing; 2012. [Google Scholar]
- 40.Lancaster JL, Rainey LH, Summerlin JL, Freitas CS, Fox PT, Evans AC, et al. Automated labeling of the human brain: a preliminary report on the development and evaluation of a forward-transform method. Hum Brain Mapp. 1997;5:238–42. doi: 10.1002/(SICI)1097-0193(1997)5:4<238::AID-HBM6>3.0.CO;2-4. [DOI] [PMC free article] [PubMed] [Google Scholar]
- 41.Lancaster JL, Woldorff MG, Parsons LM, Liotti M, Freitas CS, Rainey L, et al. Automated Talairach atlas labels for functional brain mapping. Hum Brain Mapp. 2000;10:120–31. doi: 10.1002/1097-0193(200007)10:3<120::AID-HBM30>3.0.CO;2-8. [DOI] [PMC free article] [PubMed] [Google Scholar]
- 42.Strittmatter WJ, Saunders AM, Schmechel D, Pericak-Vance M, Enghild J, Salvesen GS, et al. Apolipoprotein E: high-avidity binding to beta-amyloid and increased frequency of type 4 allele in late-onset familial Alzheimer disease. Proc Natl Acad Sci U S A. 1993;90:1977–81. doi: 10.1073/pnas.90.5.1977. [DOI] [PMC free article] [PubMed] [Google Scholar]
- 43.Strittmatter WJ, Weisgraber KH, Huang DY, Dong LM, Salvesen GS, Pericak-Vance M, et al. Binding of human apolipoprotein E to synthetic amyloid beta peptide: isoform-specific effects and implications for late-onset Alzheimer disease. Proc Natl Acad Sci U S A. 1993;90:8098–102. doi: 10.1073/pnas.90.17.8098. [DOI] [PMC free article] [PubMed] [Google Scholar]
- 44.Schmechel DE, Saunders AM, Strittmatter WJ, Crain BJ, Hulette CM, Joo SH, et al. Increased amyloid beta-peptide deposition in cerebral cortex as a consequence of apolipoprotein E genotype in late-onset Alzheimer disease. Proc Natl Acad Sci U S A. 1993;90:9649–53. doi: 10.1073/pnas.90.20.9649. [DOI] [PMC free article] [PubMed] [Google Scholar]
- 45.Bachmeier C, Paris D, Beaulieu-Abdelahad D, Mouzon B, Mullan M, Crawford F. A Multifaceted Role for apoE in the Clearance of Beta-Amyloid across the Blood-Brain Barrier. Neurodegener Dis. 2012 doi: 10.1159/000337231. [DOI] [PubMed] [Google Scholar]
- 46.Bachmeier C, Beaulieu-Abdelahad D, Crawford F, Mullan M, Paris D. Stimulation of the Retinoid X Receptor Facilitates Beta-Amyloid Clearance Across the Blood-Brain Barrier. J Mol Neurosci. 2012 doi: 10.1007/s12031-012-9866-6. [DOI] [PubMed] [Google Scholar]
- 47.Jones PB, Adams KW, Rozkalne A, Spires-Jones TL, Hshieh TT, Hashimoto T, et al. Apolipoprotein E: isoform specific differences in tertiary structure and interaction with amyloid-beta in human Alzheimer brain. PLoS One. 2011;6:e14586. doi: 10.1371/journal.pone.0014586. [DOI] [PMC free article] [PubMed] [Google Scholar]
- 48.Bien-Ly N, Andrews-Zwilling Y, Xu Q, Bernardo A, Wang C, Huang Y. C-terminal-truncated apolipoprotein (apo) E4 inefficiently clears amyloid-beta (Abeta) and acts in concert with Abeta to elicit neuronal and behavioral deficits in mice. Proc Natl Acad Sci U S A. 2011;108:4236–41. doi: 10.1073/pnas.1018381108. [DOI] [PMC free article] [PubMed] [Google Scholar]