

Background: Why do ancestral GSTs utilize cysteine/serine as catalytic residues, whereas more recently evolved GSTs utilize tyrosine?
Results: Only the more recently evolved GSTs display enough affinity to bind and make harmless the toxic DNDGIC (a natural NO carrier).
Conclusion: GST evolution could be linked to the defense against NO.
Significance: This represents a further piece in the puzzle of evolutive adaptation to NO toxicity.
Keywords: Enzyme Inhibitors, Enzyme Structure, Enzymes, Evolution, Nitric Oxide, Dinitrosyl Iron Complex, Glutathione Transferase
Abstract
Glutathione transferases (GSTs) are protection enzymes capable of conjugating glutathione (GSH) to toxic compounds. During evolution an important catalytic cysteine residue involved in GSH activation was replaced by serine or, more recently, by tyrosine. The utility of these replacements represents an enigma because they yield no improvements in the affinity toward GSH or in its reactivity. Here we show that these changes better protect the cell from nitric oxide (NO) insults. In fact the dinitrosyl·diglutathionyl·iron complex (DNDGIC), which is formed spontaneously when NO enters the cell, is highly toxic when free in solution but completely harmless when bound to GSTs. By examining 42 different GSTs we discovered that only the more recently evolved Tyr-based GSTs display enough affinity for DNDGIC (KD < 10−9 m) to sequester the complex efficiently. Ser-based GSTs and Cys-based GSTs show affinities 102–104 times lower, not sufficient for this purpose. The NO sensitivity of bacteria that express only Cys-based GSTs could be related to the low or null affinity of their GSTs for DNDGIC. GSTs with the highest affinity (Tyr-based GSTs) are also over-represented in the perinuclear region of mammalian cells, possibly for nucleus protection. On the basis of these results we propose that GST evolution in higher organisms could be linked to the defense against NO.
Introduction
Glutathione transferases (GSTs) are a superfamily of enzymes expressed in almost all living organisms, from bacteria to humans, and are devoted to cell protection, acting both as catalysts and as ligandins (1, 2). Microsomal GSTs, mitochondrial GSTs, and cytosolic GSTs are the three families that represent almost all GSTs in living systems. Based on sequence similarity, substrate and inhibitor sensitivity, and immunological properties, cytosolic GSTs have been grouped into more than 16 gene-independent GST classes identified by Greek letters (3, 4). A common ability of all GSTs is to bind reduced glutathione (GSH) and lower the pKa of its sulfhydryl group thereby increasing its reactivity toward dangerous alkylating toxins, hydroxy-nonenals, peroxides, and disulfides (1, 5). GSH activation is favored by a crucial residue at the active site (Tyr, Ser, or Cys) whose hydroxyl or sulfhydryl group is within hydrogen bonding distance of the sulfur atom of GSH.
From an evolutionary point of view, it is well accepted that GSTs evolved from an ancestral thioredoxin-like protein similar to the proteins forming the thiol reductase superfamily (1, 6). Indeed, the most ancient GSTs possess an important cysteine in the active site involved in the GSH activation. This residue is present in the Beta class bacterial GSTs, in the Omega class (also present in mammals), and in other distinct GSTs expressed in many parasites and microorganisms. In a parallel or successive evolutionary step, a serine residue replaced Cys in this activation role. This residue is found in the Theta, Tau, Delta, Zeta, Epsilon, and Phi classes GSTs. Finally, the most recently evolved GSTs possess a tyrosine residue involved in GSH activation (e.g. Alpha, Pi, Mu, Sigma, Plasmodium falciparum GST, Onchocerca volvulus GST, and Schistosoma GSTs). No convincing explanations have been proposed for the evolutionary necessity or utility of these replacements.
As will be shown here, these three distinct subfamilies (Cys-based GSTs, Ser-based GSTs, and Tyr-based GSTs) are able to bind GSH with similar affinities and also to cause a very efficient activation of its sulfhydryl group. Even the different co-substrate specificity or ability to catalyze peculiar reactions found in specific isoenzymes does not represent a reasonable cause for the Cys/Ser/Tyr replacements because many GSTs display similar or different co-substrate specificity or peculiar catalysis irrespective of the presence of Tyr, Ser, or Cys in the active site. Here we show for the first time that these replacements may be selected to better protect the organism from nitric oxide (NO) insult.
NO is a multifunctional molecule that is used with different degrees of complexity in all organisms. The high affinity of NO for transition metal centers like heme, and the rapid reaction of NO with thiols (to form S-nitrosothiols) and oxygen-derived free radicals can explain many of its biological and pathological properties (7). However, when NO enters the cell or is produced inside the cell, a further spontaneous reaction occurs, involving endogenous thiols and labile iron, leading to the formation of dinitrosyl·iron complexes. These compounds display paramagnetic properties (g = 2.03) and can function as NO carriers by virtue of their relatively high stability (minutes) compared with free NO (seconds) (8). The low mass dinitrosyl·diglutathionyl iron complex (DNDGIC)4 (Fig. 1A) is probably the most abundant dinitrosyl·iron complex formed inside the cell in case of NO insult, because GSH is always present in the cytosol at high concentrations (1–10 mm). However, DNDGIC is also dangerous to the cell because, even at micromolar levels, it inactivates irreversibly glutathione reductase, a key enzyme fundamental for cellular redox balance (9, 10).
FIGURE 1.

Formula of DNDGIC and structures of GSH bound to GSTs. A, chemical structure of DNDGIC. B, superimposition of GSH in the crystallographic structures of GSTs (for the 20 Tyr-GSTs, 14 Ser-GSTs, and 8 Cys-GSTs listed in Table 2). Catalytic residues are also shown. The only divergent crystal structures are hGSTZ1-1 (a Ser-GST) and hGSTO1-1 (a Cys-GST).
Thus it is not surprising that this iron complex has never been found in vivo in the free state but always in a harmless form bound to “unknown” proteins (8). In hepatocytes and in other mammalian cells these proteins have recently been identified as GSTs (11–13). Mammalian GSTs, in particular the Alpha, Pi, and Mu class GSTs, can accomplish this function by virtue of their high expression in all tissues (e.g. 0.5–0.8 mm in liver) and their strong affinity for this complex (KD = 10−9–10−10 m) (12, 14). It was also noted that one Ser-GST (GSTT2-2) and one Cys-GST (GSTB1-1) display less affinity suggesting the possibility of an evolutionary development of this interaction (12).
In the present work we have studied the interaction of GSTs with DNDGIC by means of EPR, kinetics, and site-directed mutagenesis experiments on many purified GST isoenzymes, whose structures (in complex with GSH) have been solved previously, in combination with ab initio calculations and docking studies. Our data demonstrate that only the more recently evolved GSTs, i.e. the Tyr-based GSTs, are able to protect the cell efficiently from the cytotoxic activity of DNDGIC. The structural and electrostatic properties of Cys-based GSTs and Ser-based GSTs provide the explanation for their lower affinity for DNDGIC. Interestingly, the GSTs with the greatest affinity are also localized in the perinuclear region suggesting that, beside key cytosolic enzymes, further targets of protection may be DNA or the transcription machinery localized inside the nucleus.
EXPERIMENTAL PROCEDURES
Protein Expression and Purification
GSTs were expressed and purified as reported previously. In particular, Tyr-GST: hGSTA1-1 (12), hGSTM2-2 (12), hGSTP1-1 (12), hGSTA2-2 (15), and hGSTA3-3 (16), O. volvulus GST2 (17), Schistosoma hematobium GST (18), P. falciparum GST (19), and squid GST (20); Ser-GSTs: hGSTT2-2 (21), Phi 1 GST Mais (22), hGSTZ (23), Anopheles dirus GSTD3-3 (24), A. dirus GSTD4-4 (25), A. dirus GSTD5-5 (26); Cys-GSTs: hGSTO1-1 (27) Proteus mirabilis GSTB1-1 (12), Sphingomonas paucimobilis GST (supplemental Methods), Burkholderia xenovorans GST (28), Ochrobactrum anthropi GST (29), and Coccidioides immitis GST (30). Mutant GSTs were expressed and purified as follows: Y7F hGSTP1-1 (31), Y7C hGSTP1-1 (31), S11A hGSTT2-2 (32), C10A GST from P. mirabilis (33), and C10A GST from O. anthropi (34).
DNDGIC Synthesis
DNDGIC was prepared essentially as described previously (14). Briefly, 1 ml of 0.5 mm FeSO4 (dissolved in degassed water to avoid rapid oxidation to the ferric state) was added to 10 ml (final volume) of 0.1 mm potassium phosphate buffer, pH 7.4, containing 20 mm GSH and 2 mm GSNO (25 °C). After 10 min, the reaction was almost complete, and the resulting stock solution of DNDGIC (50 μm) was stable for at least 3 h.
DNDGIC Binding
The interaction of DNDGIC with Tyr-GSTs and Ser-GSTs has been studied by means of inhibition experiments using the classical enzymatic reaction, i.e. GSH (1 mm), 1-chloro-2,4-dinitrobenzene (1 mm) in 0.1 m potassium phosphate buffer. The procedure was identical to that described previously (12). Inhibition kinetic data were fitted to the classical equation of competitive inhibition by assuming that the binding of DNGIC competes with the binding of free GSH in the G-site. As demonstrated previously, this approach provides KD values very similar to those obtained using stopped-flow or fluorescence quenching methods (12). As many GSTs show negative cooperativity in DNDGIC binding, for the sake of simplicity we only reported KD values for the high affinity binding site.
EPR Experiments
Due to the very low affinity of many Cys-GSTs for DNDGIC, EPR binding experiments was the preferred approach to determine KD values, because it is performed with enzyme and complex concentrations 10–100 times higher than those used for kinetic studies. Still, for some GSTs a detectable amount of bound DNGIC could not been obtained. In these cases we assumed that the bound species was less than 5% and this percent has been used to calculate a limit value for KD as reported in Table 1. This limit value is not identical for all low affinity GSTs as it also depends on the enzyme concentrations used in the EPR experiments. In a typical EPR experiment, GST samples were prepared in 0.1 m potassium phosphate buffer, pH 7.4, with DNDGIC added from a freshly made stock solution. EPR measurements were made at room temperature (22–25 °C) with a Bruker ESP300 X-band instrument (Bruker, Karlsruhe, Germany) equipped with a high sensitivity TM110-mode cavity. To optimize instrument sensitivity, spectra were recorded using samples of 80 μl contained in flat glass capillaries (inner cross-section 5 × 0.3 mm). Unless otherwise stated, spectra were measured over a 200 G range using 20 milliwatt power, 2.0 G modulation, and a scan time of 42 s; typically 4–40 single scans were accumulated to improve the signal to noise ratio. High resolution spectra were recorded with 0.1 G modulation and 2 milliwatt power.
TABLE 1.
Km for GSH (determined experimentally in the present study or available from the literature) and KD values for DNGIC·GST complex coming from kinetic or EPR experiments
For many Cys-GSTs, the lack of detectable amounts of bound DNGIC in EPR experiments allows us to report only a lower limiting value for KD.
| PDB ID | GSTs | Experimental Km for GSHa,b | Experimental KD for DNGIC-GST bindinga |
|---|---|---|---|
| m | m | ||
| Tyrosine subfamily | |||
| 6GSS | hGSTP1-1 | 1.5 × 10⁻⁴ | 1.5 × 10⁻⁹ |
| hGSTP1-1 Y7C | 7.3 × 10⁻⁴ | 1.3 × 10⁻⁶ | |
| hGSTP1-1 Y7F | 1.6 × 10⁻⁴ | 1.5 × 10⁻⁶ | |
| 1GLP | mGSTYfYf | 0.9 × 10⁻⁴ | |
| 1TU8 | O. volvulus GST2 | 0.5 × 10⁻⁴ | |
| 1K3L | hGSTA1-1 | 1.3 × 10⁻⁴ | 8.0 × 10⁻¹¹ |
| 2WJU | hGSTA2-2 | 2.0 × 10⁻⁴ | 2.0 × 10⁻¹⁰ |
| 1TDI | hGSTA3-3 | 2.0 × 10⁻⁴ | 7.0 × 10⁻¹¹ |
| 1GUL | hGSTA4-4 | 1.0 × 10⁻³ | |
| 1GSU | cGSTM1-1 | 0.5 × 10⁻⁴ | |
| 2AB6 | hGSTM2-2 | 1.1 × 10⁻⁴ | 1.2 × 10⁻⁹ |
| 6GST | rGSTM3-3 | 1.3 × 10⁻⁴ | |
| 1M9A | S. japonicum GST | 4.3 × 10⁻⁴ | |
| 1OE7 | S. haematobium GST | 4.0 × 10⁻⁴ | <5.0 × 10⁻¹⁰ |
| 1Q4J | P. falciparum GST | 1.5 × 10⁻⁴ | 3.0 × 10⁻⁷ |
| 1U3I | S. mansoni GST | 3.7 × 10⁻⁴ | |
| 1GSQ | Squid GSTS | 4.5 × 10⁻⁴ | 4.0 × 10⁻¹⁰ |
| Serine subfamily | |||
| 1AXD | Phi 1 GST Mais | 2.0 × 10⁻⁴ | 2.0 × 10⁻⁷ |
| L. cuprina GST | 5.0 × 10⁻⁴ | ||
| 1JLV | AdGSTD3-3 | 4.0 × 10⁻⁴ | 1.4 × 10⁻⁷ |
| 3LJR | hGSTT2-2 | 5.0 × 10⁻⁴c | 3.0 × 10⁻⁷ |
| hGSTT2-2 S11A | 3.0 × 10⁻⁴ | 4.0 × 10⁻⁷ | |
| 1FW1 | hGSTZ1-1 | 1.3 × 10⁻⁴d | ≫10−6 |
| 1GWC | TaGSTU4-4 | 6.2 × 10⁻⁴ | |
| 1PN9 | AgGSTD1-6 | 8.0 × 10⁻⁴ | |
| 1R5A | AdGSTD5-5 | 2.1 × 10⁻⁴ | 1.1 × 10⁻⁷ |
| 2C3Q | hGSTT1-1 | 1.0 × 10⁻⁴e | |
| 3F63 | AdGSTD4-4 | 6.7 × 10⁻⁴ | 2.2 × 10⁻⁷ |
| Cysteine subfamily | |||
| 1EEM | hGSTO1-1 | 0.6 × 10⁻⁴f | 1.1 × 10⁻⁷ |
| 2PMT | P. mirabilis GSTB1-1 | 3.0 × 10⁻⁴ | >10−5 |
| P. mirabilis GSTB1–1 C10A | 8.0 × 10⁻⁴ | ≫2 × 10⁻⁵ | |
| 1F2E | S. paucimobilis GST | 9.0 × 10⁻⁴ | ≫10−6 |
| 2DSA | B. xenovorans GST | 2.4 × 10⁻⁴ | ≫10−6 |
| 2NTO | O. anthropi GST | 1.3 × 10⁻⁴ | 2.2 × 10⁻⁷ |
| O. anthropi GST C10A | 140 × 10−4 | 6.0 × 10⁻⁵ | |
| 3N5O | C. immitis GST | 1.5 × 10⁻⁴ | ≫10−5 |
a Values determined in the present study are reported in bold, whereas values in normal characters are obtained from literature. References reported in the supplemental Methods.
b The co-substrate used for Km determination is 1-chloro-2,4-dinitrobenzene.
c The co-substrate used for Km determination is 1-menaphtyl sulfate.
d The co-substrate used for Km determination is (±)-2–2bromo-3-(4-nitrophenyl) propanoic acid.
e The co-substrate used for Km determination is iodohexane.
f The co-substrate used for Km determination is S-(phenacyl)glutathione.
Geometry of the DNGIC·GST Complexes
DNGIC·GST complex geometry and partial charges were obtained by performing density functional theory (DFT) calculations in the Kohn-Sham ansatz (35, 36). Because these calculations are computationally demanding, our calculations were limited to a partial GST·DNGIC complex, including the iron atom, NO groups, and the side chains of the GSH cysteine and GST catalytic residue. Minimum energy geometry and charges for each DNGIC·GST complex (i.e. with Tyr, Ser, or Cys as the catalytic residue) were evaluated with the “Broken Symmetry” approach (37), using ORCA software (38, 39), and following the method previously used for a similar system (40). The comparison between the only available crystallographic structure of a DNGIC·GST complex (human GSTP1-1, PDB code 1ZGN) and the results of the DFT calculations reveals a similar geometry (Fig. 1 and Table 1), except for the position of NO groups, which are coordinated to protein residues in GSTP1-1 (which are obviously absent in the DFT calculations) (31).
Docking Calculations
Docking calculations were performed using AutoDock4, and its graphical user interface AutoDockTools (41). To mimic the real system, in which a coordination bond exists between the catalytic residue and the DNGIC, docking simulations were performed according to the recently developed method called “covalent” docking (42). In this technique a bond is formed between the ligand and the side chain of the proper receptor binding site residue (the catalytic residue in the case of GSTs). The ligand-side chain structure is then treated as flexible, allowing the rotation around some dihedrals. In our system we selected those involving the iron atom, GSH cysteine, and GST catalytic residue side chain. To determine the DNGIC/protein interaction free energy difference, the free energy of the ligand in solution and the interaction between the free catalytic side chain and the rest of GST in the unbound protein must be subtracted from the ligand-side chain/protein interaction free energy. Bond geometry and atom charges obtained in the DFT calculations were used for the ligand·side chain complex (iron atom, NO groups, Cys side chain of GSH, and catalytic residue of GST). With regard to the remaining atoms of the complex, in the single available structure of a DNGIC·GST complex (human GST P1-1, PDB code 1ZGN) the GSH of DNGIC is located in the same position of the GST·GSH complex (PBD code 6GSS), with a root mean square deviation of ∼0.8 Å. For this reason, in the docking simulations GSH (with the exclusion of the Cys side chain) was left in the same conformation of the corresponding GST·GSH complex crystallographic structure, and Gasteiger charges were used for these atoms (43). Control simulations on selected GSTs showed that releasing the GSH rotational degrees of freedom did not significantly improve the docking free energy. With the exception of the catalytic residue, no flexibility was taken into account for protein atoms, for which Kollman charges were used (44). The cubic grid used in potential calculations was formed by 70 × 70 × 70 points (0.375 Å spacing), and was centered on the hydroxyl oxygen or sulfur atom of the GST catalytic residue. The docking was performed with the Lamarckian Genetic Algorithm, and default parameters.
Docking simulations, as described above, included an energy of interaction between GST and DNGIC, which lacks contribution of the Tyr, Ser, or Cys coordination bond. Based on site-directed mutagenesis of GSTP1-1, it was assumed that the coordination due to its Tyr residue (pKa = 9.8) gives a contribution of −4.1 kcal/mol. This energy value has been properly modified as a function of the different pKa of Tyr in each Tyr-GST (Table 2) according to the following expression.
The mutant of the essential cysteine in O. anthropi GST (pKa = 7.6) is about 270 times lower affinity than the wild-type (see Table 2), which correspond to an energy contribution due to this residue of −3.3 kcal/mol. As above, this value must be corrected considering the specific pKa of each Cys-GSTs, according to Equation 2.
As suggested by a specific mutant of the essential Ser in the human GSTT2-2, no energy contribution has been considered due to this residue because of very high pKa of Ser in all Ser-GSTs.
TABLE 2.
Thermodynamic and geometric parameters from docking studies of DNDGIC and pKa of the essential residue
| PDB ID | GSTs | ΔG0 for DNDGIC-GSTs interaction | Theoretical KD DNDGIC | Root mean square deviationa | pKa of the essential residue | pI |
|---|---|---|---|---|---|---|
| kcal/mol | m | Å | ||||
| Tyrosine subfamily | ||||||
| 6GSS | hGSTP1-1 | −12.04 | 1.5 × 10⁻⁹ | 0.463 | 9.84 | 6.0 |
| 1GLP | mGSTYfYf | −14.17 | 4.1 × 10⁻¹¹ | 0.629 | 9.15 | 8.9 |
| 1TU8 | O. volvulus GST2 | −13.58 | 1.1 × 10⁻¹⁰ | 0.614 | 9.38 | 7.7 |
| 1K3L | hGSTA1-1 | −15.61 | 3.6 × 10⁻¹² | 1.457 | 8.10 | 9.4 |
| 1F3A | mGSTA1-1 | −18.82 | 1.6 × 10⁻¹⁴ | 0.353 | 7.81 | 9.6 |
| 1VF2 | cGSTA1-1 | −18.39 | 3.3 × 10⁻¹⁴ | 0.806 | 7.90 | 9.4 |
| 2WJU | hGSTA2-2 | −14.28 | 3.4 × 10⁻¹¹ | 0.474 | 8.85 | 8.7 |
| 1TDI | hGSTA3-3 | −15.99 | 1.9 × 10⁻¹² | 0.751 | 7.31 | 9.7 |
| 1GUL | hGSTA4-4 | −12.00 | 1.6 × 10⁻⁹ | 0.874 | 9.17 | 7.3 |
| 1B48 | mGSTA4-4 | −12.00 | 1.6 × 10⁻⁹ | 1.412 | 9.04 | 8.2 |
| 1GSU | cGSTM1-1 | −14.20 | 3.9 × 10⁻¹¹ | 0.320 | 8.73 | 7.6 |
| 2AB6 | hGSTM2-2 | −12.82 | 4.0 × 10⁻¹⁰ | 0.347 | 8.99 | 7.1 |
| 6GST | rGSTM3-3 | −13.70 | 9.0 × 10⁻¹¹ | 1.263 | 8.52 | 8.6 |
| 1M9A | S. japonicum GST | −11.90 | 1.9 × 10⁻⁹ | 0.618 | 10.05 | 6.3 |
| 1OE7 | S. haematobium GST | −14.08 | 4.8 × 10⁻¹¹ | 0.603 | 8.38 | 8.0 |
| 1Q4J | P. falciparum GST | −9.35 | 1.4 × 10⁻⁷ | 0.503 | 9.93 | 6.7 |
| 1U3I | S. mansoni GST | −12.08 | 1.4 × 10⁻⁹ | 0.624 | 10.18 | 7.3 |
| 2ON5 | N. americanus GST | −11.27 | 5.5 × 10⁻⁹ | 2.016 | 8.68 | 8.6 |
| 2WB9 | F. hepatica GST | −15.66 | 3.3 × 10⁻¹² | 0.488 | 8.94 | 9.4 |
| 1GSQ | Squid GSTS | −12.28 | 9.9 × 10⁻¹⁰ | 0.758 | 8.88 | 8.6 |
| Serine subfamily | ||||||
| 1AXD | Phi 1 GST Mais | −3.48 | 2.8 × 10⁻³ | 4.638 | 11.46 | 5.5 |
| L. cuprina GST | −4.17 | 8.8 × 10⁻⁴ | 0.919 | 13.16 | ||
| 1JLV | AdGSTD3-3 | −7.15 | 5.7 × 10⁻⁶ | 0.462 | 12.43 | 6.8 |
| 3LJR | hGSTT2-2 | −3.60 | 2.3 × 10⁻³ | 3.319 | 11.35 | 6.6 |
| 1FW1 | hGSTZ1-1 | −4.33 | 6.7 × 10⁻⁴ | 11.162 | 9.32 | 9.1 |
| 1GWC | TaGSTU4-4 | −7.72 | 2.2 × 10⁻⁶ | 0.788 | 11.69 | 6.0 |
| 1PN9 | AgGSTD1-6 | −6.51 | 1.7 × 10⁻⁵ | 0.453 | 13.11 | 6.5 |
| 1R5A | AdGSTD5-5 | −4.67 | 3.8 × 10⁻⁴ | 0.770 | 13.65 | 6.1 |
| 2C3Q | hGSTT1-1 | −4.04 | 1.1 × 10⁻³ | 8.110 | 11.94 | 8.6 |
| 2IMI | AgGSTE2 | −6.47 | 1.8 × 10⁻⁵ | 0.846 | 14.34 | 5.7 |
| 3F63 | AdGSTD4-4 | −6.82 | 1.0 × 10⁻⁵ | 0.352 | 12.20 | 5.2 |
| 3M0F | P. fluorescens GST | −9.68 | 8.0 × 10⁻⁸ | 0.858 | 11.68 | 6.1 |
| 3UBL | L. interrogans GST | −7.64 | 2.5 × 10⁻⁶ | 1.672 | 11.64 | 7.3 |
| 3TOU | R. solanacearum GST | −7.51 | 3.1 × 10⁻⁶ | 1.362 | 10.27 | 6.0 |
| Cysteine subfamily | ||||||
| 1EEM | hGSTO1-1 | −9.69 | 7.9 × 10⁻⁸ | 3.165 | 6.69 | 8.0 |
| 2PMT | P. mirabilis GSTB1-1 | −6.31 | 2.4 × 10⁻⁵ | 3.167 | 8.19 | 7.3 |
| 1F2E | S. paucimobilis GST | −4.68 | 3.7 × 10⁻⁴ | 10.006 | 9.42 | 5.3 |
| 2DSA | B. xenovorans GST | −6.35 | 2.2 × 10⁻⁵ | 1.290 | 9.06 | 6.1 |
| 2NTO | O. anthropi GST | −8.34 | 7.7 × 10⁻⁷ | 1.210 | 7.63 | 6.8 |
| 2X64 | X. fastidiosa GST | −5.47 | 9.8 × 10⁻⁵ | 3.886 | 9.06 | 7.5 |
| 3N5O | C. immitis GST | −11.40 | 4.4 × 10⁻⁹ | 7.019 | 5.98 | 7.2 |
| 3UAR | M. capsulatus GST | −8.94 | 2.8 × 10⁻⁷ | 8.000 | 6.23 | 4.9 |
a Root mean square deviation between crystallographic and “docked” GSH structures obtained from DNGIC docking.
pKa values of Tyr, Ser, and Cys catalytic residues within the active site of each available GST structure were evaluated using Poisson-Boltzmann electrostatic calculations performed with APBS software (45), assuming pKa values of 10.1, 13.0, and 8.7, respectively, for the isolated Tyr, Ser, and Cys residues. APBS input files were generated on the PDB2PQR server (46) using PARSE continuum electrostatics force field (47).
Isoelectric points (pI) of GSTs were evaluated based on PDB codes as folded structural values obtained by PDB2PQR, using PARSE continuum electrostatics force field and the PROPKA calculator (46). Molecular graphics pictures were created by UCSF Chimera (48).
RESULTS
Binding and Activation of GSH in the Three GST Subfamilies
GSTs are dimeric proteins that display a characteristic fold very similar in both the more ancient isoenzymes (Cys-GSTs and Ser-GSTs) as well as in the more recently evolved GSTs (Tyr-GSTs) (1). GSH binds to a specific protein region, termed the G-site, assuming an extended conformation that is very similar in all GST subfamilies (Fig. 1B). One of the most significant differences among the three subfamilies is that the essential Tyr residue involved in GSH activation is part of β-strand 1, whereas critical residues in Ser-GSTs and Cys-GSTs are located in the loop, which connects the first β-strand and the α-helix 1 (Fig. 2A). This difference, however, does not appear to have important effects on the affinity for GSH. In fact, Km values for GSH were determined experimentally in the present study for 10 different GSTs and those obtained from the literature (21 GSTs), display values ranging from 0.5 to 5 × 10⁻⁴ m without any significant difference among subfamilies (average Km values are 2.4 (± 0.6) × 10−4 m, 4.1 (± 0.8) × 10−4 m, and 3 (± 1) × 10−4 m for Tyr-GSTs, Ser-GSTs, and Cys-GSTs, respectively) (Table 1). Considering that the GSH levels in most cells range from 1 to 10 mm (49), it is clear that all these GSTs work in vivo under nearly saturating conditions (Fig. 2B). Moreover, the facilitated deprotonation of GSH, a fundamental event to enhance its chemical reactivity, occurs efficiently in representative members of all these GST subfamilies. For example, in the Alpha, Pi, and Mu GSTs (all Tyr-GSTs) the pKa of the bound GSH shifts from 9.0 to 6.0–6.8 (50, 51), but similar lowered values have been found for the P. mirabilis GSTB1-1 (Cys-GST) both in the reduced (pKa = 5.2) and oxidized form (pKa = 6.4) (33), and in the Lucilia cuprina GST and in the human GSTT2-2 (both Ser-GSTs) (pKa = 6.6 and 6.2, respectively) (21, 51). In conclusion, the Cys/Ser/Tyr replacements during evolution have not been selected to reach a better affinity or activation of GSH.
FIGURE 2.

Orientation of the catalytic residue and kinetic constants for the three GSTs subfamilies. A, representative structures for Tyr-GSTs (PDB code 1K3L) (red), Ser-GSTs (PDB code 3LJR) (green), and Cys-GSTs (PDB code 1EEM) (blue). The segment of protein backbone containing the catalytic residue is shown in a ribbon representation, whereas GSH is reported as sticks. The Tyr residue is located on the β1 strand, whereas Ser and Cys residues are on the β1α1 loop. B, experimental Km values for GSH binding to Tyr-GSTs (red circle), Ser-GSTs (green square), and Cys-GSTs (blue triangle); starting from the left: data refer to GSTs in the same sequence as reported in Table 1 (excluding the five mutants). C, experimental KD values for DNGIC/GST interaction. Tyr-GSTs (red circle), PfGST (red open circle), Ser-GSTs (green square), Cys-GSTs (blue triangle). For a few GSTs lacking detectable amounts of bound DNGIC, only a limiting lower value of KD is reported. Red arrow indicates that the true KD could be even higher (red arrow ↓) or lower (red arrow ↑). Starting from left: data refer to GSTs in the same sequence as that reported in Table 1 (excluding the five mutants).
DNDGIC Binding to GST Subfamilies
The paramagnetic DNDGIC probably has the highest affinity of any natural low-mass compound for the Tyr-GSTs (e.g. human GSTP1-1, GSTA1-1, and GSTM2-2) (12, 14). The dissociation constants found for these Tyr-GSTs range between 10−10 (GSTA1-1) and 10−9 m (GSTP1-1 and GSTM2-2), values near those found for hormone/receptor interactions and 100 lower than that displayed by the most potent GST inhibitors designed as drugs to lower the GST-mediated resistance against chemotherapeutics (52). The present study examines the DNDGIC binding to many GST isoenzymes including the Ser-GST and Cys-GST subfamilies. As shown in Table 1 and Fig. 2C, KD values obtained in the present study for 16 different GSTs, using kinetics and/or EPR approaches, or coming from our previous study (11), depict a convincing scenario of differential affinity. Although almost all examined Tyr-GSTs show extraordinary affinity for DNDGIC (KD ranging from 10−11 to 10−9 m), the Ser-GST subfamily displays 102–104 times lower affinity (KD from 10−7 to 10−6 m). The Cys-GSTs show even higher dissociation constants (KD > 10−7 m). Thus, it is evident that the most competent GSTs for the binding of DNDGIC are the Tyr-GSTs, which are also the more recently diverged isoenzymes, suggesting that an evolutionary pressure has selected this residue for optimization of this interaction. An interesting exception among the Tyr-GSTs is represented by the P. falciparum GST. This particular transferase shows structural properties similar to the Mu class GSTs but 100 times less affinity for DNDGIC than all other Tyr-GSTs (Table 1). As discussed below, this exception may confirm the link between GST evolution and NO protection.
Useful information about the role of each catalytic residue in all three GST subfamilies came from isosteric point mutations (Table 1). The replacement of Tyr-7 by Phe in hGSTP1-1 and Cys-10 by Ala in O. anthropi GST lower strongly the affinity for DNDGIC (about 1000 and 300 times, respectively), suggesting a crucial role of –OH and –SH moieties of these residues in the DNDGIC binding. Additional thermodynamic computations about these mutants are reported below. Conversely, the isosteric point mutation of Ser-11 by Ala in hGSTT2-2 indicated a scarce contribution of this residue in the DNDGIC stabilization in the G-site.
Structure of the G-site and Acid-base Properties of the Tyr/Ser/Cys Residues Are the Causes of Different Affinities
Only one crystal structure of DNDGIC bound to a protein has been solved, i.e. that involving the human GSTP1-1 (a Tyr-GST) (31). The complex binds to the G-site so that the iron center is ligated to two NO ligands, to one GSH occupying the same position as found in structures of other GST·GSH complexes, and to the deprotonated hydroxyl group of Tyr-7 that completes the coordination shell. Thus, in this interaction DNDGIC looses one GSH molecule, which is replaced by the Tyr-7 residue (31). It is likely that all other Tyr-GSTs bind the complex in an identical way. Considering the similarity of the EPR spectra (Fig. 3), it is also plausible that a similar binding modality is also adopted by the other two GST subfamilies, where a Ser or Cys residue replace Tyr. To obtain structural models of the complex in the different GSTs and to estimate the binding affinity of DNDGIC to isoenzymes for which experimental data could not be gathered, docking calculations were performed. For determining the complex bond length, angles, and partial charge distribution needed for these studies, we first performed ab initio calculations for the three different complexes involving the DNGIC moiety and the active site Ser, Cys, or Tyr residue as a fourth ligand (see “Experimental Procedures” and also supplemental Methods for a more detailed description). This theoretical approach was validated with GSTP1-1 in which the resultant model showed an almost perfect overlap with that observed in the crystal structure of DNGIC·GSTP1-1 complex (Fig. 4A and supplemental Table S1). The corresponding DNGIC structures with Ser and Cys are shown in Fig. 4B and their geometric, electrostatic and magnetic properties reported in supplemental Tables S1–S3.
FIGURE 3.
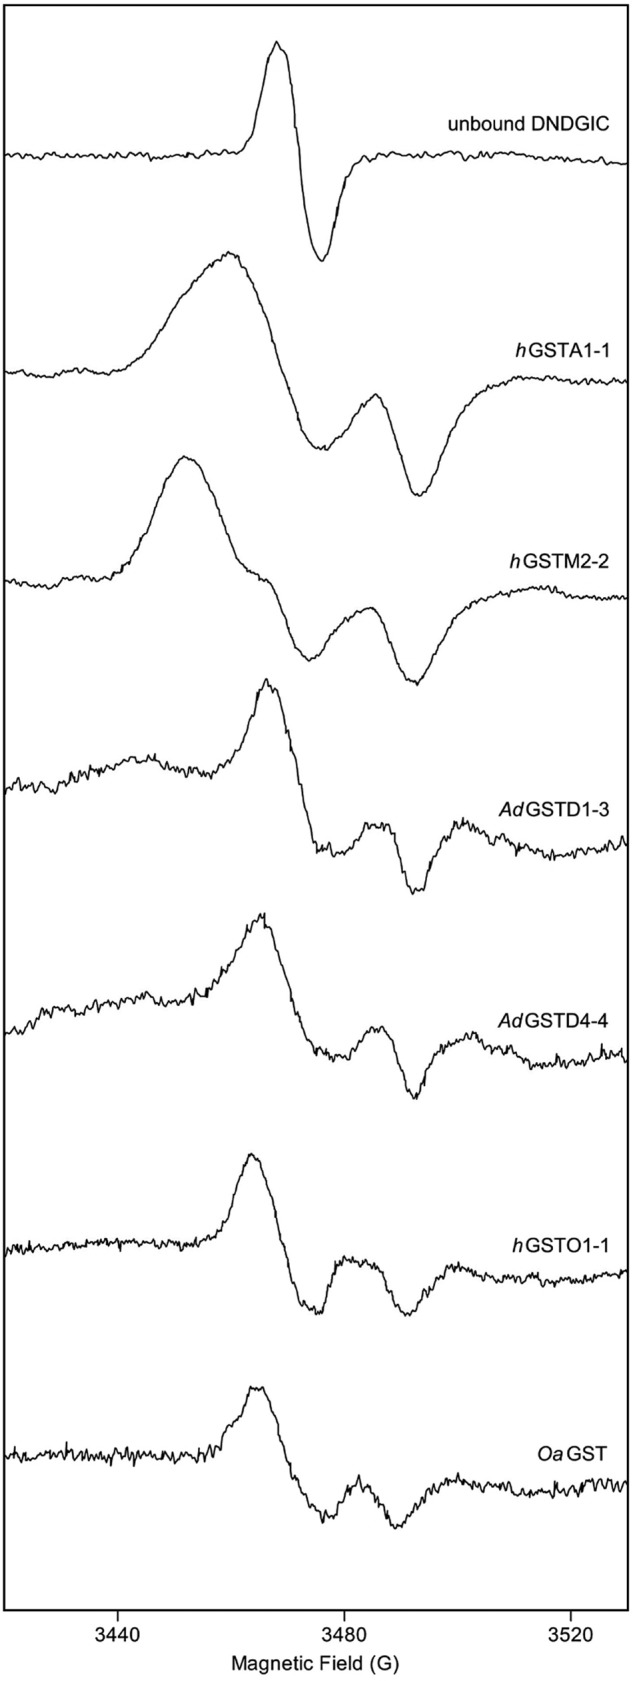
EPR experiments. EPR spectra at 22–25 °C of DNGIC bound to representative GSTs belonging to Tyr-GSTs (hGSTA1-1 and hGSTM2-2), Ser-GSTs (GSTD1-3, GSTD4-4), and Cys-GSTs (hGSTO1-1 and OaGST). Experiments were performed as described under “Experimental Procedures.”
FIGURE 4.

Experimental and theoretical studies of DNGIC binding to GSTs. A, DNGIC·GST complex structure as obtained from DFT calculations (green) superimposed on the crystallographic model (red) (PDB code 1ZGN). B, structures of DNGIC with Tyr (red), Ser (green), and Cys (blue) as fourth ligands, obtained from DFT calculations. C, free energy of the GST/DNGIC interaction obtained from docking calculations. Tyr-GSTs (red circle), Ser-GSTs (green square), and Cys-GSTs (blue triangle). D, free energies of GST/DNGIC interaction as in C were corrected for the energy of the coordination bond involving the Tyr residue (−4.1 kcal/mol for a Tyr with a pKa = 9.8 as in GSTP1-1) and the Cys residue (−3.3 kcal/mol for a Cys with pKa = 7.3 as in GSTB1-1). Coordination energy due to Tyr or Cys residues with different pKa have been calculated as described under “Experimental Procedures.” Symbols are as described in C. Black symbols are experimental KD values, whereas the corresponding theoretical KD values are reported with the same vertical alignment. Starting from left, data refer to GSTs in the same sequence of that reported in Table 1 (excluding the five mutants), red open circle and black open circle are the theoretical and experimental energy values for the atypical PfGST. Red arrow indicates that the true ΔG0 value could be even more (red arrow ↓) or less (red arrow ↑) negative (higher or lower affinity, respectively).
These theoretical models have been employed for docking calculations using AutoDock software (41) in the “covalent docking” mode (42), i.e. by forming the coordination bond, and then exploring the different conformations resulting from rotation of dihedrals of the complex and the side chain (see “Experimental Procedures”). The resulting free energies of interaction (Fig. 4C and supplemental Table S4) indicate a significantly weaker interaction for Cys-GSTs as compared with the Tyr-GSTs, while Ser-GSTs exhibit an intermediate behavior. Obviously these data, which consider only electrostatic, van der Waals, and hydrophobic interactions, do not take into account the energy contribution due to the formation of the coordination bond between iron and the critical residue. However, an estimate of the free energy involved in this metal-ligand bond can be made from experimental data of certain GSTs belonging to the three subfamilies. It is known that replacement of Tyr-7 by Phe in hGSTP1-1 lowers the affinity of the enzyme for DNDGIC from a KD of 10−9 to 10−6 m (31) (see Table 1). Thus the contribution to the stabilization of the complex in the G-site due to the coordination link of the iron with Tyr-7 can be estimated to be ∼4.1 kcal/mol. Replacement of Cys-10 by Ala in P. mirabilis GSTB1-1 (Cys-GST) also lowers the affinity, although a precise estimation value of the energy contribution cannot be calculated due to the poor affinity of both native and mutated enzymes (Table 2). More reliable data have been obtained using the mutant of a second Cys-GST enzyme, O. anthropi GST. The affinity of C10A is about 270 times less than in the native enzyme, corresponding to a loss of 3.3 kcal/mol. On the contrary, the mutation of Ser-11 (pKa = 11.3) by Ala in hGSTT2-2 (Ser-GST) does not modify significantly the affinity for the complex (Table 1), suggesting a null or very scarce involvement of this residue in the stabilization of the complex in the active site. To calculate this energy contribution for all other GSTs present in this study, a further refinement must be made by considering the different pKa of Tyr and Cys in each Tyr- and Cys-GSTs (see “Experimental Procedures”). The corrected theoretical values (Table 2) are in good agreement with the experimental values for 20 purified GSTs (Fig. 4D). Thus, we extended our theoretical analysis to other 22 GSTs, confirming that only the Tyr-GSTs have greatly optimized their binding to DNDGIC.
The relatively poor affinity found experimentally for the Ser-GSTs is straightforwardly explained on the basis of the very high pKa of Ser (pKa = 13) given that only the deprotonated hydroxyl group may bind the iron ion. A structure-based calculation of the pKa of the Ser residue in all the Ser-GSTs (by executing Poisson-Boltzmann electrostatic calculations with the Adaptive Poisson-Boltzmann Solver (APBS) software (45)) indicated that the protein environment only slightly increases the acidity of this residue (the average pKa for all tested Ser-GSTs is 12). Therefore, only traces of deprotonated Ser residues can be present at physiological pH values. Conversely, the strong affinity found in the Tyr-GSTs is, in part, due to a much more pronounced deprotonation of their crucial residue (the average pKa for Tyr = 8.9). The poor affinity found in the Cys-GSTs is caused by different factors. The Cys residue should be an ideal coordination ligand for the iron and the mean pKa value of its sulfhydryl group in all Cys-GSTs studied is only 7.8. However, the docked structure of DNGIC in these GSTs shows a GSH incorrectly bound to the G-site with a geometry significantly different from the one observed in the crystal structures of the Cys-GST·GSH complexes, as indicated by the relatively high root mean square deviation of GSH from its crystallographic position (Table 2). It appears that the formation of the fourth coordination link of the iron with the Cys residue does not allow GSH to bind properly, loosing most of its favorable interactions with the G-site. By contrast, in the final docked conformation of most Tyr-GSTs the GSH was positioned essentially in the same way as observed in the corresponding crystal structures of GST·GSH complexes.
Isoelectric Points and KD for DNDGIC Are Correlated
A surprising finding about the Tyr-GST isoenzymes is the correlation between the net charge of these proteins and their affinities for DNDGIC (r2 = 0.92; p < 0.001) (Fig. 5A). In particular, the isoenzymes with the greatest affinity among all Tyr-GSTs considered are also those showing the highest isoelectric points (Table 2). For example, the human GSTA1-1 and GSTA3-3 (pI = 9.4 and 9.7) display KD values less than 10−10 m, whereas the hGSTP1-1 (pI = 6.0) has KD value about 25-fold higher. This finding is likely related to the influence of positive charges on the deprotonation of the crucial Tyr in the G-site, as indicated by the correlation between pI and its pKa (Fig. 5B). On the contrary, poor or even no correlation between pI and KD occurs for the Ser-GSTs (r2 = 0.74; p = 0.03) and Cys-GSTs (r2 = 0.02; p = 0.78) (not shown). In addition, we noted that a strong cationic character is almost exclusively observed in the more recently evolved GSTs, i.e. in the Tyr-GSTs and, in particular, in the Alpha class GSTs reaching a pI of 9.5–9.7. Among all Ser-GSTs only two isoenzymes show pI values higher than 8.0 and only one Cys-GST displays pI > 7.5. As discussed below, the correlation between net charge and affinity for DNDGIC as well as the particular distribution of the positive residues in the Tyr-GSTs (Fig. 5C) may have interesting physiological implications.
FIGURE 5.
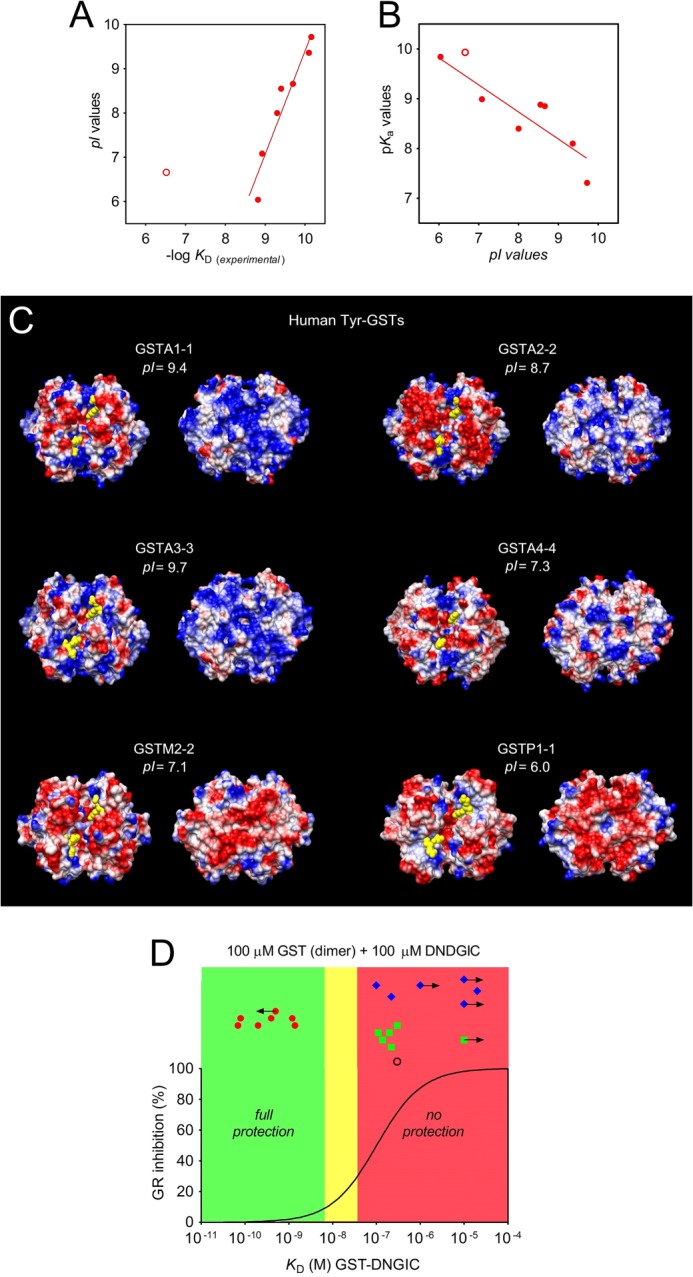
The role of protein charge. A, dependence of the affinity of GSTs for DNDGIC as a function of pI values for Tyr-GSTs (red circle), PfGST (red open circle) (r2 = 0.92; p < 0.001) excluding the anomalous PfGST. B, correlation between pI and pKa values of the catalytic residues of Tyr-GSTs. Linear regression shows positive correlation (r2 = 0.78, p = 0.009). Tyr-GSTs, red circle; PfGST, red open circle. Ser- and Cys-GSTs did not show correlations. C, coulombic potential on the dimer surface of selected Tyr-GSTs facing the two G-sites (models on left) and opposite to the G-sites (models on right). Glutathione is represented as yellow spheres. The protein surface is colored based on the electrostatic potential values, as red (negative values), blue (positive values), or white (near zero values) in the range −5 to +5 kcal/(mol·e). D, “traffic light” graph. Predictive dependence of GR inhibition (%) in the presence of a stoichiometric amount of GSTs (site at high affinity) and DNDGIC, as a function of experimental KD for DNDGIC. On the basis of the KD, the unbound DNDGIC and then the percentage of GR inhibition (Ki = 3 μm) (continuous line) (9, 10) were calculated. Good protection is assumed for inhibition less than 10%. Low or no protection is assumed for inhibition >30%. Tyr-GST (red circle), PfGST (black open circle), Ser-GST (green square), and Cys-GST (blue triangle). Arrow indicates that KD measured by EPR experiments could be even lower (←) or higher (→). See also Table 1.
DISCUSSION
The present study, which includes experimental data for 23 purified GSTs and analysis of 42 crystal structures of different isoenzymes belonging to the Tyr/Ser/Cys GST subfamilies, provides coherent evidence that the Cys/Ser/Tyr replacements during evolution have not been selected to improve binding or activation of GSH, but to optimize the binding of DNDGIC and thus increase the protection of the cell against NO toxicity. Experimental data indicate that only the Tyr-GSTs members reach the astonishing KD range of 10−9–10−11 m and, from theoretical calculation, even 10−14 m for the mouse and chicken GSTA1-1 (Table 2). Conversely, Ser-GSTs display affinities 102–104 times lower and even less affinity has been observed for the Cys-GST members. The reasons for this poor affinity are the very low acidity of the hydroxyl group of the Ser residue and the unfavorable stereochemical factors for the Cys-GSTs, as confirmed by site-directed mutagenesis data and docking studies. Furthermore, an additional property of the Cys-GSTs makes this subfamily unsuitable to bind DNDGIC efficiently. In vivo, most of the Cys-GSTs exist mainly in a mixed disulfide form involving GSH and the essential Cys. It has been found that this oxidized disulfide is strongly favored even when the GSH/GSSG ratio is higher than 100, i.e. when only traces of GSSG are present in the cell (53). In this form the G-site is not able to accommodate DNGIC. The NO sensitivity of bacteria that express only Cys-GSTs could be related to the low or null affinity of their Cys-GSTs for DNDGIC.
In a physiological scenario, what is the utility or the necessity to reach such extremely high affinities like those observed in the Tyr-GST subfamily (10−9–10−11 m)? A plausible explanation is given in the “traffic light” graph in Fig. 5D. This panel shows the predicted inhibition of glutathione reductase, an enzyme crucial for cell redox equilibrium, which is strongly inactivated by the free DNDGIC with a Ki = 3 μm (10). In the case of DNDGIC production that is stoichiometric with GST, only the Tyr-GSTs confer efficient enzyme protection. A similar protection scenario occurs in case of substoichiometric amounts of DNDGIC. Obviously, a dramatic inactivation occurs even in the presence of Tyr-GSTs when DNDGIC is in stoichiometric excess, as demonstrated previously (11). As emphasized by Karplus and co-workers, the cell needs to be efficiently protected from DNDGIC (9) and it is now evident that only in the presence of very efficient DNDGIC traps like Tyr-GSTs, the level of this iron complex stays far below its lethal concentration (Fig. 5D).
It is likely that the Tyr adaptation occurred in a common ancestor of the current metazoan species over 500 million years ago (54) and has been maintained by selection during the subsequent speciation. Gene duplication and mutation followed by selection by other factors has likely generated the multiplicity of Tyr-containing enzymes with different substrate specificities that we find today. However, because DNDGIC remains an intracellular toxin, the selection pressure to retain GSTs with Tyr residues also remains. Indirect but convincing evidence for the link between GST evolution and NO is given by the anomalous poor affinity of P. falciparum GST for DNDGIC. This Tyr-GST shows 100 times less affinity than all other Tyr-GSTs and an appealing explanation for this peculiarity is that the parasite, living in an environment containing a very high hemoglobin concentration, is strongly protected from NO, given that hemoglobin is an efficient scavenger of this compound (55). Thus, this enzyme did not need to refine its affinity for DNDGIC during evolution or, alternatively, in an early stage of evolution this parasite developed an efficient NO defense (with a Tyr-GST), which became redundant when it installed itself inside the erythrocyte. Inspection of its G-site reveals an unfavorable charge distribution near the binding site (not involving the essential Tyr, which display a Ka very similar to that of GSTP1-1). We conclude that the presence of Tyr in the active site of GSTs is a necessary but not sufficient condition to reach affinities in the low nanomolar range. Obviously, our data do not provide any definitive proof for the link between GST evolution and NO or DNDGIC protection; we cannot exclude that the observed parallelism (i.e. only the more recently evolved GSTs may efficiently inactivate dinitrosyl·iron complexes) could be merely coincidental.
A second important finding from this study is that the most avid GSTs acting as scavengers for DNDGIC are also those with the most prominent cationic character, i.e. those having the highest pI values (Fig. 5A). The positive electrostatic potential in the Tyr-GSTs may have a double function. First, the presence of discrete positively charges localized near the G-site lowers the pKa of the essential Tyr residue (from 10.2 to 7.3 with an average value of 8.9) favoring its coordination with iron. The second function is related to the involvement of the cationic GSTs in a peculiar intracellular structure. It has been demonstrated recently that, in mammalian liver cells, highly cationic Tyr-GSTs (GSTA1-1, GSTA2-2, and GSTA3-3) are present in the cytosol, but are also over-represented in a perinuclear crowd of cationic enzymes termed the “nuclear shield.” This structure, about 300 nm thick around the nuclear membrane, is promoted by electrostatic interactions, and it is possibly selected for DNA protection (56). In fact, the local concentration of GSTs in the shield is 7–8 times higher than that found in the cytosol (56). GSTA4-4 and Mu class GSTs, which are abundantly expressed in hepatocytes but with less cationic character and also less affinity for DNDGIC, are absent in this structure (56). Conversely, other important protection enzymes with strong cationic character form part of this perinuclear structure that probably uses the nesprins (large anionic proteins localized on the outer nuclear membrane) as an electrostatic counterpart (56). The particular distribution of positively charged residues observed in the dimer surface of Alpha GSTs (Fig. 5C), i.e. in the side apposite to the G-sites, appears to be convenient for the involvement of these proteins in the nuclear shield: it makes an efficient electrostatic protein-protein interaction somehow without obscuring the active site used for DNDGIC binding or catalysis.
Thus, we speculate that GSTs evolved to protect not only key cytosolic enzymes like glutathione reductase against NO insults, but possibly even DNA or intra-nuclear related enzymes. It has been reported that dinitrosyl·iron complexes induce the SOS DNA repair response in Escherichia coli and that DNDGIC is the most potent SOS inducer (57). Recently, it has been found that in E. coli the DinG (4Fe-4S) cluster can efficiently bind the dinitrosyl·iron complex with the concomitant inactivation of helicase activity in vitro and in vivo (58). Because genetic defects in the human XPD gene (ERCC2) have been associated with the increase of cancer incidence and aging phenotypes (59–62), it is plausible that chronic NO or DNDGIC exposure may inactivate the iron-sulfur cluster-containing DNA repair enzymes such as DinG/XPD and contribute to the initiation of the carcinogenic process and genomic instability (63, 64). Therefore, the accumulation of the most potent DNDGIC scavengers (GSTA1-1, GSTA2-2, and GSTA3-3) around the nucleus could be of paramount importance. Thus it may not be coincidental that the cationic GSTs are exclusively found in more recently evolved eukaryotes. In conclusion, we propose a fascinating and novel hypothesis about GST evolution and protection against NO that opens up new perspectives in cell physiology.
Acknowledgment
We thank Prof. Gerry Melino for critical reading of the manuscript.
This work was supported in part by a Italian Institution FONDAZIONE ROMA-Terzo Settore grant (to G. R.), grants from the Mahidol University (to A. J. K.), and European Research Council Project 240624 “MultiscaleChemBio” within the VII Framework Program of the European Union (to L. G.).

This article contains supplemental Tables S1–S4, “Methods,” and additional references.
- DNGIC
- dinitrosyl·glutathionyl·iron complex
- DFT
- density functional theory
- DNDGIC
- dinitrosyl·diglutathionyl·iron complex
- EPR
- electron paramagnetic resonance
- PDB
- Protein Data Bank.
REFERENCES
- 1. Armstrong R. N. (1997) Structure, catalytic mechanism, and evolution of the glutathione transferases. Chem. Res. Toxicol. 10, 2–18 [DOI] [PubMed] [Google Scholar]
- 2. Hayes J. D., Flanagan J. U., Jowsey I. R. (2005) Glutathione transferases. Annu. Rev. Pharmacol. Toxicol. 45, 51–88 [DOI] [PubMed] [Google Scholar]
- 3. Mannervik B., Board P. G., Hayes J. D., Listowsky I., Pearson W. R. (2005) Nomenclature for mammalian soluble glutathione transferases. Methods Enzymol. 401, 1–8 [DOI] [PubMed] [Google Scholar]
- 4. Nebert D. W., Vasiliou V. (2004) Analysis of the glutathione S-transferase (GST) gene family. Hum. Genomics 1, 460–464 [DOI] [PMC free article] [PubMed] [Google Scholar]
- 5. Atkinson H. J., Babbitt P. C. (2009) Glutathione Transferases are structural and functional outliers in the thioredoxin fold. Biochemistry 48, 11108–11116 [DOI] [PMC free article] [PubMed] [Google Scholar]
- 6. Sheehan D., Meade G., Foley V. M., Dowd C. A. (2001) Structure, function and evolution of glutathione transferases. Implications for classification of non-mammalian members of an ancient enzyme superfamily. Biochem. J. 360, 1–16 [DOI] [PMC free article] [PubMed] [Google Scholar]
- 7. Hill B. G., Dranka B. P., Bailey S. M., Lancaster J. R., Jr., Darley-Usmar V. M. (2010) What part of NO don't you understand? Some answers to the cardinal questions in nitric oxide biology. J. Biol. Chem. 285, 19699–19704 [DOI] [PMC free article] [PubMed] [Google Scholar]
- 8. Ueno T., Yoshimura T. (2000) The physiological activity and in vivo distribution of dinitrosyl dithiolato iron complex. Jpn. J. Pharmacol. 82, 95–101 [DOI] [PubMed] [Google Scholar]
- 9. Becker K., Savvides S. N., Keese M., Schirmer R. H., Karplus P. A. (1998) Enzyme inactivation through sulphydryl oxidation by physiologic NO-carriers. Nat. Struct. Biol. 5, 267–271 [DOI] [PubMed] [Google Scholar]
- 10. Keese M. A., Böse M., Mülsch A., Schirmer R. H., Becker K. (1997) Dinitrosyl-dithiol-iron complexes, nitric oxide (NO) carriers in vivo, as potent inhibitors of human glutathione reductase and glutathione S-transferase. Biochem. Pharmacol. 54, 1307–1313 [DOI] [PubMed] [Google Scholar]
- 11. Pedersen J. Z., De Maria F., Turella P., Federici G., Mattei M., Fabrini R., Dawood K. F., Massimi M., Caccuri A. M., Ricci G. (2007) Glutathione transferases sequester toxic dinitrosyl-iron complexes in cells. A protection mechanism against excess nitric oxide. J. Biol. Chem. 282, 6364–6371 [DOI] [PubMed] [Google Scholar]
- 12. De Maria F., Pedersen J. Z., Caccuri A. M., Antonini G., Turella P., Stella L., Lo Bello M., Federici G., Ricci G. (2003) The specific interaction of dinitrosyl-diglutathionyl-iron complex, a natural NO carrier, with the glutathione transferase superfamily. Suggestion for an evolutionary pressure in the direction of the storage of nitric oxide. J. Biol. Chem. 278, 42283–42293 [DOI] [PubMed] [Google Scholar]
- 13. Turella P., Pedersen J. Z., Caccuri A. M., De Maria F., Mastroberardino P., Lo Bello M., Federici G., Ricci G. (2003) Glutathione transferase superfamily behaves like storage proteins for dinitrosyl-diglutathionyl-iron complex in heterogeneous systems. J. Biol. Chem. 278, 42294–42299 [DOI] [PubMed] [Google Scholar]
- 14. Lo Bello M., Nuccetelli M., Caccuri A. M., Stella L., Parker M. W., Rossjohn J., McKinstry W. J., Mozzi A. F., Federici G., Polizio F., Pedersen J. Z., Ricci G. (2001) Human glutathione transferase P1-1 and nitric oxide carriers. A new role for an old enzyme. J. Biol. Chem. 276, 42138–42145 [DOI] [PubMed] [Google Scholar]
- 15. Tetlow N., Board P. G. (2004) Functional polymorphism of human glutathione transferase A2. Pharmacogenetics 14, 111–116 [DOI] [PubMed] [Google Scholar]
- 16. Tetlow N., Coggan M., Casarotto M. G., Board P. G. (2004) Functional polymorphism of human glutathione transferase A3. Effects on xenobiotic metabolism and steroid biosynthesis. Pharmacogenetics 14, 657–663 [DOI] [PubMed] [Google Scholar]
- 17. Höppner J., Perbandt M., Betzel Ch., Walter R. D., Liebau E. (2004) Crystallization of the major cytosolic glutathione S-transferase from Onchocerca volvulus. Acta Crystallogr. D 60, 1496–1497 [DOI] [PubMed] [Google Scholar]
- 18. Johnson K. A., Angelucci F., Bellelli A., Hervé M., Fontaine J., Tsernoglou D., Capron A., Trottein F., Brunori M. (2003) Crystal structure of the 28-kDa glutathione S-transferase from Schistosoma haematobium. Biochemistry 42, 10084–10094 [DOI] [PubMed] [Google Scholar]
- 19. Harwaldt P., Rahlfs S., Becker K. (2002) Glutathione S-transferase of the malarial parasite Plasmodium falciparum. Characterization of a potential drug target. Biol. Chem. 383, 821–830 [DOI] [PubMed] [Google Scholar]
- 20. Tomarev S. I., Zinovieva R. D., Guo K., Piatigorsky J. (1993) Squid glutathione S-transferase. J. Biol. Chem. 268, 4534–4542 [PubMed] [Google Scholar]
- 21. Caccuri A. M., Antonini G., Board P. G., Flanagan J., Parker M. W., Paolesse R., Turella P., Federici G., Lo Bello M., Ricci G. (2001) Human glutathione transferase T2-2 discloses some evolutionary strategies for optimization of substrate binding to the active site of glutathione transferases. J. Biol. Chem. 276, 5427–5431 [DOI] [PubMed] [Google Scholar]
- 22. Mozer T. J., Tiemeier D. C., Jaworski E. G. (1983) Purification and characterization of corn glutathione S-transferase. Biochemistry 22, 1068–1072 [DOI] [PubMed] [Google Scholar]
- 23. Tzeng H. F., Blackburn A. C., Board P. G., Anders M. W. (2000) Polymorphism- and species-dependent inactivation of glutathione transferase ζ by dichloroacetate. Chem. Res. Toxicol. 13, 231–236 [DOI] [PubMed] [Google Scholar]
- 24. Oakley A. J., Harnnoi T., Udomsinprasert R., Jirajaroenrat K., Ketterman A. J., Wilce M. C. (2001) The crystal structures of glutathione S-transferases isozymes 1–3 and 1–4 from Anopheles dirus species B. Protein Sci. 10, 2176–2185 [DOI] [PMC free article] [PubMed] [Google Scholar]
- 25. Wongsantichon J., Robinson R. C., Ketterman A. J. (2010) Structural contributions of delta class glutathione transferase active-site residues to catalysis. Biochem. J. 428, 25–32 [DOI] [PubMed] [Google Scholar]
- 26. Udomsinprasert R., Pongjaroenkit S., Wongsantichon J., Oakley A. J., Prapanthadara L. A., Wilce M. C., Ketterman A. J. (2005) Identification, characterization and structure of a new Delta class glutathione transferase isoenzyme. Biochem. J. 388, 763–771 [DOI] [PMC free article] [PubMed] [Google Scholar]
- 27. Board P. G., Coggan M., Chelvanayagam G., Easteal S., Jermiin L. S., Schulte G. K., Danley D. E., Hoth L. R., Griffor M. C., Kamath A. V., Rosner M H., Chrunyk B. A., Perregaux D. E., Gabel C. A., Geoghegan K. F., Pandit J. (2000) Identification, characterization, and crystal structure of the Omega class glutathione transferases. J. Biol. Chem. 275, 24798–24806 [DOI] [PubMed] [Google Scholar]
- 28. Fortin P. D., Horsman G. P., Yang H. M., Eltis L. D. (2006) A glutathione S-transferase catalyzes the dehalogenation of inhibitory metabolites of polychlorinated biphenyls. J. Bacteriol. 188, 4424–4430 [DOI] [PMC free article] [PubMed] [Google Scholar]
- 29. Favaloro B., Tamburro A., Angelucci S., Luca A. D., Melino S., di Ilio C., Rotilio D. (1998) Molecular cloning, expression and site-directed mutagenesis of glutathione S-transferase from Ochrobactrum anthropi. Biochem. J. 335, 573–579 [DOI] [PMC free article] [PubMed] [Google Scholar]
- 30. Edwards T. E., Bryan C. M., Leibly D. J., Dieterich S. H., Abendroth J., Sankaran B., Sivam D., Staker B. L., Van Voorhis W. C., Myler P. J., Stewart L. J. (2011) Structures of a putative ζ-class glutathione S-transferase from the pathogenic fungus Coccidioides immitis. Acta Crystallogr. Sect. F Struct. Biol. Cryst. Commun. 67, 1038–1043 [DOI] [PMC free article] [PubMed] [Google Scholar]
- 31. Cesareo E., Parker L. J., Pedersen J. Z., Nuccetelli M., Mazzetti A. P., Pastore A., Federici G., Caccuri A. M., Ricci G., Adams J. J., Parker M. W., Lo Bello M. (2005) Nitrosylation of human glutathione transferase P1-1 with dinitrosyl diglutathionyl iron complex in vitro and in vivo. J. Biol. Chem. 280, 42172–42180 [DOI] [PubMed] [Google Scholar]
- 32. Tan K. L., Chelvanayagam G., Parker M. W., Board P. G. (1996) Mutagenesis of the active site of the human Theta-class glutathione transferase GSTT2-2. Catalysis with different substrates involves different residues. Biochem. J. 319, 315–321 [DOI] [PMC free article] [PubMed] [Google Scholar]
- 33. Caccuri A. M., Antonini G., Allocati N., Di Ilio C., De Maria F., Innocenti F., Parker M. W., Masulli M., Lo Bello M., Turella P., Federici G., Ricci G. (2002) GSTB1-1 from Proteus mirabilis. A snapshot of an enzyme in the evolutionary pathway from a redox enzyme to a conjugating enzyme. J. Biol. Chem. 277, 18777–18784 [DOI] [PubMed] [Google Scholar]
- 34. Allocati N., Federici L., Masulli M., Favaloro B., Di Ilio C. (2008) Cysteine 10 is critical for the activity of Ochrobactrum anthropi glutathione transferase and its mutation to alanine causes the preferential binding of glutathione to the H-site. Proteins 71, 16–23 [DOI] [PubMed] [Google Scholar]
- 35. Hohenberg P., Kohn W. (1964) Inhomogeneous electron gas. Phys. Rev. B 136, 864–871 [Google Scholar]
- 36. Kohn W., Sham L. J. (1965) Self-consistent equations including exchange and correlations effects. Phys. Rev. 140, 1133–1138 [Google Scholar]
- 37. Noodleman L., Case D. A., Aizman A. (1988) Broken symmetry analysis of spin coupling in iron-sulfur clusters. J. Am. Chem. Soc. 110, 1001–1005 [Google Scholar]
- 38. Neese F. (2012) The ORCA program system. WIREs Comput. Mol. Sci. 2, 73–78 [Google Scholar]
- 39. Neese F. (2000) Approximate Second Order Convergence for Spin Unrestricted Wavefunctions. Chem. Phys. Lett. 325, 93–98 [Google Scholar]
- 40. Ye S., Neese F. (2010) The unusual electronic structure of dinitrosyl iron complexes. J. Am. Chem. Soc. 132, 3646–3647 [DOI] [PubMed] [Google Scholar]
- 41. Morris G. M., Goodsell D. S., Halliday R. S., Huey R., Hart W. E., Belew R. K., Olson A. J. (1998) Automated docking using a Lamarckian Genetic Algorithm and empirical binding free energy function. J. Comput. Chem. 19, 1639–1662 [Google Scholar]
- 42. Morris G. M., Huey R., Lindstrom W., Sanner M. F., Belew R. K., Goodsell D. S., Olson A. J. (2009) AutoDock4 and AutoDockTools4. Automated docking with selective receptor flexibility. J. Comput. Chem. 30, 2785–2791 [DOI] [PMC free article] [PubMed] [Google Scholar]
- 43. Gasteiger J., Marsili M. (1980) Iterative partial equalization of orbital electronegativity. A rapid access to atomic charges. Tetrahedron 36, 3219–3228 [Google Scholar]
- 44. Singh U. C., Kollman P. A. (1984) An approach to computing electrostatic charge for molecules. J. Comp. Chem. 5, 129–145 [Google Scholar]
- 45. Baker N. A., Sept D., Joseph S., Holst M. J., McCammon J. A. (2001) Electrostatics of nanosystems. Application to microtubules and the ribosome. Proc. Natl. Acad. Sci. U.S.A. 98, 10037–10041 [DOI] [PMC free article] [PubMed] [Google Scholar]
- 46. Dolinsky T. J., Nielsen J. E., McCammon J. A., Baker N. A. (2004) PDB2PQR. An automated pipeline for the setup, execution, and analysis of Poisson-Boltzmann electrostatics calculations. Nucleic Acids Res. 32, W665–667 [DOI] [PMC free article] [PubMed] [Google Scholar]
- 47. Sitkoff D., Sharp K. A., Honig B. (1994) Accurate calculation of hydration free energies using macroscopic solvent models. J. Phys. Chem. 98, 1978–1988 [Google Scholar]
- 48. Pettersen E. F., Goddard T. D., Huang C. C., Couch G. S., Greenblatt D. M., Meng E. C., Ferrin T. E. (2004) UCSF Chimera. A visualization system for exploratory research and analysis. J. Comput. Chem. 13, 1605–1612 [DOI] [PubMed] [Google Scholar]
- 49. Fahey R. C., Sundquist A. R. (1991) Evolution of glutathione metabolism. Adv. Enzymol. Relat. Areas Mol. Biol. 64, 1–53 [DOI] [PubMed] [Google Scholar]
- 50. Caccuri A. M., Lo Bello M., Nuccetelli M., Nicotra M., Rossi P., Antonini G., Federici G., Ricci G. (1998) Proton release upon glutathione binding to glutathione transferase P1-1. Kinetic analysis of a multistep glutathione binding process. Biochemistry 37, 3028–3034 [DOI] [PubMed] [Google Scholar]
- 51. Caccuri A. M., Antonini G., Board P. G., Parker M. W., Nicotra M., Lo Bello M., Federici G., Ricci G. (1999) Proton release on binding of glutathione to Alpha, Mu and Delta class glutathione transferases. Biochem. J. 344, 419–425 [PMC free article] [PubMed] [Google Scholar]
- 52. Flatgaard J. E., Bauer K. E., Kauvar L. M. (1993) Isozyme specificity of novel glutathione-S-transferase inhibitors. Cancer Chemother. Pharmacol. 33, 63–70 [DOI] [PubMed] [Google Scholar]
- 53. Caccuri A. M., Antonini G., Allocati N., Di Ilio C., Innocenti F., De Maria F., Parker M. W., Masulli M., Polizio F., Federici G., Ricci G. (2002) Properties and utility of the peculiar mixed disulfide in the bacterial glutathione transferase B1-1. Biochemistry 41, 4686–4693 [DOI] [PubMed] [Google Scholar]
- 54. Pearson W. R. (2005) Phylogenies of glutathione transferase families. Methods Enzymol. 401, 186–204 [DOI] [PubMed] [Google Scholar]
- 55. Azarov I., Huang K. T., Basu S., Gladwin M. T., Hogg N., Kim-Shapiro D. B. (2005) Nitric oxide scavenging by red blood cells as a function of hematocrit and oxygenation. J. Biol. Chem. 280, 39024–39032 [DOI] [PubMed] [Google Scholar]
- 56. Fabrini R., Bocedi A., Pallottini V., Canuti L., De Canio M., Urbani A., Marzano V., Cornetta T., Stano P., Giovanetti A., Stella L., Canini A., Federici G., Ricci G. (2010) Nuclear shield. A multi-enzyme task-force for nucleus protection. PLoS One 5, e14125. [DOI] [PMC free article] [PubMed] [Google Scholar]
- 57. Lobysheva I. I., Stupakova M. V., Mikoyan V. D., Vasilieva S. V., Vanin A. F. (1999) Induction of the SOS DNA repair response in Escherichia coli by nitric oxide donating agents. Dinitrosyl iron complexes with thiol-containing ligands and S-nitrosothiols. FEBS Lett. 454, 177–180 [DOI] [PubMed] [Google Scholar]
- 58. Ren B., Duan X., Ding H. (2009) Redox control of the DNA damage-inducible protein DinG helicase activity via its iron-sulfur cluster. J. Biol. Chem. 284, 4829–4835 [DOI] [PMC free article] [PubMed] [Google Scholar]
- 59. Lehmann A. R. (2001) The Xeroderma pigmentosum group D (XPD) gene. One gene, two functions, three diseases. Genes Dev. 15, 15–23 [DOI] [PubMed] [Google Scholar]
- 60. Liu H., Rudolf J., Johnson K. A., McMahon S. A., Oke M., Carter L., McRobbie A. M., Brown S.E., Naismith J. H., White M. F. (2008) Structure of the DNA repair helicase XPD. Cell 133, 801–812 [DOI] [PMC free article] [PubMed] [Google Scholar]
- 61. Fan L., Fuss J. O., Cheng Q. J., Arvai A. S., Hammel M., Roberts V. A., Cooper P. K., Tainer J. A. (2008) XPD helicase structures and activities. Insights into the cancer and aging phenotypes from XPD mutations. Cell 133, 789–800 [DOI] [PMC free article] [PubMed] [Google Scholar]
- 62. Rudolf J., Makrantoni V., Ingledew W. J., Stark M. J., White M. F. (2006) The DNA repair helicases XPD and FancJ have essential iron-sulfur domains. Mol. Cell 23, 801–808 [DOI] [PubMed] [Google Scholar]
- 63. Gal A., Wogan G. N. (1996) Mutagenesis associated with nitric oxide production intransgenic SJL mice. Proc. Natl. Acad. Sci. U.S.A. 93, 15102–15107 [DOI] [PMC free article] [PubMed] [Google Scholar]
- 64. Li C. Q., Trudel L. J., Wogan G. N. (2002) Nitric oxide-induced genotoxicity, mitochondrial damage, and apoptosis in human lymphoblastoid cells expressing wild-type and mutant p53. Proc. Natl. Acad. Sci. U.S.A. 99, 10364–10369 [DOI] [PMC free article] [PubMed] [Google Scholar]