

There was substantial variability among National Lung Screening Trial radiologists in false-positive rates and nodule counts; readers with higher false-positive rates had modestly increased sensitivity.
Abstract
Purpose:
To characterize the variability in radiologists’ interpretations of computed tomography (CT) studies in the National Lung Screening Trial (NLST) (including assessment of false-positive rates [FPRs] and sensitivity), to examine factors that contribute to variability, and to evaluate trade-offs between FPRs and sensitivity among different groups of radiologists.
Materials and Methods:
The HIPAA-compliant NLST was approved by the institutional review board at each screening center; all participants provided informed consent. NLST radiologists reported overall screening results, nodule-specific findings, and recommendations for diagnostic follow-up. A noncalcified nodule of 4 mm or larger constituted a positive screening result. The FPR was defined as the rate of positive screening examinations in participants without a cancer diagnosis within 1 year. Descriptive analyses and mixed-effects models were utilized. The average odds ratio (OR) for a false-positive result across all pairs of radiologists was used as a measure of variability.
Results:
One hundred twelve radiologists at 32 screening centers each interpreted 100 or more NLST CT studies, interpreting 72 160 of 75 126 total NLST CT studies in aggregate. The mean FPR for radiologists was 28.7% ± 13.7 (standard deviation), with a range of 3.8%–69.0%. The model yielded an average OR of 2.49 across all pairs of radiologists and an OR of 1.83 for pairs within the same screening center. Mean FPRs were similar for academic versus nonacademic centers (27.9% and 26.7%, respectively) and for centers inside (25.0%) versus outside (28.7%) the U.S. “histoplasmosis belt.” Aggregate sensitivity was 96.5% for radiologists with FPRs higher than the median (27.1%), compared with 91.9% for those with FPRs lower than the median (P = .02).
Conclusion:
There was substantial variability in radiologists’ FPRs. Higher FPRs were associated with modestly higher sensitivity.
© RSNA, 2013
Introduction
The National Lung Screening Trial (NLST) has reported a 20% mortality benefit to three annual screening examinations with low-radiation-dose computed tomography (CT) as compared with single-view posteroanterior chest radiography in a randomized trial in more than 50 000 subjects (1). Although the mortality benefit is impressive, the high rates of positive screening examinations with CT (27% for each of the first two rounds of screening), the majority of which (>90%) represented false-positive findings, raise concerns. False-positive studies result in considerable follow-up diagnostic testing, cost, and anxiety, and thus, understanding the factors that lead to false-positive findings is critical in attempting to make CT lung screening more efficient and cost effective (2).
False-positive low-dose CT screening examinations largely reflect the prevalence of indeterminate small noncalcified pulmonary nodules, the majority of which are ultimately found to be benign at repeated follow-up. As with any imaging technology, low-dose CT screening is characterized by reader variability (3–6). Therefore, overall false-positive rates (FPRs) in the NLST do not reflect a fixed performance level but rather an average level across many participating NLST radiologists, whose individual rates vary. The purpose of this study was to characterize the variability in radiologists’ interpretations in the NLST (including assessment of FPRs and sensitivity), to examine factors that contribute to variability, and to evaluate trade-offs between FPRs and sensitivity among different groups of radiologists.
Materials and Methods
Participants and Imaging
The NLST randomized participants aged 55–74 years to undergo low-dose CT or chest radiography. Eligibility criteria included a history of smoking of 30 or more pack-years and current smoking status or having quit smoking within the past 15 years (7). Participants were enrolled at 33 U.S. screening centers from 2002 to 2004 and underwent either low-dose CT or chest radiography screening studies at baseline (examination E0) and annually for 2 more years (examinations E1 and E2). The NLST, which was compliant with the terms of the Health Insurance Portability and Accountability Act, was approved by an institutional review board at each of the 33 participating screening centers. All participants signed informed consent forms. All of the CT scanners used had multiple detector rows (at least four). Allowable CT acquisition parameter ranges included a tube voltage of 120–140 kVp, a section thickness of 1.0–2.5 mm, and an effective tube current–time product of 20–60 mAs (depending on body habitus) (7).
All NLST radiologists were required to be certified by the American Board of Radiology or equivalent and to have documented training and experience, including the interpretation of 300 chest CT studies in the previous 3 years and participation in continuing medical education in accordance with the American College of Radiology standard. They were also required to review a dedicated NLST training set, which described acceptable CT acquisition parameters and image quality requirements and provided examples of various focal lung opacities with corresponding interpretations to promote a uniform knowledge base (7).
Each NLST CT study was interpreted by a single radiologist. Screening results were reported on standardized forms. Radiologists first determined an “isolation interpretation” result of positive or negative, without reference to prior NLST images; after the radiologist viewed prior images, a “final interpretation” was reported, with results conveyed to the participant (7). The NLST protocol defined a noncalcified nodule (NCN) of 4 mm or larger as a positive screening finding. For each NCN that was 4 mm or larger, radiologists reported the location, greatest transverse and perpendicular diameters, margin characteristics, and attenuation characteristics. On the basis of prior images, they also reported whether the abnormality was preexisting and, if so, whether it had grown and/or changed in attenuation since the past screening examination(s). NCNs that were unchanged at E2, demonstrating stability for 2 years, could be considered benign; thus, a positive isolation interpretation of the E2 study could be converted to a negative final interpretation if there were no other suspicious findings. Other abnormalities, including adenopathy and effusion, could also trigger positive screening interpretations. Radiologists additionally recorded their recommendations for diagnostic follow-up, which included low-dose CT at various time intervals, diagnostic CT, positron emission tomography (PET), and biopsy (7).
Positive screening studies were tracked with respect to resultant diagnostic procedures and cancer diagnoses. In addition, participants were followed by means of yearly status update forms to ascertain incident cancers in the absence of a positive screening study. All reported cancers were verified with medical records.
Quantitative Methods
The FPR, or 1 minus specificity, was defined as the rate of positive screening studies in participants without lung cancer; sensitivity was defined analogously among participants with lung cancer. Participants were classified as having lung cancer at a screening examination if they were diagnosed within 1 year.
We performed descriptive analyses of various reader rates and counts, including FPR and the average count of NCNs (using 4- and 10-mm thresholds), in non–cancer-containing studies. The greatest transverse diameter was used to classify nodule size. For the FPR, we utilized the isolation interpretation instead of the final interpretation for E2 examinations; there was considerable variability in the rates of converting stable positive isolation interpretations at E2 to negative final interpretations, so we analyzed variability in this aspect directly to separate it from variability in detecting an NCN.
A commonly used measure of variability of FPRs across readers is the average odds ratio (OR) (8). For any random pair of radiologists, the OR is {[FPR1/(1 − FPR1)]/[FPR2/(1 − FPR2)]}, where FPR1 and FPR2 are the FPRs for the first and the second radiologist in the pair, respectively, and the first radiologist by definition has the higher (or an equal) FPR. Averaging over all possible radiologist pairs produces the variability measure, with a value of 1.0 indicating no variability. For outcomes involving NCN counts, the coefficient of variation (CV)—the ratio of the standard deviation to the mean—was used as the measure of variability.
To account for sampling variability and screening participant–level factors, we also used mixed-effects models. These models assume that there are fixed participant effects (eg, age) that affect FPRs, as well as random effects, which here included radiologist and screening center (9). Although neither the radiologists nor the centers were truly sampled at random, we modeled both as random effects because the centers belonged to preexisting networks (that predated NLST) and the radiologists were on staff at the centers. Participant effects included sex, age (65 years and older vs younger than 65 years), body mass index (> 30 vs ≤ 30 kg/m2), smoking status (current smokers vs former smokers), and number of pack-years of smoking (< 50 vs ≥ 50), as well as the round of screening (E0, E1, or E2). For rate variables, the logit transformation—that is, log [p/(1 − p)], where p is the rate—was used. The logit of the rate and the average count were assumed to be normally distributed across centers and across radiologists within a center. The standard deviation of radiologists’ underlying rates and the average OR were computed from the fitted model, with the assumption that the overall NLST distribution of covariates (eg, age, sex) applied for each radiologist.
To estimate the correlation of underlying sensitivity and FPR across radiologists, we assumed that logits of rates were bivariate normally distributed and that given underlying rates, observed rates were independently binomially distributed. This model also produced a regression curve of average underlying sensitivity at each FPR.
Radiologists’ follow-up recommendations were classified as “high level” if they included repeat CT within 3 months, diagnostic CT, PET, or biopsy. The high-level follow-up FPR was defined as the percentage of all non–cancer-containing screening studies with high-level recommended follow-up; the percentage of false-positive studies with high-level follow-up recommendations was defined similarly, but with the denominator of false-positive screening studies.
To gauge the clinical impact of radiologists’ FPRs, we also examined the actual follow-up procedures that the participants underwent after false-positive screening studies. These procedures were categorized into chest CT examinations, pulmonary function tests, and invasive procedures (biopsy, surgery, and/or bronchoscopy).
Results
Of 403 radiologists who interpreted NLST CT studies, 112 interpreted at least 100. This analysis was therefore restricted to studies (n = 72 160) interpreted by these 112 radiologists. Table 1 describes the NLST radiologists and the participants (n = 26 209).
Table 1.
Characteristics of NLST Radiologists and Participants
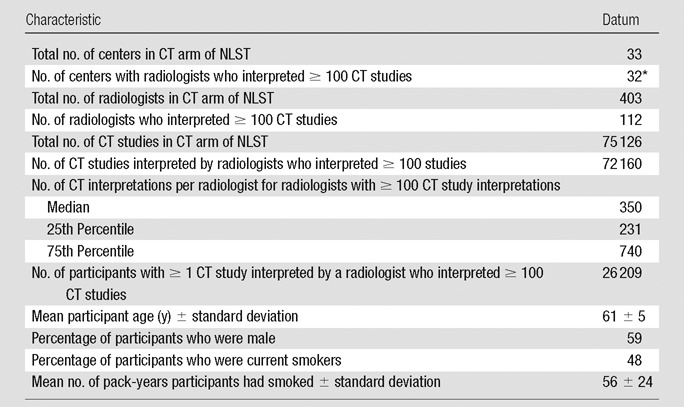
Eight centers had one such radiologist, nine had two, 12 had from three to six, and three had 12.
Aggregate positivity rates were 27.5%, 28.1%, and 28.5% at E0, E1, and E2, respectively; NCNs of 4 mm or larger were reported in 97.9% of positive screening studies. Within 1 year of a screening examination, 614 cancers were diagnosed. Aggregate FPRs were 26.8%, 27.6%, and 28.0% for E0, E1, and E2, respectively; aggregate sensitivities were 93.6%, 94.5%, and 93.4%. Note that these results, and all further results unless otherwise specified, utilized the isolation interpretation and not the final interpretation at E2 to define a positive screening examination.
Variability in Radiologist Rates and NCN Counts
Table 2 summarizes the observed variability in radiologist rates. For FPR and NCN counts, means and standard deviations were similar across study years, while for high-level follow-up FPR and percentage of false-positive studies with high-level follow-up recommendations, means were substantially different between E0 and E1 to E2; therefore, combined E0–E2 results are displayed for the former, and separate results for E0 and E1 to E2 are shown for the latter. The mean FPR across all radiologists was 28.7% ± 13.7, with a range of 3.8%–69.0%. Average ORs across all radiologist pairs and across all pairs within the same center were 2.89 and 2.12, respectively. For high-level follow-up FPR, the mean was 12.3% ± 8.9 at E0 and 5.9% ± 4.7 at E1 to E2; average ORs were generally similar to those for FPR. For percentage of false-positive studies with high-level follow-up recommendations, the mean was 47.4% ± 27.9 at E0 and 20.6% ± 12.2 at E1 to E2. Figure 1a displays FPR and high-level follow-up FPR for the 112 radiologists grouped by center.
Table 2.
Observed and Modeled Radiologist Variability in FPR Rates and NCN Counts
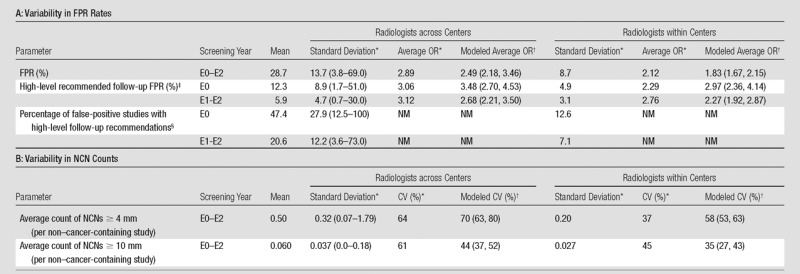
Note.—NM = not meaningful.
On the basis of descriptive analysis. For radiologists within centers, the standard deviations and CVs are average standard deviations and CVs within centers; average ORs represent the average over all radiologist pairs within the same center. Data in parentheses are ranges.
Estimated by using a mixed-effects model. Data in parentheses are 95% confidence intervals.
Descriptive statistics were computed for radiologists who interpreted at least 100 studies in the given year(s) (n = 69 for E0, n = 99 for E1 and E2). Model results incorporate data from all radiologists.
Descriptive statistics were computed for radiologists with at least 50 positive studies in the given year(s) (n = 43 for E0 and n = 74 for E1 and E2). Model results incorporate data from all radiologists.
Figure 1a:

Bar graphs show radiologist FPRs and average NCN counts. (a) FPRs for 112 radiologists who interpreted at least 100 total CT studies. FPR is broken down into rates with (red) and without (blue) high-level recommended follow-up; total height of bar = FPR. Radiologists are grouped by center, with a blank column between centers. (b) Average counts of NCNs per non–cancer-containing study for the 112 radiologists grouped by NCN size. Red = NCNs 10 mm or larger, blue = 7–9-mm NCNs, and green = 4–6-mm NCNs. The order of radiologists is the same in both a and b.
The mean across radiologists of the average count of NCNs that were 4 mm or larger was 0.50 ± 0.32, yielding a CV of 64%; the range was 0.07–1.79 (Table 2). For NCNs that were 10 mm or larger, the mean was much lower (0.060 ± 0.037), with a similar CV (61%). Among positive screening studies, the mean average count of NCNs that were 4 mm or larger was 1.64 ± 0.32. Figure 1b displays average NCN counts (by size) for radiologists grouped by center.
Figure 1b:

Bar graphs show radiologist FPRs and average NCN counts. (a) FPRs for 112 radiologists who interpreted at least 100 total CT studies. FPR is broken down into rates with (red) and without (blue) high-level recommended follow-up; total height of bar = FPR. Radiologists are grouped by center, with a blank column between centers. (b) Average counts of NCNs per non–cancer-containing study for the 112 radiologists grouped by NCN size. Red = NCNs 10 mm or larger, blue = 7–9-mm NCNs, and green = 4–6-mm NCNs. The order of radiologists is the same in both a and b.
The mixed-effects models demonstrated significant variability (P < .001) across radiologists within centers for each outcome examined—FPR, high-level follow-up FPR, and average counts of NCNs that were 4 mm or larger and 10 mm or larger. Average ORs for FPR were 2.49 and 1.83 for radiologists across and within centers, respectively (Table 2). The average OR for high-level follow-up FPR was higher at E0 (3.48 across and 2.97 within centers) than at E1 to E2 (2.68 and 2.27, respectively). The CVs for average count of NCNs that were 10 mm or larger were lower, at 44% and 35%, for radiologists across and within centers, respectively, than the CVs for average count of NCNs that were 4 mm or larger (70% and 58%) (Table 2).
All participant-related covariates were significantly associated with FPR, with ORs of 1.06 for female versus male participants (P = .002), 1.32 for participants 65 years of age or older versus those younger than 65 years (P < .001), 0.89 for patients with body mass indexes greater than 30 kg/m2 versus those with indexes of 30 kg/m2 or less (P < .001), 1.15 for current versus former smokers (P < .001), and 1.12 for participants with at least 50 pack-years of smoking versus those with fewer than 50 pack-years of smoking (P < .001). Controlling for these covariates, however, had negligible effect on the variability estimates.
Table 3 shows FPRs and average NCN counts according to screening center characteristics. Academic centers had similar FPRs (mean, 27.9%) to nonacademic centers (mean, 26.7%), and radiologists within academic centers had similar mean FPRs (28.8% ± 14.7), to radiologists within nonacademic centers (28.4% ± 12.2). A similar finding was observed for centers inside and those outside of the U.S. “histoplasmosis belt,” with the mean FPR across centers being slightly higher among centers outside of the belt (28.7%) than inside it (25.0%). Results for average counts of 4-mm or larger NCNs mirrored those for FPRs.
Table 3.
FPR and NCN Count according to Screening Center Characteristics
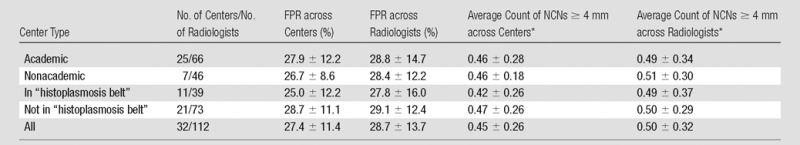
Note.—Unless otherwise specified, data are means ± standard deviations. Academic centers were defined as those associated with a medical school or medical residency program. The U.S. “histoplasmosis belt” was defined on the basis of the National Eye Institute Web site (10) as including the following states: Alabama, Arkansas, Iowa, Illinois, Indiana, Kansas, Kentucky, Maryland, Mississippi, Nebraska, Oklahoma, Tennessee, Texas, Virginia, and West Virginia, as well as Washington, DC.
The means across all 32 centers for FPR and average count of 4-mm or larger NCNs were 27.4% ± 11.4 and 0.45 ± 0.26, respectively. Because eight (25%) of the centers had only a single radiologist and nine centers (28%) had only two, some of the observed variation in the centers’ rates actually reflects radiologist variability. The fixed-effects model, which accounted for radiologist variability, showed statistically significant variability across centers (P < .001) for both FPR and average count of 4-mm or larger NCNs, with standard deviations across centers of 8.2 and 0.18, respectively.
Sensitivity versus FPR
Figure 2 shows the fitted regression curve for radiologists’ underlying sensitivities at each FPR. The regression yielded a correlation coefficient for radiologists’ underlying sensitivity and FPRs of ρ = 0.99 (95% confidence interval: 0.54, 1.0), indicating that, at each FPR, there was near 0 variability in radiologists’ underlying sensitivities (note that variability is proportional to 1 − ρ2). Also displayed are sensitivity-FPR points for individual radiologists who interpreted at least 10 cancer-containing studies.
Figure 2:

Graph shows sensitivity versus FPR. Regression line = average underlying reader sensitivity at each FPR. Circles = sensitivity-FPR points for individual radiologists who interpreted at least 10 cancer-containing studies.
Table 4 shows aggregate FPR and sensitivity among all radiologists and according to FPR category (above and below median). Aggregate sensitivity was 93.8%, and aggregate FPR was 27.4%. For radiologists with high FPRs, (aggregate) sensitivity and FPR were 96.5% and 39.7%, respectively, compared with 91.9% and 18.2% for radiologists with low FPRs (P = .02 for difference in sensitivity between groups). With application of a positive screening study definition of high-level follow-up recommendations, overall sensitivity decreased to 86.8% and overall FPR decreased to 7.4%; FPR was 5% higher and sensitivity was 4% higher for radiologists with high FPRs compared with radiologists with low FPRs.
Table 4.
Sensitivity and FPR according to Radiologist Population and Definition of Positivity
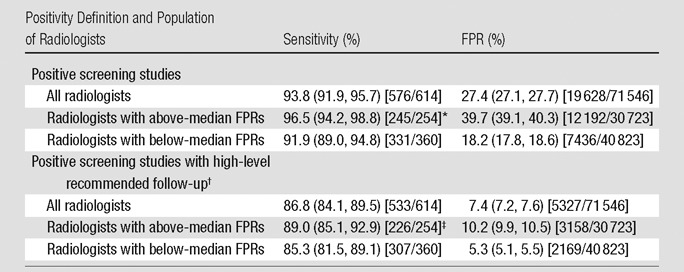
Note.—Data in parentheses are 95% confidence intervals; raw data are in brackets. Rates are aggregate across all studies interpreted by the specified set of radiologists. Confidence intervals and P values were derived from aggregate rates. The median FPR was 27.1%.
Sensitivity difference for above versus below median, P = .02.
High-level follow-up was defined as repeat CT within 3 months, diagnostic CT, PET, or biopsy.
Sensitivity difference for above versus below median, P = .16.
Follow-up Diagnostic Tests
For the radiologists with high FPRs, the rates at which participants with false-positive studies underwent follow-up chest CT examinations, pulmonary function testing, and invasive procedures were 48.7%, 12.3%, and 2.5%, respectively; the comparable rates for the radiologists with low FPRs were 46.8%, 14.0%, and 3.5%. Because the aggregate FPR for the radiologists with high FPRs was 2.2-fold greater than that for the radiologists with low FPRs (39.7% vs 18.2%), the rate ratios for the radiologists with high FPRs versus the radiologists with low FPRs among all screened participants (without cancer) for undergoing these follow-up procedures was 2.3—that is, [2.2 · (48.7/46.8)]—for chest CT, 1.9 for pulmonary function testing, and 1.6 for invasive procedures.
Final Interpretation at E2
The mean FPR for the final E2 interpretation was 19.6% ± 17.3, with an average OR across centers of 7.0, compared with 32.0% ± 16.0 and 3.4 for the E2 isolation interpretation. Among positive E2 isolation interpretations where each reported NCN of 4 mm or larger was preexisting and stable for 2 years (examinations meeting the NLST criteria as eligible for conversion to a negative final interpretation), 35% of radiologists had conversion rates (rates of conversion to a negative final interpretation) of less than 10%, while 32% had rates of more than 90%. If all conversion-eligible studies (and only these) had been converted to negative, the mean FPR at E2 would have been 10.9% ± 8.5, with an average OR across centers of 3.4.
Discussion
On the basis of descriptive analysis and statistical modeling, we found substantial variability in FPRs and NCN counts across radiologists in the NLST. While this has been previously shown in the nonclinical, controlled reader study setting (3–6), our study demonstrates the degree of variability occurring in a clinical setting among a large number of radiologists and screening examinations. Our statistical model, which controlled for sampling variation and participant characteristics, produced an average OR for the FPR of 2.49. In other words, for a random pair of radiologists (generally at different centers), the odds of a false-positive study would be 2.5 times higher if one radiologist interpreted the examination versus the other. Furthermore, the CV for average count of 4-mm or larger NCNs was 70% with a mean of 0.50, meaning that the highest quintile of radiologists would have average counts higher than 0.8 and the lowest quintile would have average counts of less than 0.2.
Additionally, we examined outcomes conveying above-average risk, including high-level recommended follow-up FPR and count of NCNs that were 10 mm or larger. The average OR for high-level follow-up FPR was actually greater (3.48 at E0 and 2.68 at E1 to E2) than that for the standard FPR, which may reflect the fact that radiologists show considerable variability in CT follow-up recommendations even given the same findings (3,4,11). The CV for average count of 10-mm or larger NCNs was smaller (44%) than that for 4-mm or larger NCNs, which is consistent with 4–9-mm NCNs being the most problematic for radiologists, with the risk of malignancy difficult to gauge on the basis of the CT study alone. Variability in counts of 4–9-mm NCNs and of false-positive findings, which predominantly (81%) involve only sub–10-mm NCNs, likely reflects variability in lesion detection, classification, and measurement (ie, whether the NCN was ≥ 4 mm) (4,12). The 44% CV for 10-mm or larger NCNs also likely reflects, in part, variability in nodule measurements, because more than a third (36%) of reported 10-mm or larger NCNs had a reported size of 10 or 11 mm. Developing guidelines on the basis of sets of true- and false-positive cases, designing courses about nodules for chest CT study readers, and improving computer-aided detection and diagnosis tools and automated measurement software, which were not utilized in the NLST, may serve to reduce variability and eventually reduce the overall FPR associated with CT lung screening. Given that we also observed here that the rate of diagnostic follow-up largely mirrored the FPR, a decrease in the FPR could result in a concomitant decrease in the burden of diagnostic procedures among participants without cancer.
Our analysis of FPR versus sensitivity, where we found a very high correlation between radiologists’ sensitivity rates and FPRs, is evidence that radiologists are operating largely along the same underlying receiver operating characteristic curve. This suggests that readers’ predictive abilities may be similar but that they have different inclinations on how conservative to be in terms of “calling” (as positive) a lesion.
Several studies (3–6,13) have examined variability in interpreting CT studies in a controlled setting—that is, where the CT interpretation did not affect patient outcome. Most relevant here, Gierada et al (3) performed a reader study with 16 NLST radiologists and limited image sets from 135 NLST CT studies enriched for nodules. The mean percentage of studies classified as positive was 53% ± 9. To better compare these results with ours, we utilized inverse probability weighting on the raw data to estimate positivity rates with random sampling of images (ie, without enrichment), yielding a mean positivity rate of 37.6% ± 8.0 with average OR of 1.56. Although readers were from 10 NLST centers, the participants were the same, as was the reading environment (eg, image format, browser, viewer), so this standard deviation and average OR should be compared with the modeled within-center SD (8.7%) and OR (1.83) observed here (mean, 27.4%). This shows that variability estimates from controlled reader studies may be similar to such estimates from clinical studies, where readers’ calls do affect patient outcome. Leader et al (13) examined agreement between readers in nodule detection at CT and showed poor nodule-based interobserver agreement (κ = 0.120) but relatively good examination-based interobserver agreement (κ = 0.458). A number of other studies (14,15) examined variability across readers in the estimation of lung nodule volume at CT in a controlled setting; NLST radiologists did not assess nodule volume.
One can compare the findings here with those observed for another imaging modality used for cancer screening, mammography. Elmore et al (8) examined mammography FPRs in a single health maintenance organization, while controlling for subject and examination characteristics, and found an average OR of 1.65. This is not too different from the average (within-center) OR of 1.83 observed in our study. Note that the data of Elmore et al came from clinical practice, not a research protocol; variability in radiologists’ FPRs may be different in such settings from that observed here.
We found substantial variability across centers in FPRs, with the statistical model, which controlled for radiologist variability, showing a standard deviation of 8.2% across centers. Two factors—status as an academic center and location in the “histoplasmosis belt”—did not account for this variability. Having an affiliation with a cancer center corresponded closely to being an academic center, so this factor also did not account for center variability. Differences in the participant mix across centers could be playing some role; we controlled for some participant-level factors (age, sex, body mass index, smoking history), but others could have contributed, including medical and occupational history. Additionally, differences in the guidance given by the NLST lead radiologist and/or differences in institutional culture regarding making distinctions between true nodules and possible artifacts (eg, small scars) could also have contributed to center differences.
There was great variability in converting interpretations of studies that showed stable NCNs at E2 to negative final interpretations. This may reflect variability in perceptions about the risk profile of such lesions. It is also possible, as suggested anecdotally, that some radiologists were not fully aware that these conversions were allowable in the NLST. Although these examinations comprised only a third of NLST examinations, if screening were extended to routine clinical practice, a majority of studies would likely have the prior 2 years’ worth of images available. Because such examinations can potentially confer substantially lower FPRs, it is critical to understand radiologist performance in this context.
There was little variation in CT technical parameters to account for reader variability. For example, 86% of studies were performed with 120 kVp, and only 14% were performed with 140 kVp. Almost all studies were performed with a reconstruction thickness of 2.0 or 2.5 mm. Section thickness, tube voltage, effective tube current, and field of view had minimal effect on FPRs.
A limitation of this study was that the NLST did not systematically collect data on the radiologists, such as years of experience or current reading volume; therefore, we could not directly analyze how these factors impacted reader performance. To our knowledge, few if any studies have examined the effect of reader characteristics on FPR or overall accuracy (ie, area under the receiver operating characteristic curve) in low-dose CT lung screening. However, this has been studied in mammography, with varying results. For example, Barlow et al (16) found no significant effect of years of experience or current reading volume on reader accuracy; however, both FPR and sensitivity decreased with greater number of years of experience and with lower current volume. Elmore et al (17) found no or minimal relationship between either years of experience or reading volume on either FPR or overall accuracy. Smith-Bindman and colleagues (18) found no significant effect of recent volume on FPR or accuracy.
Another limitation of our study was that because a single radiologist interpreted each study, we could not compare radiologists’ interpretations for the same studies directly nor evaluate the specific reasons (lesion detection, classification, or measurement) a nodule was or was not reported.
In conclusion, there was considerable variability in FPRs and nodule counts across radiologists. Higher FPRs were associated with modestly increased sensitivity.
Advances in Knowledge.
• The mean false-positive rate (FPR) for National Lung Screening Trial radiologists was 28.7% ± 13.7 (standard deviation), with a range of 3.8%–69.0%; the mean average nodule count (per examination) was 0.50 ± 0.32, with a range of 0.07–1.79.
• FPRs were similar for academic versus nonacademic centers (mean FPR, 27.9% and 26.7%, respectively) and for centers inside (mean FPR, 25.0%) versus centers outside (mean FPR, 28.7%) the U.S. “histoplasmosis belt.”
• Aggregate sensitivity for radiologists with FPRs higher than the median was 96.5%, compared with 91.9% for radiologists with FPRs lower than the median (P = .02).
Implications for Patient Care.
• Variation in screening CT study interpretation among readers may result in both under- and overutilization of follow-up diagnostic testing, with possible resultant effects on morbidity, mortality, and health care costs.
• Awareness of substantial radiologist variability may encourage educational efforts to decrease interreader variation.
Disclosures of Conflicts of Interest: P.F.P. No relevant conflicts of interest to disclose. D.S.G. Financial activities related to the present article: none to disclose. Financial activities not related to the present article: institution has contract with VuComp to provide medical images for software development. Other relationships: none to disclose. P.H.N. Financial activities related to the present article: none to disclose. Financial activities not related to the present article: owns less than $10 000 of stock each in GE, Altria, and Philip Morris International. Other relationships: none to disclose. E.K. No relevant conflicts of interest to disclose. J.A. No relevant conflicts of interest to disclose.
Received July 25, 2012; revision requested August 24; revision received September 28; accepted January 9, 2013; final version accepted January 29.
Funding: This research was supported by the National Institutes of Health (grants U01-CA-80098 and U01-CA-79778 and contracts N01-CN-25514, N01-CN-25522, N01-CN-25515, N01-CN-25512, N01-CN-25513, N01-CN-25516, N01-CN-25511, N01-CN-25524, N01-CN-25518, and N01-CN-75022).
Abbreviations:
- CV
- coefficient of variation
- FPR
- false-positive rate
- NCN
- noncalcified nodule
- NLST
- National Lung Screening Trial
- OR
- odds ratio
References
- 1.National Lung Screening Trial Research Team. Aberle DR, et al. Reduced lung-cancer mortality with low-dose computed tomographic screening. N Engl J Med 2011;365(5):395–409 [DOI] [PMC free article] [PubMed] [Google Scholar]
- 2.Black WC. Computed tomography screening for lung cancer: review of screening principles and update on current status. Cancer 2007;110(11):2370–2384 [DOI] [PubMed] [Google Scholar]
- 3.Gierada DS, Pilgram TK, Ford M, et al. Lung cancer: interobserver agreement on interpretation of pulmonary findings at low-dose CT screening. Radiology 2008;246(1):265–272 [DOI] [PubMed] [Google Scholar]
- 4.Singh S, Pinsky P, Fineberg NS, et al. Evaluation of reader variability in the interpretation of follow-up CT scans at lung cancer screening. Radiology 2011;259(1):263–270 [DOI] [PMC free article] [PubMed] [Google Scholar]
- 5.Shah SK, McNitt-Gray MF, De Zoysa KR, et al. Solitary pulmonary nodule diagnosis on CT: results of an observer study. Acad Radiol 2005;12(4):496–501 [DOI] [PubMed] [Google Scholar]
- 6.Brown MS, Goldin JG, Rogers S, et al. Computer-aided lung nodule detection in CT: results of large-scale observer test. Acad Radiol 2005;12(6):681–686 [DOI] [PubMed] [Google Scholar]
- 7.National Lung Screening Trial Research Team. Aberle DR, et al. The National Lung Screening Trial: overview and study design. Radiology 2011;258(1):243–253 [DOI] [PMC free article] [PubMed] [Google Scholar]
- 8.Elmore JG, Miglioretti DL, Reisch LM, et al. Screening mammograms by community radiologists: variability in false-positive rates. J Natl Cancer Inst 2002;94(18):1373–1380 [DOI] [PMC free article] [PubMed] [Google Scholar]
- 9.Larsen K, Petersen JH, Budtz-Jørgensen E, Endahl L. Interpreting parameters in the logistic regression model with random effects. Biometrics 2000;56(3):909–914 [DOI] [PubMed] [Google Scholar]
- 10.Facts about histoplasmosis National Eye Institute Web site. http://www.nei.nih.gov/health/histoplasmosis/histoplasmosis.asp. Accessed August 28, 2012
- 11.Munden RF, Hess KR. “Ditzels” on chest CT: survey of members of the Society of Thoracic Radiology. AJR Am J Roentgenol 2001;176(6):1363–1369 [DOI] [PubMed] [Google Scholar]
- 12.Goodman LR, Gulsun M, Washington L, Nagy PG, Piacsek KL. Inherent variability of CT lung nodule measurements in vivo using semiautomated volumetric measurements. AJR Am J Roentgenol 2006;186(4):989–994 [DOI] [PubMed] [Google Scholar]
- 13.Leader JK, Warfel TE, Fuhrman CR, et al. Pulmonary nodule detection with low-dose CT of the lung: agreement among radiologists. AJR Am J Roentgenol 2005;185(4):973–978 [DOI] [PubMed] [Google Scholar]
- 14.Gietema HA, Wang Y, Xu D, et al. Pulmonary nodules detected at lung cancer screening: interobserver variability of semiautomated volume measurements. Radiology 2006;241(1):251–257 [DOI] [PubMed] [Google Scholar]
- 15.Wang Y, van Klaveren RJ, van der Zaag-Loonen HJ, et al. Effect of nodule characteristics on variability of semiautomated volume measurements in pulmonary nodules detected in a lung cancer screening program. Radiology 2008;248(2):625–631 [DOI] [PubMed] [Google Scholar]
- 16.Barlow WE, Chi C, Carney PA, et al. Accuracy of screening mammography interpretation by characteristics of radiologists. J Natl Cancer Inst 2004;96(24):1840–1850 [DOI] [PMC free article] [PubMed] [Google Scholar]
- 17.Elmore JG, Jackson SL, Abraham L, et al. Variability in interpretive performance at screening mammography and radiologists’ characteristics associated with accuracy. Radiology 2009;253(3):641–651 [DOI] [PMC free article] [PubMed] [Google Scholar]
- 18.Smith-Bindman R, Chu P, Miglioretti DL, et al. Physician predictors of mammographic accuracy. J Natl Cancer Inst 2005;97(5):358–367 [DOI] [PubMed] [Google Scholar]