Ferritin heavy chain overexpression in combination with R2 mapping enables quantitative in vivo examination of cell recruitment, and when combined with biexponential MR relaxometry, enables in vivo measurement of reporter gene–expressing cell fraction in a mixed cell population.
Abstract
Purpose:
To quantitatively monitor the dynamic perivascular recruitment of ferritin heavy chain (FHC)–overexpressing fibroblasts to ovarian carcinoma xenografts by using R2 mapping and biexponential magnetic resonance (MR) relaxometry.
Materials and Methods:
In vivo studies of female mice were approved by the institutional animal care and use committee. In vitro analysis included MR-based R2 relaxation measurements of monkey kidney cell line (CV1) fibroblasts that overexpress FHC, followed by inductively coupled plasma mass spectrometry to assess cellular iron content. For in vivo analysis, CV1-FHC fibroblasts were either mixed with fluorescent human ovarian carcinoma cells before subcutaneous implantation (coinjection) or injected intraperitoneally 4 days after the cancer cells were injected (remote recruitment). Dynamic changes in tumor R2 were used to derive CV1-FHC cell fraction in both models. In coinjection tumors, dynamic contrast material–enhanced MR imaging was used to measure tumor fractional blood volume. Whole-body fluorescence imaging and immunohistochemical staining were performed to validate MR results. One-way repeated measures analysis of variance was used to assess MR and fluorescence imaging results and tumor volume, and one-way analysis of variance was used to assess spectrometric results, fractional blood volume, and immunohistochemical evaluation.
Results:
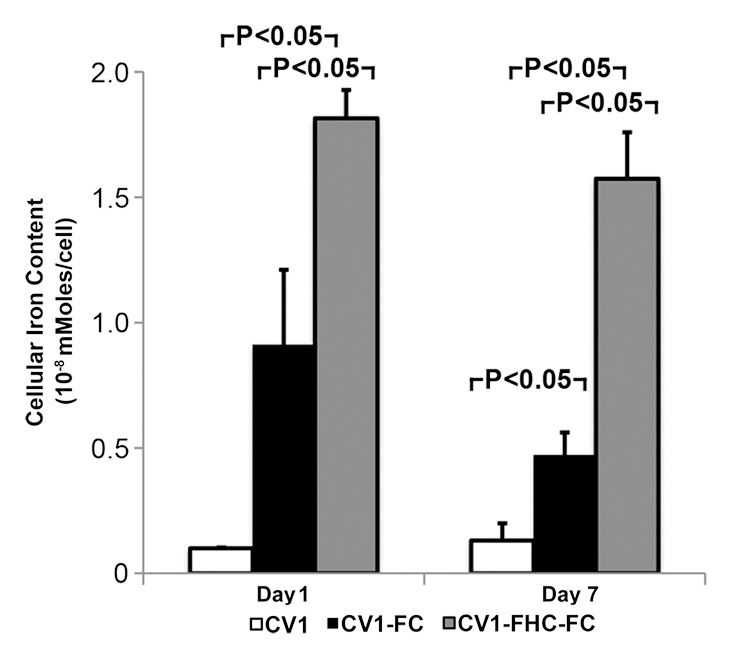
CV1-FHC fibroblasts (vs CV1 fibroblasts) showed enhanced iron uptake (1.8 mmol ± 0.5 × 10⁻⁸ vs 0.9 mmol ± 0.5 × 10⁻⁸; P < .05), retention (1.6 mmol ± 0.5 × 10⁻⁸ vs 0.5 mmol ± 0.5 × 10⁻⁸, P < .05), and cell density–dependent R2 contrast. R2 mapping in vivo revealed preferential recruitment of CV1-FHC cells to the tumor rim in both models. Measurement of fractional blood volume was similar in all tumors (2.6 AU ± 0.5 × 10⁻³ for CV1, 2.3 AU ± 0.3 × 10⁻³ for CV1-FHC, 2.9 ± 0.3 × 10⁻³ for CV1-FHC-ferric citrate). Dynamic changes in CV1-FHC cell fraction determined at MR relaxometry in both models were confirmed at immunohistochemical analysis.
Conclusion:
FHC overexpression, when combined with R2 mapping and MR relaxometry, enabled in vivo detection of the dynamic recruitment of exogenously administered fibroblasts to the vasculature of solid tumors.
© RSNA, 2013
Supplemental material: http://radiology.rsna.org/lookup/suppl/doi:10.1148/radiol.13122053/-/DC1
Introduction
The recruitment of fibroblasts from local or remote tissues by tumors is a critical aspect of tumor growth and metastasis (1,2). On recruitment, activated stromal myofibroblasts direct and stabilize tumor blood vessels and remodel the extracellular matrix, thereby guiding tumor growth and promoting the metastasis of cancer cells (1–4). Although existing treatments typically target either cancer cells (eg, chemical and radiation therapies) or the vascular microenvironment (eg, antiangiogenic therapy [6]), the goal of emerging therapies is to decrease tumor growth and metastasis through redirected tumor-stromal interactions, potentially by targeting cancer-associated fibroblasts or by recruiting genetically modified fibroblasts (4). The efficacy of such therapies must be evaluated with methods that can allow quantification and correlation of recruitment with therapeutic outcomes at the subtissue level and in both preclinical models and clinical trials.
Magnetic resonance (MR) imaging is an established method for acquisition of high-spatial-resolution anatomic images. MR imaging cell-tracking techniques have enabled longitudinal tracking of labeled cells in the brain, heart, and in numerous cancer models (7,8). Typically, iron oxide nanoparticles or other contrast media (7) are used to label cells and generate contrast on MR images. Although such methods generate robust contrast, limitations including asymmetric dilution of the contrast agent with each cell division (9), altered cellular phenotypes (9,10), persistence of label after cell death (11), and dependence on visual identification of signal intensity loss in the case of iron oxide nanoparticles hinder the ability to garner more detailed measurements, including the relative population of labeled cells.
Ideally, cell labeling should remain consistent throughout cell divisions and should enable quantification of labeled cells in a mixed-cell population. MR imaging reporter gene methods are well suited for this purpose and are emerging alternatives to conventional cell-labeling strategies (12,13). A prominent MR imaging reporter gene method uses cellular overexpression of proteins responsible for maintaining iron homeostasis, notably ferritin, to generate R2 and/or R2* contrast on images of reporter gene–expressing cells (14–23). Studies in which ferritin was used as a reporter gene for MR imaging of cell survival (15,23,24), migration (21), and differentiation (16) showed promising results. However authors of these studies either examined high densities of ferritin-overexpressing cells or followed the migration of tagged cells through a narrowly defined path near the injection site (21). We sought to quantitatively monitor the dynamic perivascular recruitment of ferritin heavy chain (FHC)–overexpressing fibroblasts to ovarian tumor xenografts by using R2 mapping and biexponential MR relaxometry.
Materials and Methods
Cell Preparation
Cell lines of human ovarian epithelial carcinoma cells and normal monkey kidney fibroblasts (CV1) were cultured in Dulbeco’s modified eagle’s medium (DMEM) as described in Granot et al (25). Cancer cells expressing the enhanced green fluorescent protein (eGFP), CV1 fibroblasts expressing tomato fluorescent protein (provided by Roger Tsien, University of California, San Diego), and CV1 fibroblasts overexpressing human influenza hemagglutinin–tagged FHC (CV1-FHC), were generated (B.C., with 15 years of experience) as described in Cohen et al (15). Western blot analysis was performed on extracts from CV1 and CV1-FHC fibroblasts, and isolated cells were stained for influenza hemagglutinin and 4′,6-diamidino-2-phenylindole (Appendix E1 [online]).
In Vitro Experiments
CV1-FHC and CV1 fibroblasts were grown in DMEM supplemented with 1 mmol per liter of ferric citrate (FC) for 48 hours (CV1-FHC-FC and CV1-FC, respectively), and control CV1 fibroblasts were grown in DMEM without supplementation. Cells were repeatedly washed with phosphate buffered saline solution and were either immediately harvested on day 1 or grown in DMEM for an additional 7 days. Cells were suspended in agarose phantoms at densities of 1, 2.5, 5, and 10 × 106 cells/mL at day 1, and 2.5, 5, 10, and 20 × 106 cells/mL at day 7. MR imaging was performed (M.H.V., with 8 years of experience) with a horizontal bore 9.4 T imager (Bruker Biospec; Ettlingen, Germany). T2-weighted images were acquired at increasing echo times by using a multisection multispin echo-pulse sequence with specific parameters: repetition time sec/echo time msec, 3/10; number of echoes, 60; section thickness, 0.8 mm; field of view, 6 × 4 cm; matrix, 256 × 256; sections, four. Afterward, cells were recovered and cellular iron content was quantified by using inductively coupled plasma mass spectrometry (26). Separately, CV1-FHC fibroblasts were cultured in DMEM and FC for 48 hours, washed repeatedly, and further grown in DMEM for 4 days. Cells were then isolated, washed, and processed in a centrifuge four times at 1000 rpm, with residual phosphate-buffered saline removed after each centrifugation. Multisection multispin echo pulse sequence imaging was performed to determine the R2 of CV1-FHC-FC fibroblasts.
In Vivo Tumor Models
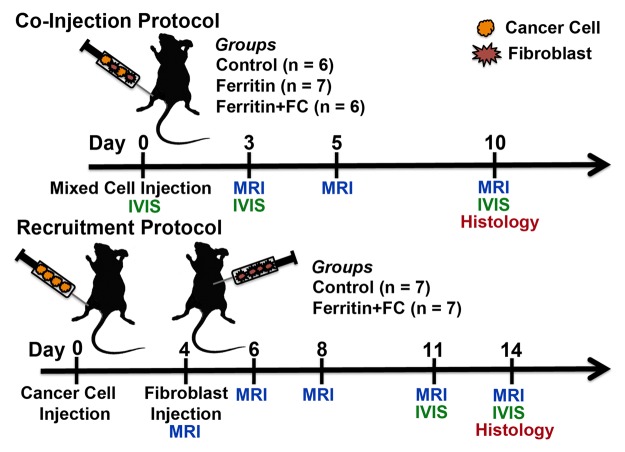
Animal experiments were approved by the animal care and use committee at our institution. Female CD1 nude mice were purchased from Harlan Laboratories (Indianapolis, Ind) and fed chlorophyll-free chow. For coinjection experiments, cancer cells and fibroblasts were mixed before subcutaneous injection into the hind limb of 8-week-old mice (Fig 1). In recruitment experiments, fibroblasts were injected intraperitoneally at a remote site in the abdomen 4 days after hind limb subcutaneous injection of cancer cells (Fig 1). The composition of experimental groups is detailed in Table 1 In the coinjection protocol, CV1-FHC cells were either injected without prior exposure to FC supplemented medium (FHC group), or were grown in FC supplemented medium for 48 hours prior to injection (FHC-FC group). After isolation, these cells were washed three times before being mixed with human ovarian cancer cells and CV1 cells expressing tomato fluorescent protein to remove any residual FC. In the recruitment protocol, control CV1 fibroblasts were labeled (CV1-DiR) with 3.5 µg/mL of the fluorescent label DiR (Molecular Probes, Life Technologies, Grand Island, NY) as described in Granot et al (25).
Figure 1:
Experiment time course. Mice in coinjection group were injected with mixture of human ovarian cancer cells and CV1 (control), CV1-FHC (ferritin), or CV1-FHC-FC (ferritin + FC) fibroblasts. Whole body in vivo fluorescence imaging (IVIS) was performed immediately after and 3 and 10 days after cell injection. MR imaging was performed at 3, 5, and 10 days after cell injection. For recruitment group, cancer cells were injected into mice, and on day 4, either CV1 or CV1-FHC-FC fibroblasts were injected intraperitoneally at site remote from tumor. Recruitment of CV1-FHC cells was examined with MR imaging immediately after and 2, 4, 7, and 9 days after remote injection. At 7 days after injection, IVIS imaging was used to confirm recruitment of CV1 cells. At conclusion of both protocols, tumors were removed for histologic examination.
Table 1.
Composition of In Vivo Tumor Models

Note.—Data are number of cells. MLS = human ovarian cancer cell line, eGFP = enhanced green fluorescent protein, Tom = Tomato fluorescent protein, DiR = 1,1’-dioctadecyl-3,3,3’,3’-tetramethylindotricarbocyanine iodide.
MR Imaging and Experimental Time-Course
Animals were positioned prone and warmed by using circulating water controlled with a thermostat. Anesthesia was maintained by using 1.25% isoflurane in oxygen, and respiration was monitored throughout imaging, which was performed with a small animal monitoring system (Small Animal Instruments, Stony Brook, NY). A multisection multispin echo pulse sequence was used to acquire a series of T2-weighted images at increasing echo times. Specific parameters included repetition time sec/echo time msec, 3/7.07; echoes, 30; section thickness, 0.8 mm; field of view, 28.1 × 28.1 mm; matrix, 256 × 128; number of sections, five to eight; averages, three. To define tumor boundaries, gadopentetate dimeglumine was injected with an indwelling intraperitoneal line after acquisition of a multisection multispin echo pulse sequence. A series of gadopentetate dimeglumine–enhanced T1-weighted gradient-echo images (repetition time msec/echo time msec, 10/2.53; flip angle, 10°, averages, three) and multisection spin-echo images (rapid acquisition with relaxation enhancement factor, four; effective echo time, 22 msec; averages, two) were acquired with identical spatial parameters. For the coinjection protocol, MR imaging was performed 3, 5, and 10 days after tumor initiation (Fig 1). For the recruitment protocol, MR imaging was performed 4, 6, 8, 11, and 13 days after tumor initiation (Fig 1). After MR imaging, in vivo whole-body fluorescence imaging was performed (Appendix E1 [online]).
Vascular Mapping with Dynamic Contrast–enhanced MR Imaging
Measurement of fractional blood volume (fBV) was performed after R2 mapping at day 10 of the coinjection protocol in the control, FHC, and FHC-FC groups (three mice per group). Three-dimensional gradient-echo images with identical spatial parameters as the multisection multispin echo pulse sequence images were acquired with specific parameters: repetition time msec/echo time msec, 7.0/2.53; field of view, 28.1 × 28.1 × 80 mm; Matrix, 256 × 128 × 10; signals acquired, two; and flip angles, 5°, 15°, 30°, 45°, and 75°. R1 mapping was performed as described in Dafni et al (27). Next, biotin-bovine serum albumin gadopentetate dimeglumine was infused through an indwelling tail vein catheter, and gradient-echo images were continuously acquired (flip angle, 15°) (27). Calculation of fBV was then performed as described in Dafni et al (27).
Data Analysis
Analysis of MR imaging data was performed by using custom software in Matlab (Mathworks, Natick, Mass). In phantoms, mean signal intensity was measured in each section. R2 relaxation was quantified by using a least-squares optimization curve-fitting algorithm: SI (TE) = SI0e−R2 × TE + C, where SI is signal intensity, TE is echo time, SI0 is signal intensity with an echo time of 0 msec; R2 is the transverse relaxation rate, and C is the noise at the last echo time. For in vivo studies, tumor geometry was manually segmented on gadopentetate dimeglumine–enhanced images. Mean tumor R2 values were calculated by using the average signal intensity in each section. For regional R2 measurements, pixel-wise fitting was performed, and the tumor rim and core were defined as the outer two pixels along the circumferential direction and the remaining tumor mass, respectively. Finally, tumor volume was calculated by multiplying the number of voxels within the tumor by voxel volume.
Measurement of CV1-FHC Cell Fraction with MR Relaxometry
For assessment of the labeled CV1-FHC cell fraction, signal decay curves were derived by a least squares fitting algorithm to the biexponential function SI (TE) = SI0(A ⋅ e−R2f × TE + B ⋅ e−R2c × TE) + C, where parameters A and B represent the weighted coefficients of the labeled CV1-FHC and the tumor mass components, respectively, R2f is the R2 of CV1-FHC-FC cells, and R2c represents the mean control tumor R2 measured throughout all experiments. The CV1-FHC (high R2) and tumor (low R2) cell fractions were calculated as [A/(A + B)] ⋅ 100 and [B/(A + B)] ⋅ 100, respectively.
Immunohistochemical Validation
Immunohistochemical and immunofluorescent staining was performed on isolated tissue sections (Appendix E1 [online]). Fluorescent microscopic images were acquired with a Zeiss Axio microscope (Carl Zeiss, Oberkochen, Germany). For quantitative immunofluorescence analysis (M.V.H., S.M., with 1 year of experience), images were acquired of four sections at different locations in tumors at day 10 (coinjection, n = 2) and at day 13 (recruitment, n = 2) tumors from the CV1-FHC-FC group mice. Boxes measuring 110 μm2 were superimposed at five to eight locations on each image, and the relative fraction of influenza hemagglutinin–expressing cells was calculated by counting the number of nuclei and positively stained cells.
Statistical Analysis
Statistical analysis was performed by using SigmaStat software (Aspire Software, Ashburn, Va). One-way repeated-measures analysis of variance Holms-Sidak comparisons were performed to assess differences in R2, fluorescent radiance, cell fraction, and tumor size in all studies. One-way analysis of variance was performed to assess differences in cellular iron content, fBV, and immunohistochemical measurements. P values less than .05 were considered to indicate a significant difference.
Results
FHC Overexpression Enhances Iron Uptake, Retention, and R2 Contrast
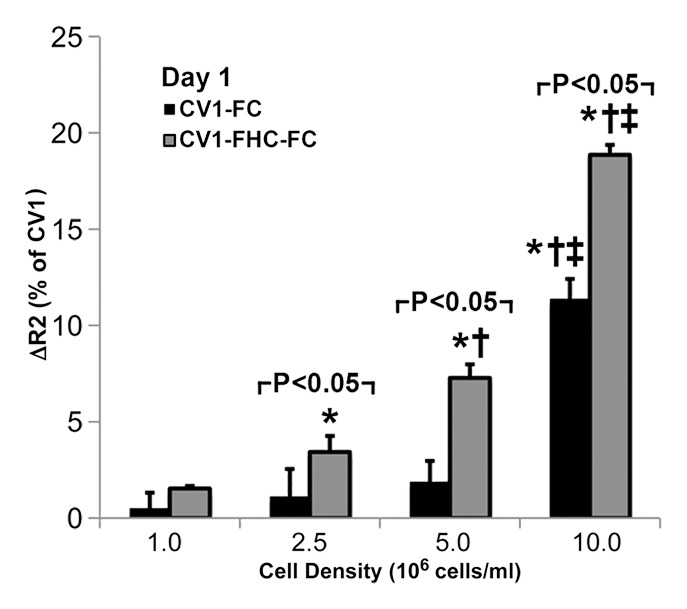
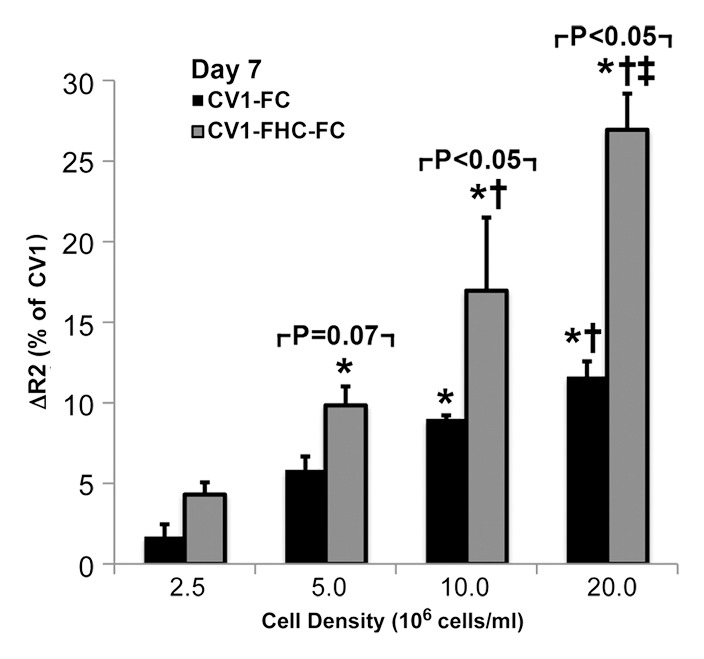
Western blot analysis (Fig E1 [online]) and cell staining (Fig 2a) confirmed influenza hemagglutinin-FHC expression in CV1-FHC cells (Fig 2a). Phantom studies revealed cell density–dependent increases in R2 contrast in CV1-FHC-FC compared with that in CV1-FC cells at both time points (Fig 2b, 2c). Enhanced R2 contrast corresponded with increased iron uptake (day 1) and retention (day 7) in CV1-FHC-FC cells compared with that in CV1-FC cells (Fig 2d).
Figure 2a:
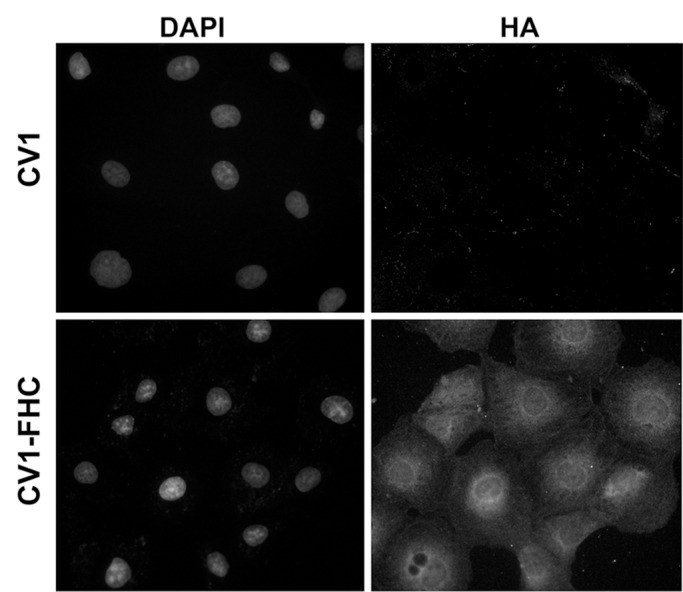
(a) Photomicrographs of dual immunofluorescent nuclear 4′,6-diamidino-2-phenylindole (DAPI) and human influenza hemagglutinin (HA) staining reveal robust perinuclear FHC expression in CV1-FHC fibroblasts. (b) Bar graph shows data for CV1-FC and CV1-FHC-FC cells imaged immediately after removal from FC-supplemented medium. CV1-FHC-FC cells showed significantly enhanced mean R2 contrast at increasing cell densities when compared with CV1-FC cells at day 1. Control (CV1) phantoms contained CV1 cells suspended at identical densities. * = P < .05 vs 1.0 ×10⁶ cells/mL, † = P < .05 vs 2.5 × 10⁶ cells/mL, ‡ = P < .05 vs 5.0 × 10⁶ cells/mL. (c) Bar graph shows that on day 7 after removal of FC-supplemented medium, mean R2 contrast remained significantly enhanced in CV1-FHC-FC compared with that in CV1-FC cells at increasing cell densities. * = P < .05 vs 2.5 ×10⁶ cells/mL, † = P < .05 vs 5.0 × 10⁶ cells/mL, ‡ = P < .05 vs 10 × 106 cells/mL. (d) Bar graph shows enhanced iron uptake on day 1 and retention on day 7 in CV1-FHC-FC cells.
Figure 2b:
(a) Photomicrographs of dual immunofluorescent nuclear 4′,6-diamidino-2-phenylindole (DAPI) and human influenza hemagglutinin (HA) staining reveal robust perinuclear FHC expression in CV1-FHC fibroblasts. (b) Bar graph shows data for CV1-FC and CV1-FHC-FC cells imaged immediately after removal from FC-supplemented medium. CV1-FHC-FC cells showed significantly enhanced mean R2 contrast at increasing cell densities when compared with CV1-FC cells at day 1. Control (CV1) phantoms contained CV1 cells suspended at identical densities. * = P < .05 vs 1.0 ×10⁶ cells/mL, † = P < .05 vs 2.5 × 10⁶ cells/mL, ‡ = P < .05 vs 5.0 × 10⁶ cells/mL. (c) Bar graph shows that on day 7 after removal of FC-supplemented medium, mean R2 contrast remained significantly enhanced in CV1-FHC-FC compared with that in CV1-FC cells at increasing cell densities. * = P < .05 vs 2.5 ×10⁶ cells/mL, † = P < .05 vs 5.0 × 10⁶ cells/mL, ‡ = P < .05 vs 10 × 106 cells/mL. (d) Bar graph shows enhanced iron uptake on day 1 and retention on day 7 in CV1-FHC-FC cells.
Figure 2c:
(a) Photomicrographs of dual immunofluorescent nuclear 4′,6-diamidino-2-phenylindole (DAPI) and human influenza hemagglutinin (HA) staining reveal robust perinuclear FHC expression in CV1-FHC fibroblasts. (b) Bar graph shows data for CV1-FC and CV1-FHC-FC cells imaged immediately after removal from FC-supplemented medium. CV1-FHC-FC cells showed significantly enhanced mean R2 contrast at increasing cell densities when compared with CV1-FC cells at day 1. Control (CV1) phantoms contained CV1 cells suspended at identical densities. * = P < .05 vs 1.0 ×10⁶ cells/mL, † = P < .05 vs 2.5 × 10⁶ cells/mL, ‡ = P < .05 vs 5.0 × 10⁶ cells/mL. (c) Bar graph shows that on day 7 after removal of FC-supplemented medium, mean R2 contrast remained significantly enhanced in CV1-FHC-FC compared with that in CV1-FC cells at increasing cell densities. * = P < .05 vs 2.5 ×10⁶ cells/mL, † = P < .05 vs 5.0 × 10⁶ cells/mL, ‡ = P < .05 vs 10 × 106 cells/mL. (d) Bar graph shows enhanced iron uptake on day 1 and retention on day 7 in CV1-FHC-FC cells.
Figure 2d:
(a) Photomicrographs of dual immunofluorescent nuclear 4′,6-diamidino-2-phenylindole (DAPI) and human influenza hemagglutinin (HA) staining reveal robust perinuclear FHC expression in CV1-FHC fibroblasts. (b) Bar graph shows data for CV1-FC and CV1-FHC-FC cells imaged immediately after removal from FC-supplemented medium. CV1-FHC-FC cells showed significantly enhanced mean R2 contrast at increasing cell densities when compared with CV1-FC cells at day 1. Control (CV1) phantoms contained CV1 cells suspended at identical densities. * = P < .05 vs 1.0 ×10⁶ cells/mL, † = P < .05 vs 2.5 × 10⁶ cells/mL, ‡ = P < .05 vs 5.0 × 10⁶ cells/mL. (c) Bar graph shows that on day 7 after removal of FC-supplemented medium, mean R2 contrast remained significantly enhanced in CV1-FHC-FC compared with that in CV1-FC cells at increasing cell densities. * = P < .05 vs 2.5 ×10⁶ cells/mL, † = P < .05 vs 5.0 × 10⁶ cells/mL, ‡ = P < .05 vs 10 × 106 cells/mL. (d) Bar graph shows enhanced iron uptake on day 1 and retention on day 7 in CV1-FHC-FC cells.
FHC Overexpression Illuminates the Core-To-Rim Migration of Fibroblasts in Co-Injection Tumors
Sample images of groups of mice bearing ovarian carcinoma tumor xenografts with control, CV1-FHC, and CV1-FHC-FC fibroblasts (hereafter termed control, FHC, and FHC-FC tumors, respectively) acquired at day 3 show greater loss of signal intensity at higher echo times in FHC-FC tumors (Fig 3a). By day 10, R2 mapping revealed heightened R2 along the rims of FHC-FC and FHC tumors (Fig 3b). Regional R2 measurements confirmed the core-to-rim migration of CV1-FHC cells in FHC and FHC-FC tumors (Fig 3c). Mean tumor R2 measurements mirrored in vivo fluorescence measurements (Fig E2 [online]). Finally, tumor volumes were similar in all groups at days 3 and 10 (Table 2).
Figure 3a:
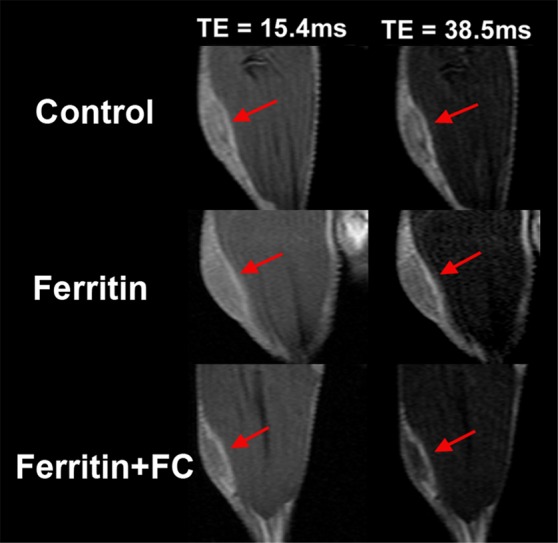
R2 mapping of tumors reveals core-to-rim migration of CV1-FHC fibroblasts. (a) Representative spin-echo coronal images of tumors (red arrows) acquired 3 days after coinjection of cancer cells and CV1 (control), CV1-FHC (ferritin), or CV1-FHC-FC (ferritin + FC) fibroblasts. Images of control and FHC group mice showed similar signal intensities at each echo time (15.4 msec and 38.5 msec). Images of FHC-FC group mice showed diffuse signal hypointensity at increasing echo times. (b) R2 mapping show similar tumor relaxation properties in control and FHC tumors 3 days after tumor initiation, and significantly heightened R2 in FHC-FC tumors. On day 10, R2 mapping showed migration of CV1-FHC cells to rims of tumors in FHC-FC group mice. In FHC tumors, heightened R2 was also observed along tumor rim. (c) Mean regional R2 showed core-to-rim migration in FHC-FC tumors. Time-dependent increase in R2 of rim was also observed in FHC tumors, but no change was seen in core. * = P < 05 vs day 3, † = P < .05 vs day 5.
Figure 3b:
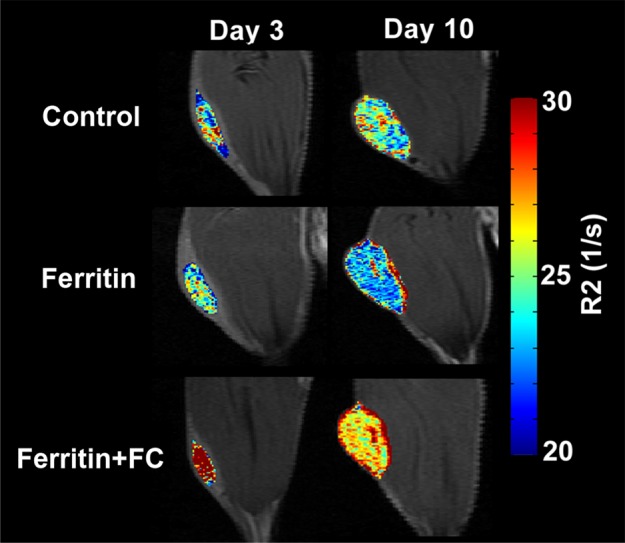
R2 mapping of tumors reveals core-to-rim migration of CV1-FHC fibroblasts. (a) Representative spin-echo coronal images of tumors (red arrows) acquired 3 days after coinjection of cancer cells and CV1 (control), CV1-FHC (ferritin), or CV1-FHC-FC (ferritin + FC) fibroblasts. Images of control and FHC group mice showed similar signal intensities at each echo time (15.4 msec and 38.5 msec). Images of FHC-FC group mice showed diffuse signal hypointensity at increasing echo times. (b) R2 mapping show similar tumor relaxation properties in control and FHC tumors 3 days after tumor initiation, and significantly heightened R2 in FHC-FC tumors. On day 10, R2 mapping showed migration of CV1-FHC cells to rims of tumors in FHC-FC group mice. In FHC tumors, heightened R2 was also observed along tumor rim. (c) Mean regional R2 showed core-to-rim migration in FHC-FC tumors. Time-dependent increase in R2 of rim was also observed in FHC tumors, but no change was seen in core. * = P < 05 vs day 3, † = P < .05 vs day 5.
Figure 3c:
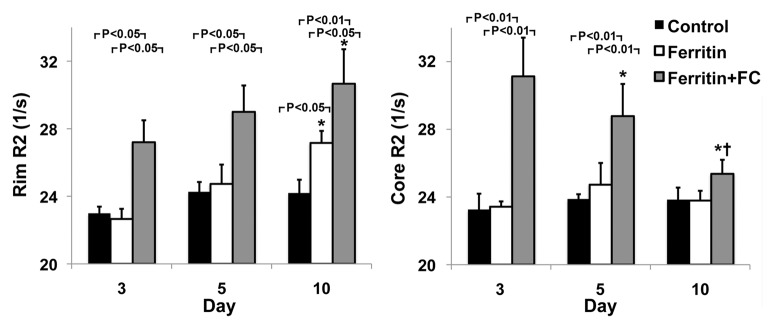
R2 mapping of tumors reveals core-to-rim migration of CV1-FHC fibroblasts. (a) Representative spin-echo coronal images of tumors (red arrows) acquired 3 days after coinjection of cancer cells and CV1 (control), CV1-FHC (ferritin), or CV1-FHC-FC (ferritin + FC) fibroblasts. Images of control and FHC group mice showed similar signal intensities at each echo time (15.4 msec and 38.5 msec). Images of FHC-FC group mice showed diffuse signal hypointensity at increasing echo times. (b) R2 mapping show similar tumor relaxation properties in control and FHC tumors 3 days after tumor initiation, and significantly heightened R2 in FHC-FC tumors. On day 10, R2 mapping showed migration of CV1-FHC cells to rims of tumors in FHC-FC group mice. In FHC tumors, heightened R2 was also observed along tumor rim. (c) Mean regional R2 showed core-to-rim migration in FHC-FC tumors. Time-dependent increase in R2 of rim was also observed in FHC tumors, but no change was seen in core. * = P < 05 vs day 3, † = P < .05 vs day 5.
Table 2.
Changes in Tumor Volume in Coinjection and Recruitment Protocols
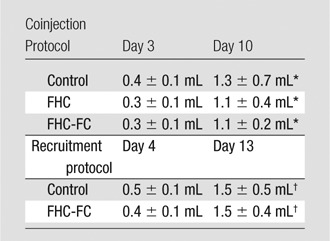
Note.—Data are mean ± standard deviation. Tumor volumes were similar (coinjection: FHC vs control at day 3, P = .55; FHC-FC vs control at day 3, P = .70; FHC vs FHC-FC at day 3, P = .90; FHC vs control at day 10, P = .51; FHC-FC vs control at day 10, P = .37; FHC vs FHC-FC at day 10, P = .79) between all groups throughout each research protocol (Recruitment: FHC-FC vs control at day 4, P = .57; FHC-FC vs control at day 13, P = .76).
P < .05 vs day 3.
P < .05 vs day 4.
Vascular Mapping Reveals the Vascular Niche Occupied by CV1-FHC Fibroblasts
We measured fBV after infusion of the intravascular contrast agent biotin-bovine serum albumin gadopentetate dimeglumine (Fig 4a). Although fBV was similar (P = .16) in control, FHC, and FHC-FC tumors (Fig 4b), the distribution of R2 values was fBV-dependent in FHC tumors (Fig E3 [online]). Applying a threshold of R2 greater than or equal to 28.0 (1/sec), calculated as two standard deviations above the mean of control group tumors, the percentage of tumor voxels showing heightened R2 remained consistently higher throughout all levels of fBV in the FHC-FC group than in control group tumors (Fig E3 [online]). In FHC group tumors, the fraction of heightened R2 voxels increased as a function of fBV (Fig E3 [online]).
Figure 4a:
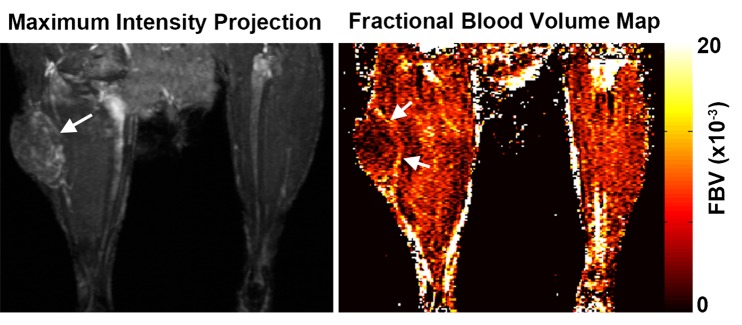
(a) Representative maximum intensity projection shows enhancement of tumor (arrow, left image) vasculature after injection of biotin-bovine serum albumin gadopentetate dimeglumine, which enabled measurement of fBV in tumor. Map of fBV for one section in the tumor (right) shows elevated fBV around highly angiogenic tumor rim (arrows), and depressed fBV at core of tumor. (b) Mean fBV was similar in control, FHC, and FHC-FC tumors, which shows that overexpression of FHC in cancer-associated fibroblasts does not alter vascularity of maturing tumor.
Figure 4b:
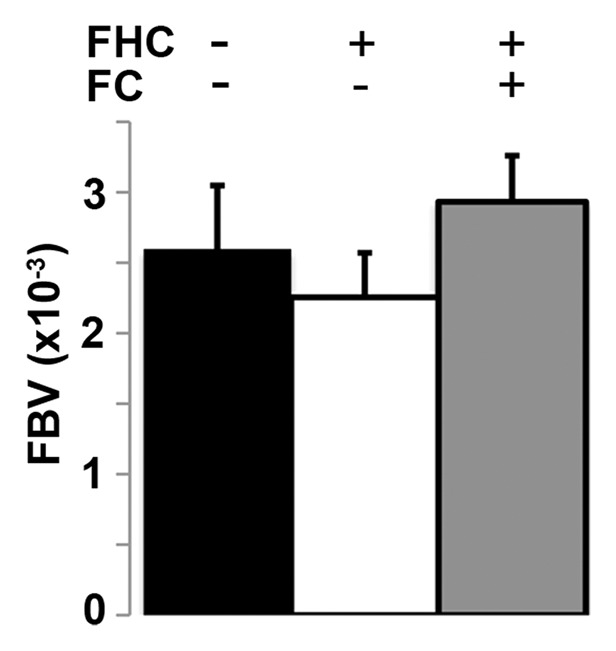
(a) Representative maximum intensity projection shows enhancement of tumor (arrow, left image) vasculature after injection of biotin-bovine serum albumin gadopentetate dimeglumine, which enabled measurement of fBV in tumor. Map of fBV for one section in the tumor (right) shows elevated fBV around highly angiogenic tumor rim (arrows), and depressed fBV at core of tumor. (b) Mean fBV was similar in control, FHC, and FHC-FC tumors, which shows that overexpression of FHC in cancer-associated fibroblasts does not alter vascularity of maturing tumor.
R2 Mapping Reveals the Dynamic Time Course of CV1-FHC Recruitment
By using the recruitment of remotely administered fibroblasts to a solid tumor, we evaluated FHC overexpression for MR imaging cell tracking under conditions of sparse cell density. The recruitment of CV1-FHC fibroblasts was detectable as heightened mean R2 starting 4 days after injection (Fig 5a), and heightened regional R2 at the rim of FHC-FC tumors 2 days after fibroblast injection (Fig 5b). Both R2 mapping (Fig 5c), and T2*-weighted gradient-echo scout images (Fig 5d) revealed preferential recruitment of CV1-FHC fibroblasts to the rim of FHC-FC tumors. Fluorescence imaging confirmed colocalization of eGFP signal in cancer cells and of 1,1′-dioctadecyl-3,3,3′-tetramethylindotricarbocyanine iodide (Molecular Probes; LifeTechnologies, Grand Island, NY [25]) signal (Fig 5e) in cancer cells and FHC-FC and control tumors reflected overall recruitment in both groups (control vs FHC-FC, 1.4 × 10⁷ photons/sec/cm2/steradian ±0.4 × 10⁷ vs 1.4 × 10⁷ photons/sec/cm2/steradian ± 0.1 × 10⁷; P = .87). Tumor volumes were similar in both groups (Table 2).
Figure 5a:
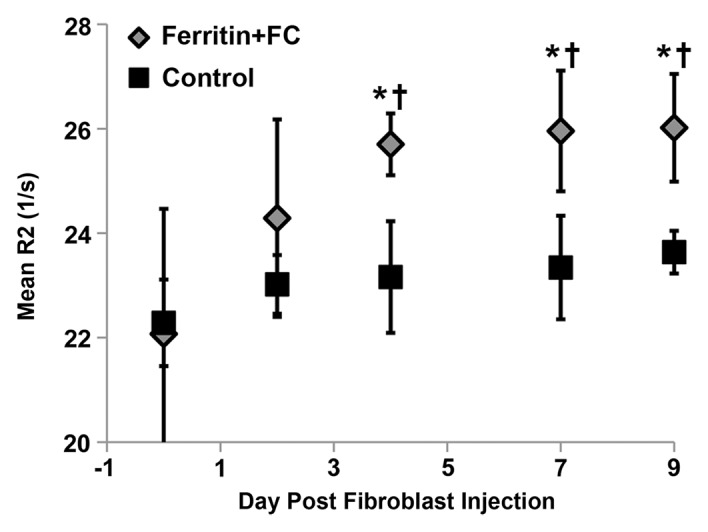
(a) Mean tumor R2 was similar in FHC-FC and control group tumors before and immediately after remote injection of fibroblasts. Mean R2 increased in FHC-FC tumors 4 days after remote injection of CV1-FHC fibroblasts and remained higher than that at baseline and in control tumors at all subsequent time points. (b) Mean regional R2 showed preferential recruitment of CV1-FHC fibroblasts to rim of tumors as early as 2 days after remote injection, with minor migration into core of tumor. (c) Representative R2 maps of midtumor sections acquired 7 days after remote administration of either CV1 or CV1-FHC fibroblasts show heightened R2 values along rim of FHC-FC tumors because of recruitment of CV1-FHC cells. (d) Gradient-echo axial scout images (echo time, 2.58 msec) show hypointensity along rim of FHC-FC tumors (red arrows) that are not present in control tumors. (e) In vivo fluorescence imaging confirmed colocalization of signal from cancer cells with signal from CV1 cells, confirming recruitment of remotely administered fibroblasts to tumors. * = P < .05 vs core, † = P < .05 vs control, ‡ = P < .05 vs day 0, # = P < .05 vs day 2 after injection.
Figure 5b:
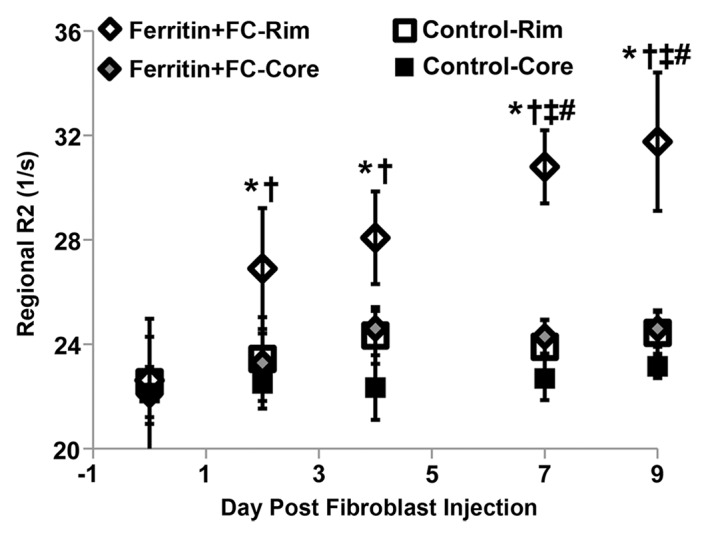
(a) Mean tumor R2 was similar in FHC-FC and control group tumors before and immediately after remote injection of fibroblasts. Mean R2 increased in FHC-FC tumors 4 days after remote injection of CV1-FHC fibroblasts and remained higher than that at baseline and in control tumors at all subsequent time points. (b) Mean regional R2 showed preferential recruitment of CV1-FHC fibroblasts to rim of tumors as early as 2 days after remote injection, with minor migration into core of tumor. (c) Representative R2 maps of midtumor sections acquired 7 days after remote administration of either CV1 or CV1-FHC fibroblasts show heightened R2 values along rim of FHC-FC tumors because of recruitment of CV1-FHC cells. (d) Gradient-echo axial scout images (echo time, 2.58 msec) show hypointensity along rim of FHC-FC tumors (red arrows) that are not present in control tumors. (e) In vivo fluorescence imaging confirmed colocalization of signal from cancer cells with signal from CV1 cells, confirming recruitment of remotely administered fibroblasts to tumors. * = P < .05 vs core, † = P < .05 vs control, ‡ = P < .05 vs day 0, # = P < .05 vs day 2 after injection.
Figure 5c:
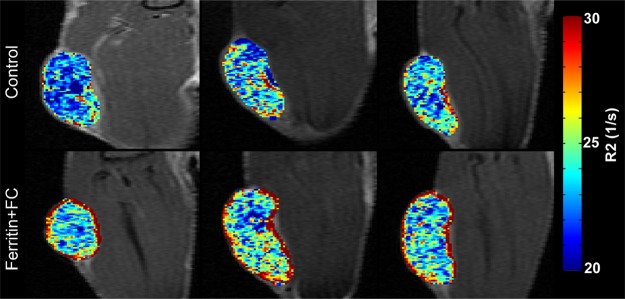
(a) Mean tumor R2 was similar in FHC-FC and control group tumors before and immediately after remote injection of fibroblasts. Mean R2 increased in FHC-FC tumors 4 days after remote injection of CV1-FHC fibroblasts and remained higher than that at baseline and in control tumors at all subsequent time points. (b) Mean regional R2 showed preferential recruitment of CV1-FHC fibroblasts to rim of tumors as early as 2 days after remote injection, with minor migration into core of tumor. (c) Representative R2 maps of midtumor sections acquired 7 days after remote administration of either CV1 or CV1-FHC fibroblasts show heightened R2 values along rim of FHC-FC tumors because of recruitment of CV1-FHC cells. (d) Gradient-echo axial scout images (echo time, 2.58 msec) show hypointensity along rim of FHC-FC tumors (red arrows) that are not present in control tumors. (e) In vivo fluorescence imaging confirmed colocalization of signal from cancer cells with signal from CV1 cells, confirming recruitment of remotely administered fibroblasts to tumors. * = P < .05 vs core, † = P < .05 vs control, ‡ = P < .05 vs day 0, # = P < .05 vs day 2 after injection.
Figure 5d:
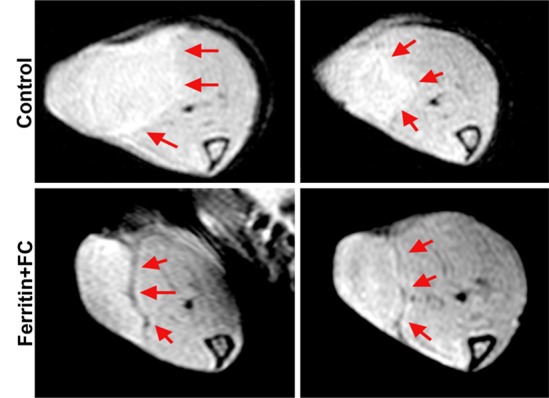
(a) Mean tumor R2 was similar in FHC-FC and control group tumors before and immediately after remote injection of fibroblasts. Mean R2 increased in FHC-FC tumors 4 days after remote injection of CV1-FHC fibroblasts and remained higher than that at baseline and in control tumors at all subsequent time points. (b) Mean regional R2 showed preferential recruitment of CV1-FHC fibroblasts to rim of tumors as early as 2 days after remote injection, with minor migration into core of tumor. (c) Representative R2 maps of midtumor sections acquired 7 days after remote administration of either CV1 or CV1-FHC fibroblasts show heightened R2 values along rim of FHC-FC tumors because of recruitment of CV1-FHC cells. (d) Gradient-echo axial scout images (echo time, 2.58 msec) show hypointensity along rim of FHC-FC tumors (red arrows) that are not present in control tumors. (e) In vivo fluorescence imaging confirmed colocalization of signal from cancer cells with signal from CV1 cells, confirming recruitment of remotely administered fibroblasts to tumors. * = P < .05 vs core, † = P < .05 vs control, ‡ = P < .05 vs day 0, # = P < .05 vs day 2 after injection.
Figure 5e:
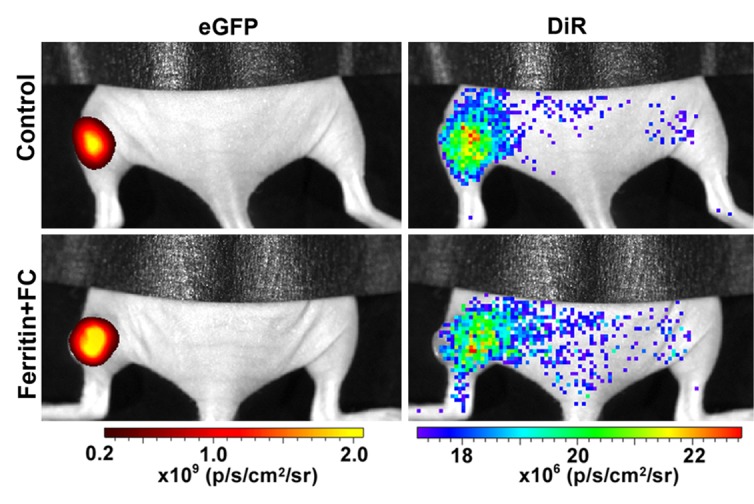
(a) Mean tumor R2 was similar in FHC-FC and control group tumors before and immediately after remote injection of fibroblasts. Mean R2 increased in FHC-FC tumors 4 days after remote injection of CV1-FHC fibroblasts and remained higher than that at baseline and in control tumors at all subsequent time points. (b) Mean regional R2 showed preferential recruitment of CV1-FHC fibroblasts to rim of tumors as early as 2 days after remote injection, with minor migration into core of tumor. (c) Representative R2 maps of midtumor sections acquired 7 days after remote administration of either CV1 or CV1-FHC fibroblasts show heightened R2 values along rim of FHC-FC tumors because of recruitment of CV1-FHC cells. (d) Gradient-echo axial scout images (echo time, 2.58 msec) show hypointensity along rim of FHC-FC tumors (red arrows) that are not present in control tumors. (e) In vivo fluorescence imaging confirmed colocalization of signal from cancer cells with signal from CV1 cells, confirming recruitment of remotely administered fibroblasts to tumors. * = P < .05 vs core, † = P < .05 vs control, ‡ = P < .05 vs day 0, # = P < .05 vs day 2 after injection.
Multiexponential MR Relaxometry Enables Measurement of CV1-FHC Cell Fraction
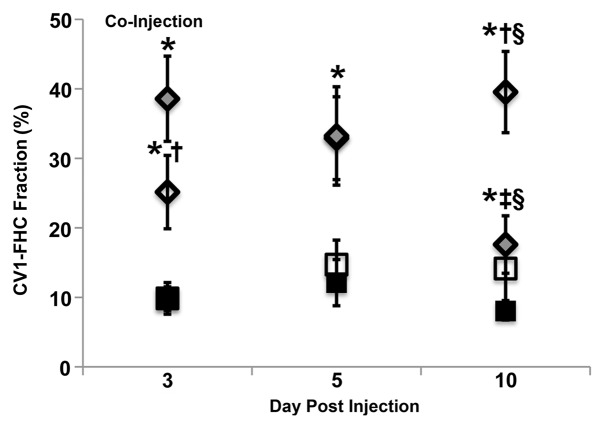
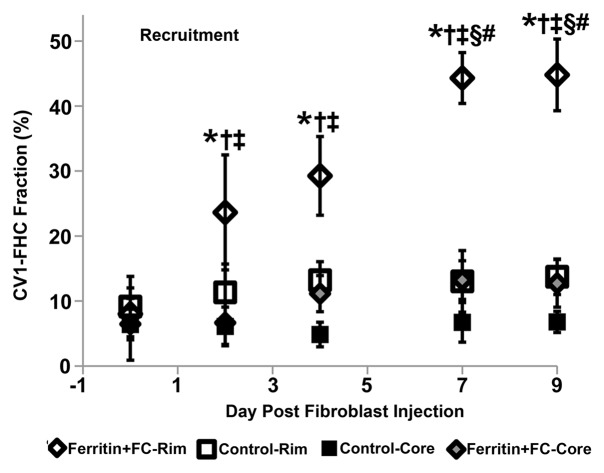
Multiexponential MR relaxometry was used to determine the weights of CV1-FHC and tumor mass components (Fig 6a). The relaxation rate of each component was quantified as R2f = 58.3 sec ± 0.3, and R2c = 23.5 sec ± 0.4, where R2f is the R2 of CV1-FHC-FC cells and R2c is the R2 of the tumor component. In coinjection experiments, the CV1-FHC cell fractions at the core and rim changed significantly during tumor growth (Fig 6b). In recruitment experiments, heightened CV1-FHC cell fraction was observed at the rim of FHC-FC tumors starting 2 days after remote injection of CV1-FHC cells, increasing further thereafter (Fig 6c). In FHC-FC tumors, the CV1-FHC fraction at the rim increased to similar steady-state values of 39.5% ± 5.9% and 44.8% ± 5.5% by the conclusion of coinjection and recruitment studies, respectively.
Figure 6a:
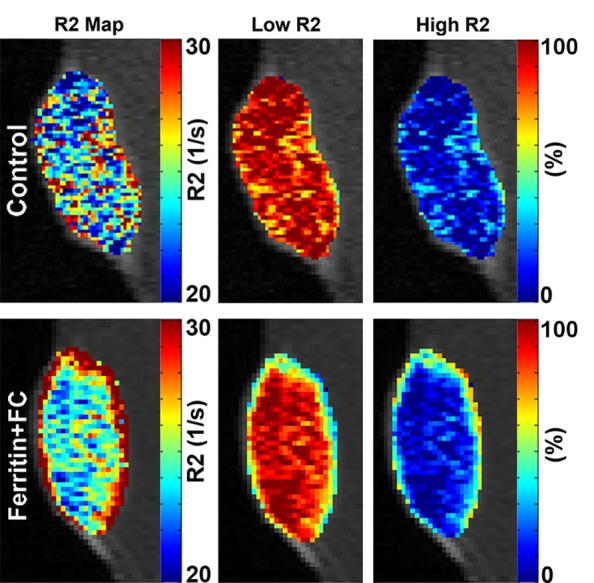
(a) Representative R2 maps generated by using monoexponential relaxation function show heightened R2 along rim of FHC-FC tumor. Tumor relaxation was modeled by using weighted biexponential function, where high R2 component represents CV1-FHC cells and low R2 component represents remaining tumor tissue. By fitting tumor relaxation waveforms for weights of each component, relative fraction of CV1-FHC cells and remaining tumor cells can be quantified as represented on high and low R2 fraction maps, respectively. (b) Mean CV1-FHC fraction (high R2 fraction) in coinjection studies shows core-to-rim migration of CV1-FHC in FHC-FC tumors. CV1-FHC fraction rose rapidly from day 3 to day 10 (at day 5, rim and core were identical) at rim of FHC-FC tumors, and fell rapidly during same period at core. * = P < .05 vs control, † = P < .05 vs core, ‡ = P < .05 vs day 5, § = P < .05 vs day 3. (c) Measurement of CV1-FHC fraction in recruitment studies revealed immediate recruitment of CV1-FHC cells to tumor rim, with continued accumulation of CV1-FHC cells up to 7 days after remote injection. * = P < .05 vs control, † = P < .05 vs core, ‡ = P < .05 vs day 0, § = P < .05 vs day 2, # = P < .05 vs day 4.
Figure 6b:
(a) Representative R2 maps generated by using monoexponential relaxation function show heightened R2 along rim of FHC-FC tumor. Tumor relaxation was modeled by using weighted biexponential function, where high R2 component represents CV1-FHC cells and low R2 component represents remaining tumor tissue. By fitting tumor relaxation waveforms for weights of each component, relative fraction of CV1-FHC cells and remaining tumor cells can be quantified as represented on high and low R2 fraction maps, respectively. (b) Mean CV1-FHC fraction (high R2 fraction) in coinjection studies shows core-to-rim migration of CV1-FHC in FHC-FC tumors. CV1-FHC fraction rose rapidly from day 3 to day 10 (at day 5, rim and core were identical) at rim of FHC-FC tumors, and fell rapidly during same period at core. * = P < .05 vs control, † = P < .05 vs core, ‡ = P < .05 vs day 5, § = P < .05 vs day 3. (c) Measurement of CV1-FHC fraction in recruitment studies revealed immediate recruitment of CV1-FHC cells to tumor rim, with continued accumulation of CV1-FHC cells up to 7 days after remote injection. * = P < .05 vs control, † = P < .05 vs core, ‡ = P < .05 vs day 0, § = P < .05 vs day 2, # = P < .05 vs day 4.
Figure 6c:
(a) Representative R2 maps generated by using monoexponential relaxation function show heightened R2 along rim of FHC-FC tumor. Tumor relaxation was modeled by using weighted biexponential function, where high R2 component represents CV1-FHC cells and low R2 component represents remaining tumor tissue. By fitting tumor relaxation waveforms for weights of each component, relative fraction of CV1-FHC cells and remaining tumor cells can be quantified as represented on high and low R2 fraction maps, respectively. (b) Mean CV1-FHC fraction (high R2 fraction) in coinjection studies shows core-to-rim migration of CV1-FHC in FHC-FC tumors. CV1-FHC fraction rose rapidly from day 3 to day 10 (at day 5, rim and core were identical) at rim of FHC-FC tumors, and fell rapidly during same period at core. * = P < .05 vs control, † = P < .05 vs core, ‡ = P < .05 vs day 5, § = P < .05 vs day 3. (c) Measurement of CV1-FHC fraction in recruitment studies revealed immediate recruitment of CV1-FHC cells to tumor rim, with continued accumulation of CV1-FHC cells up to 7 days after remote injection. * = P < .05 vs control, † = P < .05 vs core, ‡ = P < .05 vs day 0, § = P < .05 vs day 2, # = P < .05 vs day 4.
Immunohistochemical and Immunofluorescent Analysis Confirm MR Imaging Measurements
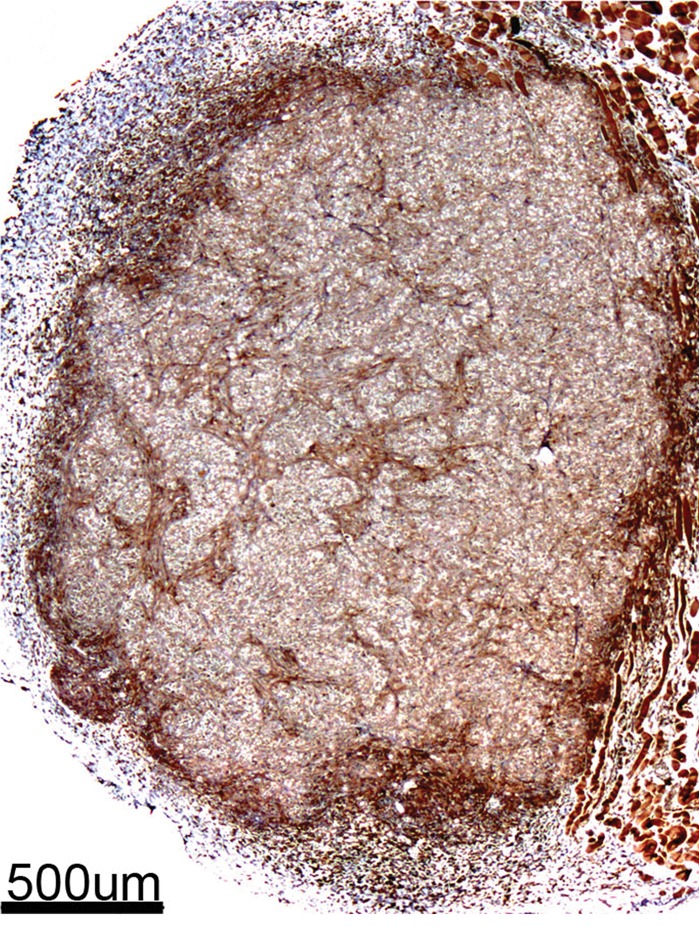
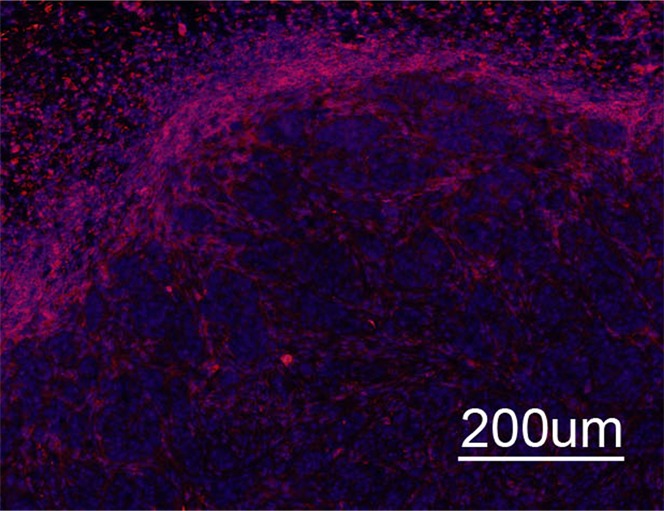
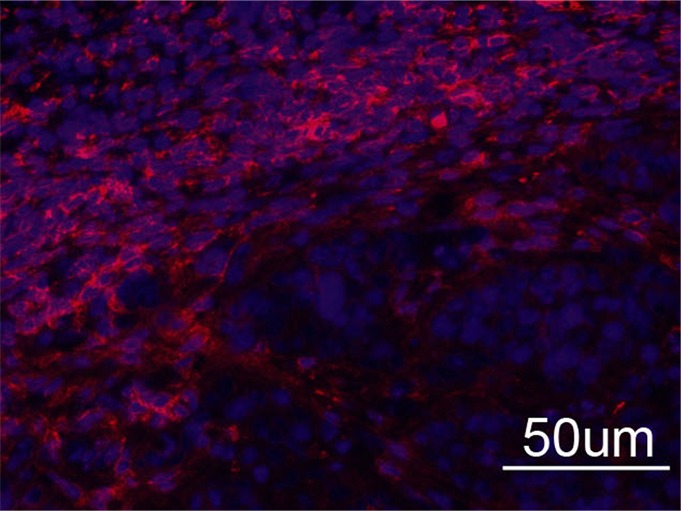
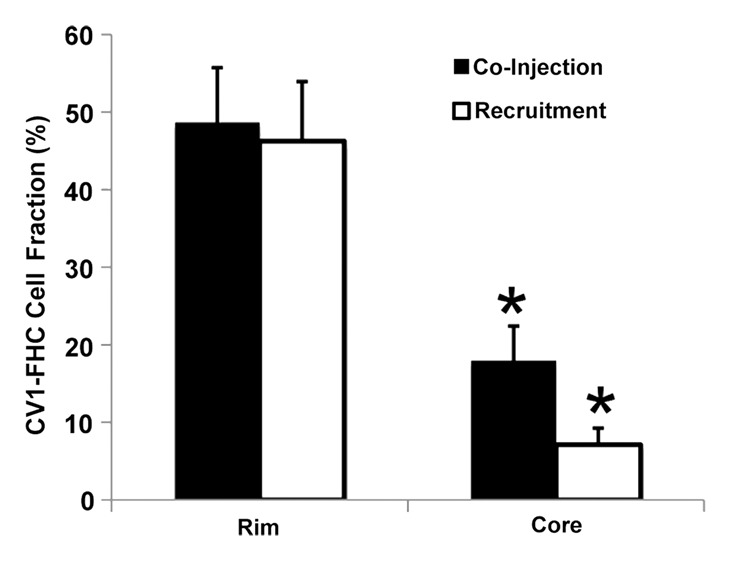
Immunohistochemical staining of FHC-FC tumors confirmed localization of CV1-FHC cells predominantly around the tumor rim, with some internal fenestrations (Fig 7a, 7b). The mean CV1-FHC cell fractions measured with quantitative immunofluorescent (Fig 7d, 7e) analysis corroborated those measured by means of MR imaging in FHC-FC tumors (Fig 7f).
Figure 7a:
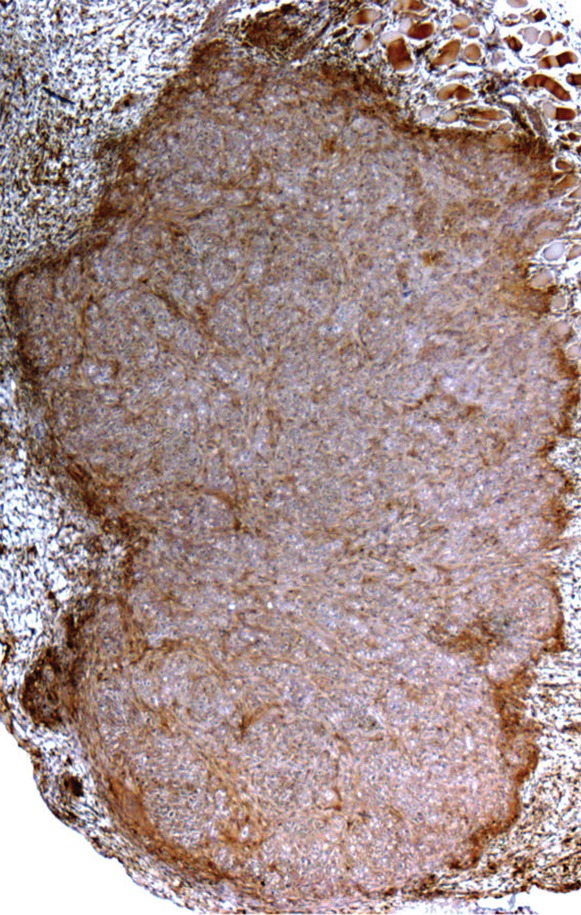
Immunohistochemical staining of isolated tissue sections from FHC-FC tumors at (a) day 10 (coinjection) and (b) day 13 (recruitment) shows significant recruitment of CV1-FHC cells to tumor rim in both models. (c) DAB staining at rim and core of control tumors was minimal, revealing more hematoxylin and eosin staining. Limited nonspecific staining of skin, muscle, and fat around tumor was seen in both FHC-FC and control tumors. (d) Representative immunofluorescent staining of FHC-FC tumors shows CV1-FHC cells in red and nuclei of all cells in blue. (e) Higher magnification of immunofluorescent images from region in rim reveals labeling of individual cells and enables quantitative measurement of CV1-FHC cell fraction in both tumor models. (f) Mean CV1-FHC cell fraction was similar at rims of FHC-FC tumors in coinjection and recruitment models (P = .6). At core, CV1-FHC cell fraction trended higher in coinjection than in recruitment tumors (P = .06). In both models, CV1-FHC cell fraction was significantly higher at rim than in core * = P < .01 vs rim, um = micrometer.
Figure 7b:
Immunohistochemical staining of isolated tissue sections from FHC-FC tumors at (a) day 10 (coinjection) and (b) day 13 (recruitment) shows significant recruitment of CV1-FHC cells to tumor rim in both models. (c) DAB staining at rim and core of control tumors was minimal, revealing more hematoxylin and eosin staining. Limited nonspecific staining of skin, muscle, and fat around tumor was seen in both FHC-FC and control tumors. (d) Representative immunofluorescent staining of FHC-FC tumors shows CV1-FHC cells in red and nuclei of all cells in blue. (e) Higher magnification of immunofluorescent images from region in rim reveals labeling of individual cells and enables quantitative measurement of CV1-FHC cell fraction in both tumor models. (f) Mean CV1-FHC cell fraction was similar at rims of FHC-FC tumors in coinjection and recruitment models (P = .6). At core, CV1-FHC cell fraction trended higher in coinjection than in recruitment tumors (P = .06). In both models, CV1-FHC cell fraction was significantly higher at rim than in core * = P < .01 vs rim, um = micrometer.
Figure 7d:
Immunohistochemical staining of isolated tissue sections from FHC-FC tumors at (a) day 10 (coinjection) and (b) day 13 (recruitment) shows significant recruitment of CV1-FHC cells to tumor rim in both models. (c) DAB staining at rim and core of control tumors was minimal, revealing more hematoxylin and eosin staining. Limited nonspecific staining of skin, muscle, and fat around tumor was seen in both FHC-FC and control tumors. (d) Representative immunofluorescent staining of FHC-FC tumors shows CV1-FHC cells in red and nuclei of all cells in blue. (e) Higher magnification of immunofluorescent images from region in rim reveals labeling of individual cells and enables quantitative measurement of CV1-FHC cell fraction in both tumor models. (f) Mean CV1-FHC cell fraction was similar at rims of FHC-FC tumors in coinjection and recruitment models (P = .6). At core, CV1-FHC cell fraction trended higher in coinjection than in recruitment tumors (P = .06). In both models, CV1-FHC cell fraction was significantly higher at rim than in core * = P < .01 vs rim, um = micrometer.
Figure 7e:
Immunohistochemical staining of isolated tissue sections from FHC-FC tumors at (a) day 10 (coinjection) and (b) day 13 (recruitment) shows significant recruitment of CV1-FHC cells to tumor rim in both models. (c) DAB staining at rim and core of control tumors was minimal, revealing more hematoxylin and eosin staining. Limited nonspecific staining of skin, muscle, and fat around tumor was seen in both FHC-FC and control tumors. (d) Representative immunofluorescent staining of FHC-FC tumors shows CV1-FHC cells in red and nuclei of all cells in blue. (e) Higher magnification of immunofluorescent images from region in rim reveals labeling of individual cells and enables quantitative measurement of CV1-FHC cell fraction in both tumor models. (f) Mean CV1-FHC cell fraction was similar at rims of FHC-FC tumors in coinjection and recruitment models (P = .6). At core, CV1-FHC cell fraction trended higher in coinjection than in recruitment tumors (P = .06). In both models, CV1-FHC cell fraction was significantly higher at rim than in core * = P < .01 vs rim, um = micrometer.
Figure 7f:
Immunohistochemical staining of isolated tissue sections from FHC-FC tumors at (a) day 10 (coinjection) and (b) day 13 (recruitment) shows significant recruitment of CV1-FHC cells to tumor rim in both models. (c) DAB staining at rim and core of control tumors was minimal, revealing more hematoxylin and eosin staining. Limited nonspecific staining of skin, muscle, and fat around tumor was seen in both FHC-FC and control tumors. (d) Representative immunofluorescent staining of FHC-FC tumors shows CV1-FHC cells in red and nuclei of all cells in blue. (e) Higher magnification of immunofluorescent images from region in rim reveals labeling of individual cells and enables quantitative measurement of CV1-FHC cell fraction in both tumor models. (f) Mean CV1-FHC cell fraction was similar at rims of FHC-FC tumors in coinjection and recruitment models (P = .6). At core, CV1-FHC cell fraction trended higher in coinjection than in recruitment tumors (P = .06). In both models, CV1-FHC cell fraction was significantly higher at rim than in core * = P < .01 vs rim, um = micrometer.
Figure 7c:
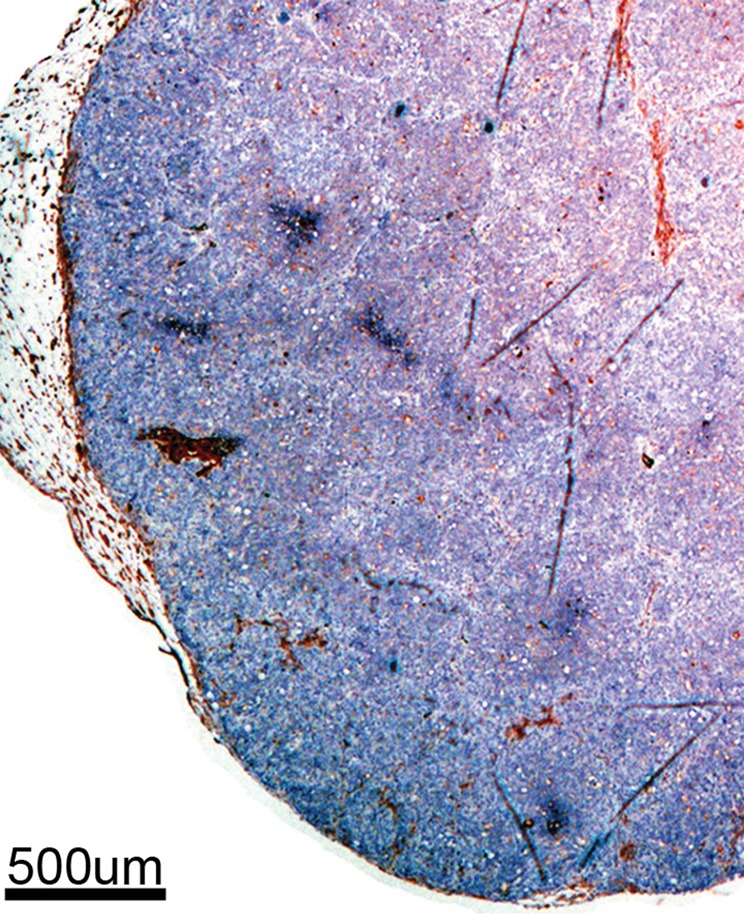
Immunohistochemical staining of isolated tissue sections from FHC-FC tumors at (a) day 10 (coinjection) and (b) day 13 (recruitment) shows significant recruitment of CV1-FHC cells to tumor rim in both models. (c) DAB staining at rim and core of control tumors was minimal, revealing more hematoxylin and eosin staining. Limited nonspecific staining of skin, muscle, and fat around tumor was seen in both FHC-FC and control tumors. (d) Representative immunofluorescent staining of FHC-FC tumors shows CV1-FHC cells in red and nuclei of all cells in blue. (e) Higher magnification of immunofluorescent images from region in rim reveals labeling of individual cells and enables quantitative measurement of CV1-FHC cell fraction in both tumor models. (f) Mean CV1-FHC cell fraction was similar at rims of FHC-FC tumors in coinjection and recruitment models (P = .6). At core, CV1-FHC cell fraction trended higher in coinjection than in recruitment tumors (P = .06). In both models, CV1-FHC cell fraction was significantly higher at rim than in core * = P < .01 vs rim, um = micrometer.
Discussion
The recruitment of fibroblasts from remote tissues is essential to tumor growth and metastasis, and the tracking of this fibroblast migration is emerging as a potential avenue for targeted therapy. The major findings of this study were (a) FHC is a suitable MR imaging reporter gene for longitudinal tracking of fibroblast migration in a maturing tumor, (b) When exposed to FC-supplemented medium before injection, FHC overexpressing cells produce sufficient contrast on MR images to enable detection of remotely administered cells to a solid tumor, and (c) Use of biexponential MR relaxometry enables in vivo assessment of the FHC-expressing cell fraction in a mixed-cell population.
Recent studies of ferritin overexpression as an MR imaging reporter gene of cell survival have demonstrated promising results when cells were nonmigratory and present at high densities (15,22–24,28). Our in vitro studies revealed that FHC overexpression in CV1 fibroblasts significantly enhanced iron uptake and retention, resulting in detectable R2 contrast even at lower cell density. The capacity to generate in vivo R2 contrast on the basis of this mechanism was confirmed by means of coinjection of cancer cells with CV1-FHC cells. In FHC-FC tumors, elevated mean tumor R2 persisted despite growth-mediated dilutions in CV1-FHC cell density. In FHC tumors, CV1-FHC cells accumulated sufficient iron to heighten R2 within 10 days, which was in agreement with data from prior studies (15,21,24). Finally, correlation of R2 and fBV illuminated the vascular niche to which CV1-FHC fibroblasts preferentially migrated.
In a prior study by Granot et al (25), T2*-weighted MR imaging showed the recruitment of ferridex-labeled CV1 fibroblasts to the rim of ovarian tumors. In our study, T2*-weighted MR imaging revealed signal intensity loss around the rim of FHC-FC tumors consistent with that generated by migrating FHC- overexpressing neural precursor cells in a recent study by Iordanova et al (21). T2*-weighted imaging only confirms the presence of recruited cells, but R2 mapping revealed the spatiotemporal kinetics of recruitment even at low cell densities early after remote fibroblast administration. This finding suggests that MR imaging cell tracking of FHC overexpressing cells would be feasible even in models where cell density is a limiting factor.
Biexponential modeling of tissue relaxation is an established method to estimate pathologic tissue iron content (29,30). We used a priori knowledge of the R2 of the CV1-FHC-FC cells and the R2 of the tumor component in conjunction with biexponential relaxometry to measure CV1-FHC cell fraction in solid tumors. Our method for estimating the R2 of CV1-FHC-FC cells was an attempt to account for continued CV1-FHC division and subsequent iron uptake after injection. In both tumor models, the peak CV1-FHC fraction at the rim of FHC-FC tumors was approximately 40%, which was in close agreement with quantitative immunofluorescent analysis. Compared with conventional methods of reporting the relative presence of reporter gene expressing cells, measurement of CV1-FHC cell fraction can illuminate the fraction of reporter gene expressing cells in a mixed-cell population. With the emerging view of cancer-associated fibroblasts as potential therapeutic vehicles and targets (4,31,32), a method to correlate the density of FHC-expressing fibroblasts with MR imaging measurements of therapeutic outcome (eg, fBV, fibrosis) could be valuable for evaluating and refining such therapies.
One limitation to our study was that, because of rapid tumor growth, we limited the experimental time course to 10–13 days. It is possible that with an extended experimental time course, as in prior studies (15,24), CV1-FHC cells in FHC tumors would have accumulated greater amounts of iron and generated even stronger R2 contrast. However, we observed regional necrosis starting at day 14 that would obfuscate accurate R2 measurement. A CV1-FHC fraction of approximately 10% was observed at the rim of control tumors in both protocols, possibly reflecting the effect of fibrosis. In addition, through its role in limiting the Fenton reaction, FHC overexpression may alter processes involved in tumor growth and metastasis. However, we found that FHC overexpression altered neither fBV in our coinjection protocol, nor tumor growth rates in both protocols. Also, the recruitment time course of CV1-FHC cells was similar to that of Granot et al (25), suggesting that FHC overexpression does not affect important aspects of cell motility. Finally, in the current study, a strong signal was generated by the high density of FHC-overexpressing fibroblasts at the rims of tumors. The signal generated by FHC overexpression varies among tumor types on the basis of the variable density of FHC overexpressing cells. However, the typical organization of highly desmoplastic cancers such as ovarian carcinoma shows clear association of the vasculature to the stromal fibrotic areas and the tumor-associated fibroblasts. Thus, the association appears to be a typical feature of the tumor microenvironment.
In conclusion, FHC overexpression in combination with R2 mapping enables quantitative in vivo examination of cell recruitment, and when combined with biexponential MR relaxometry, enables in vivo measurement of reporter gene expressing cell fraction in a mixed cell population.
Practical application.—This method may be used to study cell migration and recruitment in a variety of preclinical disease models. Our results further present several translational advantages of FHC overexpression. First, in juxtaposition to iron oxide nano-particles, the modest T2*-contrast generated by FHC overexpression preserves the image integrity of surrounding anatomy. In addition, compared with conventional cell labeling in which time-dependent dilution of contrast agents erodes the detection of labeled cells (9), FHC overexpression remains consistent throughout cell divisions with proper gene transfer techniques. Subsequently, despite cell division, the contrast generated by overexpressed FHC can be detected at steady state even in the absence of iron preconditioning (15,16,23,24). Finally, the iron accumulation period for FHC overexpressing cells falls well within the time between typical clinical visits. This suggests that FHC overexpressing cells could be administered to patients without exposure to FC-supplemented medium.
Advances in Knowledge.
• The overexpression of human ferritin heavy chain when used as an MR imaging reporter gene, enables quantitative tracking of the recruitment of transgenic fibroblasts to human ovarian tumors.
• Ferritin heavy chain–overexpressing fibroblasts can be detected through R2 mapping at a considerably lower cell density than was previously believed (2.5 × 10⁶ cells per milliliter).
• Use of biexponential MR imaging relaxometry enables quantification of the fraction of reporter gene–expressing cells in a mixed-cell population at high spatial resolution, and is supported by conventional histologic examination results.
• Correlation of R2 and fractional blood volume reveals the preferential recruitment of fibroblasts to a vascular niche in the stroma.
• The ability to generate detectable contrast without obfuscating surrounding anatomy on MR images could be useful for image-guided cellular and surgical therapy.
Disclosures of Conflicts of Interest: M.H.V. Financial activities related to the present article: supported by a Whitaker International Fellowship Financial activities not related to the present article: none to disclose. Other relationships: none to disclose. M.R. No relevant conflicts of interest to disclose. Y.A. No relevant conflicts of interest to disclose. S.M. No relevant conflicts of interest to disclose. B.C. No relevant conflicts of interest to disclose. R.E. No relevant conflicts of interest to disclose. M.N. No relevant conflicts of interest to disclose.
Supplementary Material
Acknowledgments
The authors thank Drs Tal Raz, Katrien Vandoorne, and Nava Nevo for assistance in animal preparation. Eldar Zohari, and Neta Strasser contributed to immunohistochemical work.
Received September 22, 2012; revision requested November 19; revision received January 21, 2013; accepted February 6; final version accepted February 19.
The research was supported by the European Research Council Advanced grant 232640-IMAGO, by the European Commission 7th Framework Integrated Project ENCITE.
Funding: This research was supported by the National Institutes of Health (grant R01 CA75334).
See also Science to Practice in this issue.
Abbreviations:
- CV1
- monkey kidney cell line
- DMEM
- Dulbeco’s modified eagle’s medium
- eGFP
- enhanced green fluorescent protein
- fBV
- fractional blood volume
- FC
- ferric citrate
- FHC
- ferritin heavy chain
References
- 1.Hanahan D, Weinberg RA. Hallmarks of cancer: the next generation. Cell 2011;144(5):646–674 [DOI] [PubMed] [Google Scholar]
- 2.Kidd S, Spaeth E, Watson K, et al. Origins of the tumor microenvironment: quantitative assessment of adipose-derived and bone marrow-derived stroma. PLoS ONE 2012;7(2):e30563. [DOI] [PMC free article] [PubMed] [Google Scholar]
- 3.Cai J, Tang H, Xu L, et al. Fibroblasts in omentum activated by tumor cells promote ovarian cancer growth, adhesion and invasiveness. Carcinogenesis 2012;33(1):20–29 [DOI] [PubMed] [Google Scholar]
- 4.Cirri P, Chiarugi P. Cancer-associated-fibroblasts and tumour cells: a diabolic liaison driving cancer progression. Cancer Metastasis Rev 2012;31(1-2):195–208 [DOI] [PubMed] [Google Scholar]
- 5.Sherman EJ, Lim SH, Ho AL, et al. Concurrent doxorubicin and radiotherapy for anaplastic thyroid cancer: a critical re-evaluation including uniform pathologic review. Radiother Oncol 2011;101(3):425–430 [DOI] [PubMed] [Google Scholar]
- 6.Schmitt J, Matei D. Targeting angiogenesis in ovarian cancer. Cancer Treat Rev 2012;38(4):272–283 [DOI] [PubMed] [Google Scholar]
- 7.Shapiro EM, Skrtic S, Koretsky AP. Sizing it up: cellular MRI using micron-sized iron oxide particles. Magn Reson Med 2005;53(2):329–338 [DOI] [PubMed] [Google Scholar]
- 8.Cromer Berman SM, Walczak P, Bulte JW. Tracking stem cells using magnetic nanoparticles. Wiley Interdiscip Rev Nanomed Nanobiotechnol 2011;3(4):343–355 [DOI] [PMC free article] [PubMed] [Google Scholar]
- 9.Cromer Berman SM, Kshitiz WangCJ, et al. Cell motility of neural stem cells is reduced after SPIO-labeling, which is mitigated after exocytosis. Magn Reson Med 2013;69(1):255–262 [DOI] [PMC free article] [PubMed] [Google Scholar]
- 10.Bhagavathula N, Dame MK, DaSilva M, et al. Fibroblast response to gadolinium: role for platelet-derived growth factor receptor. Invest Radiol 2010;45(12):769–777 [DOI] [PMC free article] [PubMed] [Google Scholar]
- 11.Winter EM, Hogers B, van der Graaf LM, Gittenberger-de Groot AC, Poelmann RE, van der Weerd L. Cell tracking using iron oxide fails to distinguish dead from living transplanted cells in the infarcted heart. Magn Reson Med 2010;63(3):817–821 [DOI] [PubMed] [Google Scholar]
- 12.Gilad AA, Winnard PT, Jr, van Zijl PC, Bulte JW. Developing MR reporter genes: promises and pitfalls. NMR Biomed 2007;20(3):275–290 [DOI] [PubMed] [Google Scholar]
- 13.Gilad AA, Ziv K, McMahon MT, van Zijl PC, Neeman M, Bulte JW. MRI reporter genes. J Nucl Med 2008;49(12):1905–1908 [DOI] [PMC free article] [PubMed] [Google Scholar]
- 14.Koretsky A, Lin Y, Schorle H, Jaenisch R. Genetic control of MRI contrast by expression of the transferrin receptor [abstr]. In: Proceedings of the Fourth Meeting of the International Society for Magnetic Resonance in Medicine. Berkeley, Calif: International Society for Magnetic Resonance in Medicine, April 27–May 3, 1996; New York, NY [Google Scholar]
- 15.Cohen B, Dafni H, Meir G, Harmelin A, Neeman M. Ferritin as an endogenous MRI reporter for noninvasive imaging of gene expression in C6 glioma tumors. Neoplasia 2005;7(2):109–117 [DOI] [PMC free article] [PubMed] [Google Scholar]
- 16.Cohen B, Ziv K, Plaks V, et al. MRI detection of transcriptional regulation of gene expression in transgenic mice. Nat Med 2007;13(4):498–503 [DOI] [PubMed] [Google Scholar]
- 17.Vande Velde G, Rangarajan JR, Toelen J, et al. Evaluation of the specificity and sensitivity of ferritin as an MRI reporter gene in the mouse brain using lentiviral and adeno-associated viral vectors. Gene Ther 2011;18(6):594–605 [DOI] [PubMed] [Google Scholar]
- 18.Vande Velde G, Raman Rangarajan J, Vreys R, et al. Quantitative evaluation of MRI-based tracking of ferritin-labeled endogenous neural stem cell progeny in rodent brain. Neuroimage 2012;62(1):367–380 [DOI] [PubMed] [Google Scholar]
- 19.Iordanova B, Robison CS, Goins WF, Ahrens ET. Single chain ferritin chimera as an improved MRI gene reporter. Prilozi 2010;31(2):151–155 [PMC free article] [PubMed] [Google Scholar]
- 20.Iordanova B, Robison CS, Ahrens ET. Design and characterization of a chimeric ferritin with enhanced iron loading and transverse NMR relaxation rate. J Biol Inorg Chem 2010;15(6):957–965 [DOI] [PMC free article] [PubMed] [Google Scholar]
- 21.Iordanova B, Ahrens ET. In vivo magnetic resonance imaging of ferritin-based reporter visualizes native neuroblast migration. Neuroimage 2012;59(2):1004–1012 [DOI] [PMC free article] [PubMed] [Google Scholar]
- 22.Ziv K, Meir G, Harmelin A, Shimoni E, Klein E, Neeman M. Ferritin as a reporter gene for MRI: chronic liver over expression of H-ferritin during dietary iron supplementation and aging. NMR Biomed 2010;23(5):523–531 [DOI] [PMC free article] [PubMed] [Google Scholar]
- 23.Campan M, Lionetti V, Aquaro GD, et al. Ferritin as a reporter gene for in vivo tracking of stem cells by 1.5-T cardiac MRI in a rat model of myocardial infarction. Am J Physiol Heart Circ Physiol 2011;300(6):H2238–H2250 [DOI] [PubMed] [Google Scholar]
- 24.Naumova AV, Reinecke H, Yarnykh V, Deem J, Yuan C, Murry CE. Ferritin overexpression for noninvasive magnetic resonance imaging-based tracking of stem cells transplanted into the heart. Mol Imaging 2010;9(4):201–210 [PMC free article] [PubMed] [Google Scholar]
- 25.Granot D, Addadi Y, Kalchenko V, Harmelin A, Kunz-Schughart LA, Neeman M. In vivo imaging of the systemic recruitment of fibroblasts to the angiogenic rim of ovarian carcinoma tumors. Cancer Res 2007;67(19):9180–9189 [DOI] [PMC free article] [PubMed] [Google Scholar]
- 26.Dafni H, Gilead A, Nevo N, Eilam R, Harmelin A, Neeman M. Modulation of the pharmacokinetics of macromolecular contrast material by avidin chase: MRI, optical, and inductively coupled plasma mass spectrometry tracking of triply labeled albumin. Magn Reson Med 2003;50(5):904–914 [DOI] [PubMed] [Google Scholar]
- 27.Dafni H, Landsman L, Schechter B, Kohen F, Neeman M. MRI and fluorescence microscopy of the acute vascular response to VEGF165: vasodilation, hyper-permeability and lymphatic uptake, followed by rapid inactivation of the growth factor. NMR Biomed 2002;15(2):120–131 [DOI] [PubMed] [Google Scholar]
- 28.Naumova AV, Yarnykh VL, Balu N, Reinecke H, Murry CE, Yuan C. Quantification of MRI signal of transgenic grafts overexpressing ferritin in murine myocardial infarcts. NMR Biomed 2012;25(10):1187–1195 [DOI] [PMC free article] [PubMed] [Google Scholar]
- 29.He T, Gatehouse PD, Smith GC, Mohiaddin RH, Pennell DJ, Firmin DN. Myocardial T2* measurements in iron-overloaded thalassemia: An in vivo study to investigate optimal methods of quantification. Magn Reson Med 2008;60(5):1082–1089 [DOI] [PMC free article] [PubMed] [Google Scholar]
- 30.Ababneh Z, Beloeil H, Berde CB, Gambarota G, Maier SE, Mulkern RV. Biexponential parameterization of diffusion and T2 relaxation decay curves in a rat muscle edema model: decay curve components and water compartments. Magn Reson Med 2005;54(3):524–531 [DOI] [PubMed] [Google Scholar]
- 31.Loeffler M, Krüger JA, Niethammer AG, Reisfeld RA. Targeting tumor-associated fibroblasts improves cancer chemotherapy by increasing intratumoral drug uptake. J Clin Invest 2006;116(7):1955–1962 [DOI] [PMC free article] [PubMed] [Google Scholar]
- 32.Brennen WN, Isaacs JT, Denmeade SR. Rationale behind targeting fibroblast activation protein-expressing carcinoma-associated fibroblasts as a novel chemotherapeutic strategy. Mol Cancer Ther 2012;11(2):257–266 [DOI] [PMC free article] [PubMed] [Google Scholar]
Associated Data
This section collects any data citations, data availability statements, or supplementary materials included in this article.


