Abstract
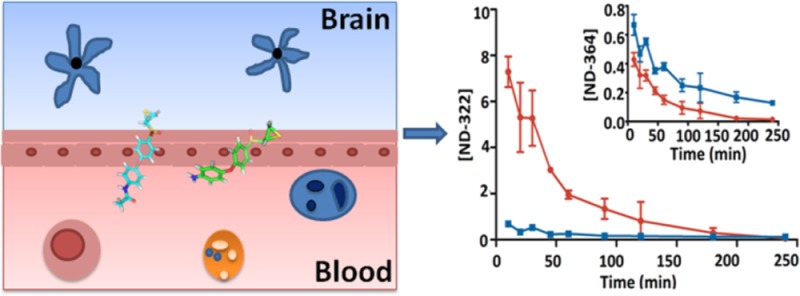
MMP-9 plays a detrimental role in the pathology of several neurological diseases and, thus, represents an important target for intervention. The water-soluble prodrug ND-478 is hydrolyzed to the active MMP-9 inhibitor ND-322, which in turn is N-acetylated to the even more potent metabolite ND-364. We used a sensitive bioanalytical method based on ultraperformance liquid chromatography with multiple-reaction monitoring detection to measure levels of ND-478, ND-322, and ND-364 in plasma and brain after administration of ND-478 and the metabolites. ND-478 did not cross the blood–brain barrier, as was expected; however the active metabolites ND-322 and ND-364 distributed to the brain. The active compound after administration of either ND-478 or ND-322 is likely ND-364. ND-322 is N-acetylated in both brain and liver, but it is so metabolized preferentially in liver. Since N-acetyltransferases involved in the metabolism of ND-322 to ND-364 are polymorphic, direct administration of the N-acetylated ND-364 would achieve the requisite therapeutic levels in the brain.
Keywords: MMP-9 inhibitor, blood−brain barrier, N-acetyltransferase
Matrix metalloproteinases (MMPs) are a family of 26 zinc-dependent proteinases that function in restructuring of the extracellular matrix. These enzymes play a role in the structural development and maintenance of the nervous system.1 MMPs also play detrimental roles in the pathogenesis of nervous system diseases. In particular, MMP-9 has a deleterious role in traumatic brain injury,2 stroke,3 spinal cord injury,4 Alzheimer’s disease,5 and multiple sclerosis.6 MMP-9 has been shown to degrade the basement membrane and tight junction, resulting in breakdown of the blood–brain barrier (BBB) via the apolipoprotein E–cyclophilin A–nuclear factor-κB (NF-κB) pathway.7 Once the BBB is damaged, inflammatory cells and fluid enter the brain, resulting in edema and apoptosis. In addition, MMP-9 activates transforming growth factor β (TGFβ), which promotes neuronal apoptosis.8 While acute broad-spectrum MMP inhibition reduces infarct volume, delayed MMP inhibition is not neuroprotective,9 suggesting that MMPs may play beneficial roles and mediate remodeling during stroke recovery. Thus, inhibition of MMP-9 provides a therapeutic strategy for intervention in many neurological disorders.
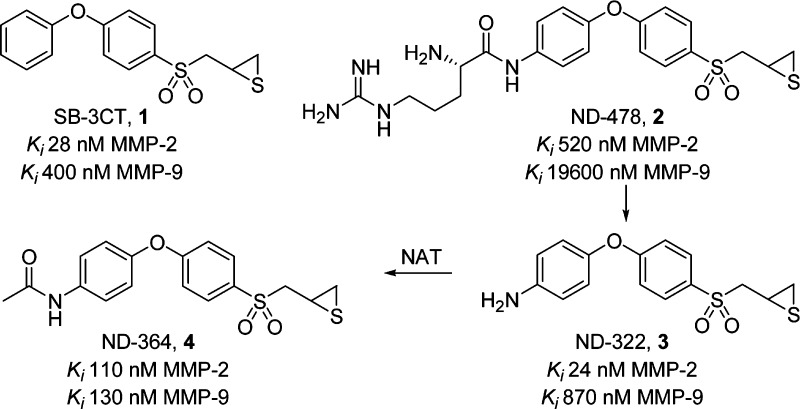
Our laboratories have worked over the years on the syntheses and evaluation of selective gelatinase (MMP-2 and MMP-9) inhibitors. The prototype inhibitor SB-3CT (1, Figure 1)10 shows efficacy in animal models of stroke,11,12 subarachnoid hemorrhage,13,14 and spinal cord injury.15,16 Extended treatment with SB-3CT after embolic ischemia was neuroprotective,12 suggesting that MMP-9 was not involved in the repair phase after ischemia. SB-3CT readily crosses the BBB.17 However, the compound is poorly water-soluble18 and cannot be administered intravenously, the preferred route of administration for the treatment of acute neurological conditions. Moreover, SB-3CT is metabolized by oxidation at the para-position of the terminal phenyl ring to a more potent inhibitor and by oxidation at the α-position to the sulfonyl to form the inactive sulfinic acid.19 We blocked metabolism at the para-position and used a prodrug strategy to achieve >5000-fold increased solubility.20 The prodrug (ND-478, 2, Figure 1) is quantitatively hydrolyzed in human blood to the potent gelatinase inhibitor ND-322 (3), which is further metabolized to the N-acetylated ND-364 (4), an even more potent gelatinase inhibitor.20 While SB-3CT, ND-322, and ND-364 inhibit both MMP-2 and MMP-9, MMP-2 does not contribute to tissue damage after stroke.21
Figure 1.
Structures and Ki values for MMP-9 of SB-3CT (1), the prodrug ND-478 (2), and its active metabolites ND-322 (3) and ND-364 (4).
In the present report, we investigated whether ND-478 and its active metabolites ND-322 and ND-364 cross the BBB and compared the brain levels of ND-322 and ND-364 generated from the prodrug to those after administration of the metabolites themselves.
N-Acetyltransferases (NAT) catalyze the transfer of an acetyl group from acetyl-CoA to an amine group and are polymorphic drug-metabolizing enzymes, causing variation in drug metabolism among various individuals.22 Since significant NAT activity is found extrahepatically,23 including in the brain, we also investigated the metabolism of ND-322 and ND-364 in brain and liver S9.
After a 30-min intravenous (iv) infusion of ND-478, ND-478 was rapidly hydrolyzed to ND-322, which in turn was metabolized to ND-364. ND-478 was given iv because this is the intended route of administration in humans. Systemic exposures (as measured by AUC0–∞) were 166, 429, and 16.5 μM·min for ND-478, ND-322, and ND-364, respectively (Table 1), indicating that the major compound in circulation was ND-322. ND-478 was not observed in brain (Figure 2a). Levels of ND-322 were significantly lower in brain than in plasma, reaching a maximum at the end of the infusion (0.301 pmol/mg tissue, equivalent to 0.301 μM, assuming a density of 1 g/mL, Table S1 in the Supporting Information) and were not quantifiable at 20 min after the end of infusion (Figure 2b). Brain AUC0–last of ND-322 was 4.76 pmol·min/mg and accounted for 1% of the systemic exposure in plasma. Brain levels of ND-322 were below the Ki for MMP-9 of 0.870 μM at all times. In contrast, levels of ND-364 were significantly higher in brain than in plasma (Figure 2c). Brain levels of ND-364 were 2.17 pmol/mg at the end of the infusion and decreased to 0.0368 ± 0.00601 pmol/mg at 45 min. Levels of ND-364 in brain were higher than the Ki for MMP-9 of 0.130 μM for 30 min. However, both ND-322 and ND-364 are slow-binding inhibitors;20,24 that is, when they inhibit the target enzyme, the reversal of the process is difficult. Brain AUC0–last for ND-364 was 78.0 pmol·min/mg, with a ratio of brain to plasma AUC0–last of 5.31. The data indicate that both ND-322 and ND-364 cross the BBB, but that the active species after an iv infusion of ND-478 is likely to be ND-364.
Table 1. Pharmacokinetic Parameters of ND-478, ND-322, and ND-364 after a 30-min iv Infusion of ND-478 to Mice.
| ND-478 |
ND-322 |
ND-364 |
||||
|---|---|---|---|---|---|---|
| parameter | brain | plasma | brain | plasma | brain | plasma |
| AUC0–lasta | b | 163 | 4.76 | 421 | 78.0 | 14.7 |
| AUC0–∞a | b | 166 | c | 429 | 78.4 | 16.5 |
| t1/2α (min) | 2.7 | 2.9 | 5.8 | 8.6 | 15.0 | |
| t1/2β (min) | 68 | c | 110 | 6.7 | 147 | |
| brainAUC/plasmaAUC | c | 0.0113 | 5.31 | |||
AUC in pmol·min/mg for brain and in μM·min for plasma.
Not quantifiable.
Not calculated; low levels did not allow calculation of terminal half-life and AUClast–∞.
Figure 2.
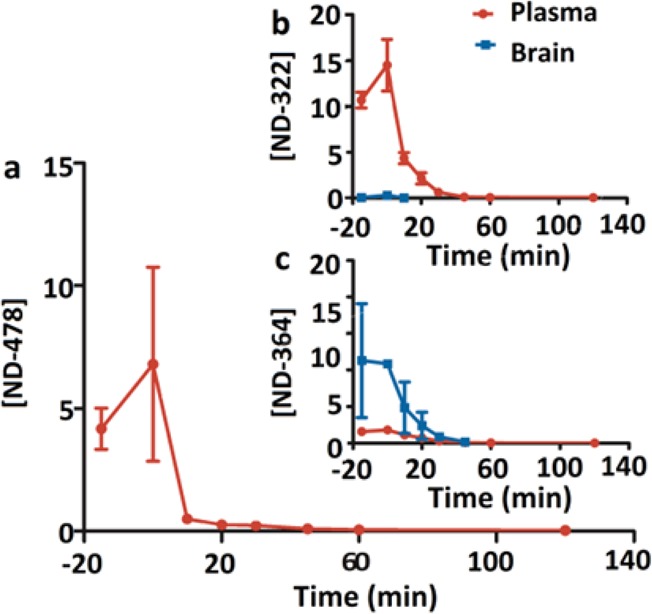
Brain and plasma concentration–time curves of (a) ND-478, (b) ND-322, and (c) ND-364 after a 30-min iv infusion of ND-478 to mice. Concentrations are given in pmol/mg tissue for brain and in μM for plasma.
Subsequently, we investigated the pharmacokinetics and brain distribution after a single subcutaneous (sc) dose of ND-322 or ND-364 to mice. We used the sc route of administration because efficacy studies in a mouse model of traumatic brain injury are conducted after administration of an iv infusion of ND-478, followed by sc doses of ND-322 or ND-364, since MMP-9 levels are upregulated for up to 1 week after controlled cortical impact in mice.2 Due to the technical challenge of multiple-dose iv administration, we administer ND-478 as an iv infusion, followed by multiple sc doses of ND-322. After dosing of ND-322, concentrations of ND-322 in brain were lower than in plasma (Figure 3a and Table S2 in the Supporting Information). AUC0–last was 49.2 pmol·min/mg in brain and 377 μM·min in plasma, for a brain to plasma AUC ratio of 0.131, indicating that ND-322 crosses the BBB. Levels of ND-322 in brain were below the Ki for MMP-9 of 0.870 μM. In contrast, levels of ND-364 after a dose of ND-322 were higher in brain than in plasma (Figure 3a, inset), with AUC0–last 2.5-fold higher (Table 2). The brain to plasma AUC ratio was 2.47 and showed that ND-364 crossed the BBB. Levels of ND-364 in brain were above the Ki for MMP-9 of 0.130 μM up to 4 h (Table S2 in the Supporting Information). Thus, the active compound after dosing of ND-322 is ND-364.
Figure 3.
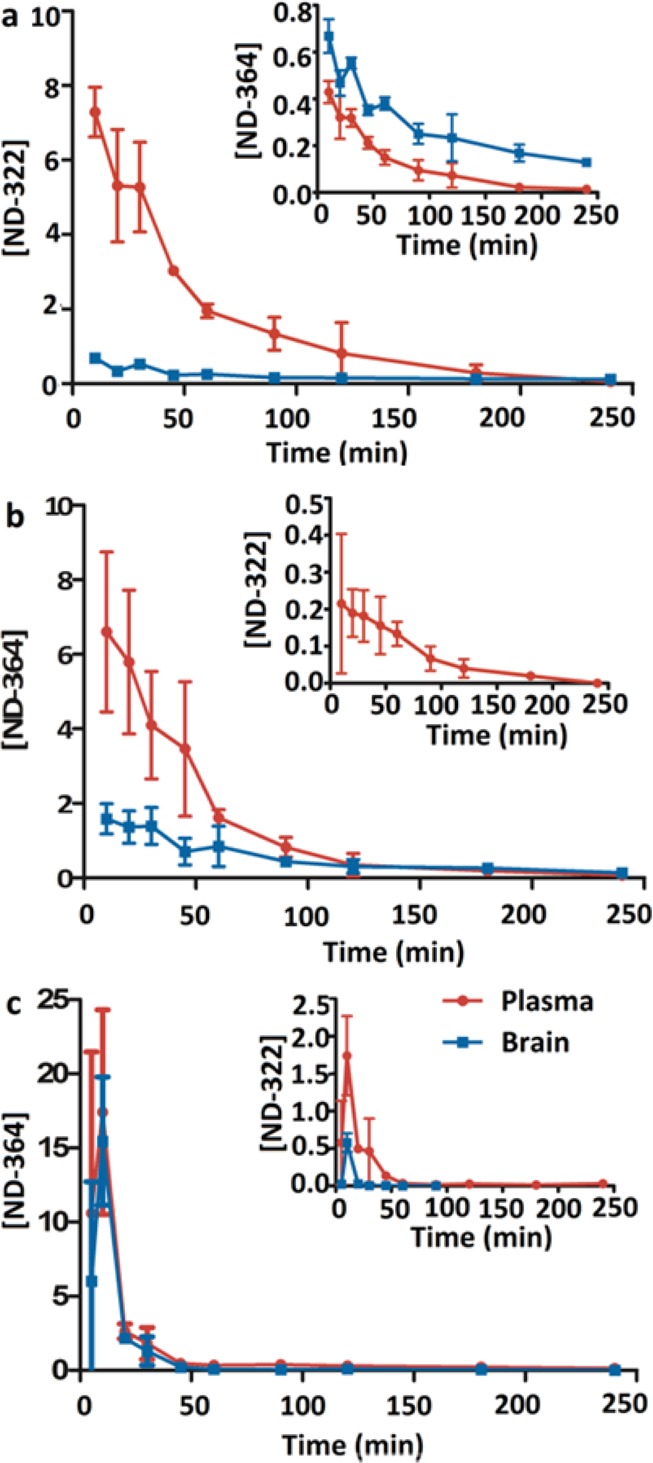
Brain and plasma concentration–time curves after (a) single sc dose administration of ND-322, (b) single sc dose administration of ND-364, and (c) single ip dose administration of ND-364 to mice. Doses of ND-322 and ND-364 were equimolar. Concentrations are given in pmol/mg tissue for brain and in μM for plasma.
Table 2. Pharmacokinetic Parameters of ND-322 and ND-364 after Single sc Dose Administration to Mice.
| after
administration of ND-322 |
after administration of ND-364 |
|||||||
|---|---|---|---|---|---|---|---|---|
| parameter | ND-322 brain | ND-322 plasma | ND-364 brain | ND-364 plasma | ND-322 brain | ND-322 plasma | ND-364 brain | ND-364 plasma |
| AUC0–lasta | 49.2 | 377 | 64.1 | 26.0 | b | 16.6 | 123 | 317 |
| AUC0–∞a | 115 | 379 | 93.1 | 28.0 | b | c | 135 | 321 |
| t1/2α (min) | 9.8 | 21.9 | 19.3 | 24.0 | 54.1 | 46.5 | 52.9 | |
| t1/2β (min) | 385 | 24.4 | 154 | 94.9 | 58.2 | 62.4 | 42.5 | |
| brainAUC/plasmaAUC | 0.131 | 2.47 | 0.388 | |||||
AUC in pmol·min/mg for brain and in μM·min for plasma.
Not quantifiable.
Not calculated; low levels did not allow calculation of terminal half-life and AUClast–∞.
After a dose of ND-364, levels of ND-364 were 3-fold higher in plasma than in brain (Figure 3b). AUC0–last was 123 pmol·min/mg and 317 μM·min in brain and plasma, respectively (Table 2). The brain to plasma AUC ratio was 0.388. Concentrations of ND-364 were at all times above the Ki for MMP-9 of 0.130 μM.
We next investigated the pharmacokinetics and brain distribution of ND-364 after single intraperitoneal (ip) dose administration, because efficacy studies with SB-3CT used this route of administration (Table 3). ND-364 was rapidly absorbed, reaching a maximum concentration of 15.5 ± 4.3 pmol/mg in brain at 10 min (Figure 3c and Table S3 in the Supporting Information), which was 10-fold higher than after sc administration. The brain to plasma AUC ratio was 0.682, indicating that ND-364 crossed the BBB. The brain to plasma AUC ratio of ND-364 after administration of ND-364 was lower than that after administration of ND-478 or ND-322. This could be due to hydrolysis of ND-478 to ND-322 and distribution of ND-322 to the brain where ND-322 could be N-acetylated to ND-364. Concentrations of ND-364 were above the Ki for MMP-9 of 0.130 μM for 45 min. The results pointed to higher brain levels after ip administration and more sustained brain concentrations after sc administration. Thus, we recommend initial ip dosing, followed by sc doses for efficacy studies in animals requiring multiple-dose administration. Brain AUC0–∞ of ND-364 was 199 pmol/mg, 1.6-fold higher than that of SB-3CT.17 The higher systemic exposure and potency (Ki for MMP-9 of 0.130 μM for ND-364 and 0.400 μM for SB-3CT) indicate that ND-364 is superior to SB-3CT.
Table 3. Pharmacokinetic Parameters after Single ip Dose Administration of ND-364 to Mice.
| parameter | ND-364 brain | ND-364 plasma | ND-322 brain | ND-322 plasma |
|---|---|---|---|---|
| AUC0–lasta | 197 | 289 | 4.95 | 32.9 |
| AUC0–∞a | 199 | 311 | b | b |
| t1/2β (min) | 57.3 | 112 | 12.6 | b |
| brainAUC/plasmaAUC | 0.682 | 0.150 |
AUC in pmol·min/mg for brain and in μM·min for plasma.
Not calculated; low levels did not allow calculation of terminal half-life and AUClast–∞.
These studies indicate that after administration of ND-478 or ND-322, the active species is likely the N-acetylated metabolite ND-364. The question arose as to whether ND-322 is metabolized in the liver to ND-364, which then distributes to the brain or ND-322 distributes to the brain and is then metabolized to ND-364. To address this question, we investigated the kinetics of formation of ND-322 and ND-364 in brain and liver S9 (Figure 4).
Figure 4.
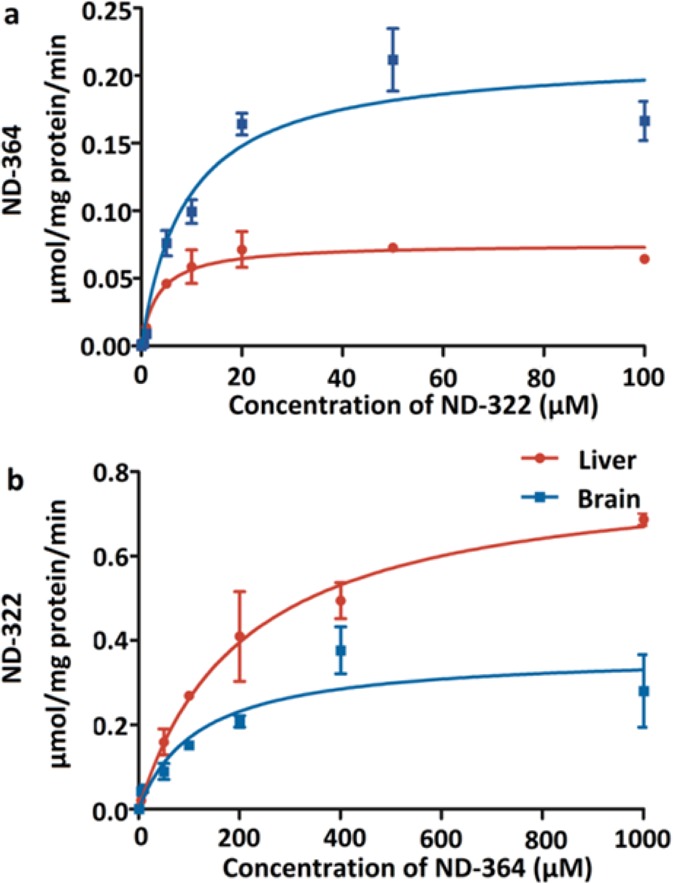
Formation rates in liver and brain of (a) ND-364 from ND-322 and (b) ND-322 from ND-364. Mean ± SD, n = 3.
N-Acetylation of ND-322 in brain was characterized by a Km of 9.0 ± 2.3 μM and Vmax of 0.21 ± 0.02 μmol/(min·mg), resulting in CLint of 23.3 mL/(min·mg) (Table 4). Both the Km and Vmax values for the formation of ND-364 in liver were approximately 3-fold lower than those measured in brain, giving a CLint of 23.5 mL/(min·mg). The results indicate that while ND-322 is N-acetylated in both brain and liver, its turnover in the liver reaches saturation more readily. Hence, the turnover takes place preferentially in the liver, notwithstanding the corresponding lower Vmax value. As the results of Table 4 reveal, the back transformation of ND-364 to ND-322 also takes place both in the liver and brain. However, the Km values observed for ND-364 for this transformation in both tissues are so high (>110 μM) that this reaction cannot reasonably occur at concentrations that we are able to measure in the tissues. As for the N-acetylation of ND-322, we are aware that there are two enzymes that could potentially perform this reaction in both humans and mice, referred to as NAT1 and NAT2. Since the kinetics with mouse S9 were uncomplicated, the implication is that either NAT1 or NAT2 exclusively performed this reaction. Alternatively, if both enzymes did, then they exhibited similar catalytic competencies in this transformation, hence the uncomplicated kinetics.
Table 4. Kinetic Parameters for the Metabolism of ND-322 and ND-364 in Brain and Liver.
| turnover product | tissue | Km (μM) | Vmax (μmol/(min·mg protein)) | CLintc (mL/(min·mg protein)) |
|---|---|---|---|---|
| ND-364a | brain | 9.0 ± 2.3 | 0.21 ± 0.02 | 23.3 |
| liver | 3.4 ± 0.9 | 0.08 ± 0.004 | 23.5 | |
| ND-322b | brain | 119 ± 54 | 0.37 ± 0.05 | 3.1 |
| liver | 210 ± 41 | 0.81 ± 0.06 | 3.9 |
Incubation of ND-322 in mouse brain and liver S9 in the presence of acetyl-CoA.
Incubation of ND-364 in mouse brain and liver microsomes.
CLint calculated as the ratio of Vmax to Km.
Because it would appear that the active species after administration of ND-478 or ND-322 is ND-364, the polymorphism of NAT could have an important role in whether therapeutic levels in the brain would be achieved. Both human NAT isoenzymes, NAT1 and NAT2, are polymorphic. The frequencies of the NAT1 and NAT2 fast acetylator genotype are 16–25% and 19–27% in European Caucasians, 17–21% and 25% in American Caucasians, 42–43% and 36–42% in African Americans, 42% and 68% in Japanese, and 42% and 53% in Taiwanese, respectively.22 Since slow acetylators might not metabolize ND-478 or ND-322 effectively, treatment with the N-acetylated ND-364 as the preferred choice would achieve the requisite therapeutic levels in the brain. Hence, this study not only has explored the pharmacokinetics and brain distribution in mice of the present series of thiirane inhibitors, it also discloses what the likely therapeutic agent is and that it is delivered to the brain readily. The slow-binding selective gelatinase inhibitor ND-364 holds considerable promise in treatment of gelatinase-dependent neurological ailments.
Methods
Syntheses of ND-478, ND-322, ND-364, and Internal Standard
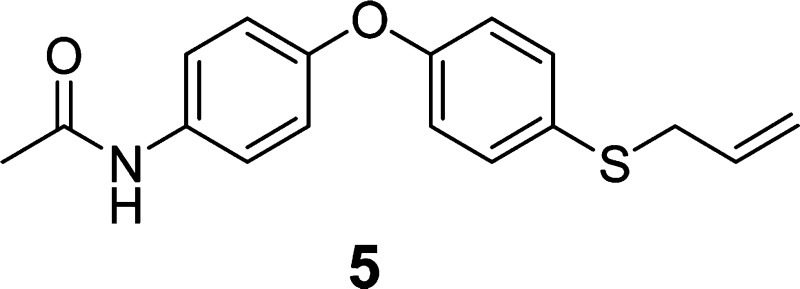
ND-478, ND-322, ND-364, and the internal standard 5 were synthesized as described previously.20,24 ND-478 was dissolved in clinical grade saline (Baxter Healthcare Corporation, Deerfield, IL, USA) to a final concentration of 1.25 mg/mL. ND-322 was dissolved in 80% PEG-200/20% water at a concentration of 6.25 mg/mL. ND-364 was prepared at a concentration of 7.0 mg/mL in 25% DMSO/65% PEG-200/10% water. The internal standard 5 was dissolved in acetonitrile. The dosing solutions were sterilized by filtration through an Acrodisc syringe filter (Pall Life Sciences, Ann Arbor, MI, USA, 0.2 μm, 13 mm diameter, PTFE membrane).
Animals
Mice (C57Bl/6J, 6–8-weeks old, 17–20 g body weight for females and 22–25 g for males, n = 3 per time point) were obtained from The Jackson Laboratory (Bar Harbor, ME, USA). All procedures were approved by the Institutional Animal Care and Use Committee at the University of Notre Dame and the University of Missouri—Columbia. Mice were provided with Teklad 2019 Extruded Rodent Diet (Harlan, Madison, WI, USA) and water ad libitum. Animals were maintained in polycarbonate shoebox cages with hardwood bedding in a room under a 12:12 h light/dark cycle and at 72 ± 2 °F.
Intravenous Infusion of ND-478
ND-478 was administered to mice (n = 3 per time point) as a continuous infusion using a digital programmable syringe pump (F200 model, Chemyx Inc., Houston, TX) via the femoral vein over a period of 30 min, for a total dose of 12.5 mg/kg. Terminal blood samples were collected at −15, 0, 10, 20, 30, 45, 60, and 120 min by cardiac puncture using heparin as anticoagulant. Blood samples were immediately centrifuged to collect plasma. Whole brain samples were harvested after transcardiac perfusion with saline and immediately frozen in dry ice and stored at −80 °C until analysis.
Subcutaneous Administration of ND-322 and ND-364
Female mice (n = 3 per time point per compound) were administered a single subcutaneous (sc) 100-μL dose of ND-322 at 25 mg/kg or ND-364 at 28 mg/kg. Terminal blood samples were collected in heparin through the posterior vena cava at 10, 20, 30, 45, 60, 120, 180, and 240 min. Whole brain samples were harvested after transcardiac perfusion with saline, weighed, and immediately flash frozen in liquid nitrogen and stored at −80 °C until analysis. Blood samples were stored on ice and centrifuged to collect plasma.
Intraperitoneal Administration of ND-364
Female mice (n = 3 per time point) were given a single intraperitoneal (ip) 100-μL dose of ND-364 at 28 mg/kg. Terminal blood and brain samples were collected as described above at 5, 10, 20, 30, 45, 60, 120, 180, and 240 min.
Sample Analysis
A 50-μL aliquot of plasma was mixed with 100 μL of internal standard in acetonitrile to a final concentration of 5 μM. The sample was centrifuged at 20 000g for 15 min. Brain samples were weighed and homogenized for 5 min in one volume of cold acetonitrile, containing an internal standard, using a bullet blender (Next Advance, Inc., Averill Park, NY, USA). The homogenates were centrifuged twice at 20 000g for 20 min at 4 °C. The supernatants from plasma and brain samples were collected and analyzed by reversed-phase ultraperformance liquid chromatography (UPLC)/(+)-electrospray ionization (ESI)–multiple-reaction monitoring (MRM). Calibration curves were prepared by fortification of blank mouse plasma and brain with ND-478, ND-322, and ND-364 at concentrations up to 50 μM. Quantification was performed using peak area ratios relative to the internal standard and linear regression parameters calculated from the calibration curve standards.
Quality Control Samples and Extraction Efficiency
Quality control (QC) samples were prepared daily for three days at three levels (low, medium, and high) in plasma and brain. The preparation of QC samples was the same as described in the Sample Analysis section. Blank brain and plasma were spiked with standard ND-322 or ND-364 at final concentrations corresponding to low QC of 0.10 μM in plasma or 0.10 pmol/mg in brain, medium QC of 8 μM in plasma or 8 pmol/mg in brain, and high QC of 50 μM in plasma or 50 pmol/mg in brain (Tables S4, S5, and S6 in the Supporting Information). Calibration curves were prepared daily. Quantification was performed as described above. The extraction efficiency of ND-322 and ND-364 was determined by comparison of peak area ratios (relative to the internal standard) of the extracted compounds with unextracted authentic standards at three QC levels in plasma and brain (Table S7 in the Supporting Information).
Liquid Chromatography/Mass Spectrometry
A Waters Acquity UPLC system (Waters Corporation, Milford, MA, USA) equipped with a binary solvent manager, an autosampler, a column heater, and a photodiode array detector was used. Mass spectrometric experiments were performed on a Waters TQD tandem quadrupole detector (Milford, MA, USA) with MassLynx MS software. Samples were analyzed in the positive ESI mode with MRM of the transitions 478 → 112 for ND-478, 322 → 185 for ND-322, 364 → 184 for ND-364, and 300 → 93 for the internal standard. Conditions were as follows: capillary voltage 3.2 kV, cone voltage 25 V, extractor voltage 3 V, RF lens voltage 0.1 V, desolvation nitrogen gas flow rate 650 L/h, cone nitrogen gas flow rate 50 L/h, source temperature 147 °C, and desolvation temperature 350 °C. Samples were analyzed on an Acquity BEH Shield RP C18 column (1.7 μm, 2.1 mm i.d. × 100 mm, Waters). Samples were eluted at 0.4 mL/min with an 8-min linear gradient from 70% A/30% B to 10% A/90% B, then 2-min linear gradient to 70% A/30% B (A = 0.1% formic acid in water; B = 0.1% formic acid in acetonitrile).
Pharmacokinetic Parameters
The area under the mean concentration–time curve up to the last quantifiable sampling time (AUC0–last) was calculated by the trapezoidal rule using the pharmacokinetic software PK Solutions (Version 2.0, Summit Research Services, Montrose, CO, USA). AUC0–∞ was calculated as AUC0–last + (Clast/k), where Clast is the concentration at the last quantifiable sampling time and k is the elimination rate constant. Half-lives (t1/2α and t1/2β) were determined from the linear segments of the initial or terminal linear portion of the concentration–time data by linear regression, where the slope of the line is the rate constant k and t1/2α = ln 2/k.
Determination of Kinetic Parameters for the Metabolism of ND-322 and ND-364 in Mouse Liver and Brain
Mice (female C57BL/6J, 6–8-weeks old, n = 10) were used for collection of liver and brain. Tissues were placed in ice-cold PBS (100 mM, pH 7.4) and homogenized on ice using a Dounce homogenizer (Corning, Campbell, NY). The homogenates were centrifuged at 9000g for 15 min at 4 °C to obtain liver and brain S9.25,26
ND-364 was incubated with brain (1 mg/mL) or liver (0.6–0.8 mg/mL) S9 in 100 mM PBS, pH 7.4, containing 5 mM MgCl2 and 1 mM NADPH for 20 min (liver) or 40 min (brain) at 37 °C. Incubations with ND-322 were carried out similarly, except acetyl-coenzyme A sodium salt (final concentration 1 mM) was added and the incubation time was 20 min in both liver and brain. ND-322 was tested at concentrations of 0.05, 0.1, 0.5, 1, 5, 10, 20, 50, and 100 μM. Concentrations of ND-364 were 0.1, 0.5, 1, 5, 10, 50, 100, 200, 400, and 1000 μM. Analyses were performed in duplicate.
Michaelis–Menten kinetic parameters (Km and Vmax) were calculated by nonlinear regression using Prism V.5 (GraphPad, La Jolla, CA, USA) and the following formula: v = (VmaxS)/(Km + S), where v is the reaction velocity and S is the substrate concentration. CLint was calculated as the ratio of Vmax to Km and is expressed in μmol/(mg protein·min).
Supporting Information Available
Tables S1, S2, and S3 showing the concentrations in brain and plasma, Tables S4 and S5 giving the interday accuracy, precision, and relative error of ND-322 and ND-364 in spiked plasma and brain samples, respectively, Table S6 reporting the intraday accuracy, precision, and relative error; and Table S7 summarizing the extraction efficiency. This information is available free of charge via the Internet at http://pubs.acs.org.
Author Contributions
W.S. validated the bioanalytical methods, determined the pharmacokinetics after sc dose administration of ND-322 and ND-364 and after ip administration of ND-364, and carried out experiments with brain and liver S9. W.S. and Z.P. isolated brain and liver S9 and determined the brain distribution after sc dose administration of ND-322 and ND-364 and ip administration of ND-364. M.G. determined the pharmacokinetics and brain distribution after iv infusion of ND-478. M.A.S., V.A.S., and W.R.W. performed the in-life portion of the sc and ip studies and harvested brain and liver samples. M.L. synthesized ND-478 and ND-322; M.I. synthesized ND-364 and the internal standard. J.C. and Z.G. carried out the in-life portion of the iv infusion study. M.C. conceived the study and designed the experiments. W.S., M.G., and M.C. wrote the manuscript.
This work was supported by a grant from the NFL Charities and by the American Heart Association (Grant 09SDG2260983). M.G. is a Fellow of the Chemistry-Biochemistry-Biology Interface Program, supported by training grant GM075762 from the National Institutes of Health.
The authors declare no competing financial interest.
Funding Statement
National Institutes of Health, United States
Supplementary Material
References
- Yong V. W. (2005) Metalloproteinases: Mediators of pathology and regeneration in the CNS. Nat. Rev. Neurosci. 6, 931–944. [DOI] [PubMed] [Google Scholar]
- Wang X.; Jung J.; Asahi M.; Chwang W.; Russo L.; Moskowitz M. A.; Dixon C. E.; Fini M. E.; Lo E. H. (2000) Effects of matrix metalloproteinase-9 gene knock-out on morphological and motor outcomes after traumatic brain injury. J. Neurosci. 20, 7037–7042. [DOI] [PMC free article] [PubMed] [Google Scholar]
- Asahi M.; Asahi K.; Jung J. C.; del Zoppo G. J.; Fini M. E.; Lo E. H. (2000) Role for matrix metalloproteinase 9 after focal cerebral ischemia: Effects of gene knockout and enzyme inhibition with BB-94. J. Cereb. Blood Flow Metab. 20, 1681–1689. [DOI] [PubMed] [Google Scholar]
- Zhang H.; Chang M.; Hansen C. N.; Basso D. M.; Noble-Haeusslein L. J. (2011) Role of matrix metalloproteinases and therapeutic benefits of their inhibition in spinal cord injury. Neurotherapeutics 8, 206–220. [DOI] [PMC free article] [PubMed] [Google Scholar]
- Asahina M.; Yoshiyama Y.; Hattori T. (2001) Expression of matrix metalloproteinase-9 and urinary-type plasminogen activator in Alzheimer’s disease brain. Clin. Neuropathol. 20, 60–63. [PubMed] [Google Scholar]
- Opdenakker G.; Nelissen I.; Van Damme J. (2003) Functional roles and therapeutic targeting of gelatinase B and chemokines in multiple sclerosis. Lancet Neurol. 2, 747–756. [DOI] [PubMed] [Google Scholar]
- Bell R. D.; Winkler E. A.; Singh I.; Sagare A. P.; Deane R.; Wu Z.; Holtzman D. M.; Betsholtz C.; Armulik A.; Sallstrom J.; Berk B. C.; Zlokovic B. V. (2012) Apolipoprotein E controls cerebrovascular integrity via cyclophilin A. Nature 485, 512–516. [DOI] [PMC free article] [PubMed] [Google Scholar]
- Vaillant C.; Meissirel C.; Mutin M.; Belin M. F.; Lund L. R.; Thomasset N. (2003) MMP-9 deficiency affects axonal outgrowth, migration, and apoptosis in the developing cerebellum. Mol. Cell. Neurosci. 24, 395–408. [DOI] [PubMed] [Google Scholar]
- Zhao B. Q.; Wang S.; Kim H. Y.; Storrie H.; Rosen B. R.; Mooney D. J.; Wang X.; Lo E. H. (2006) Role of matrix metalloproteinases in delayed cortical responses after stroke. Nat. Med. 12, 441–445. [DOI] [PubMed] [Google Scholar]
- Brown S.; Bernardo M. M.; Li Z. H.; Kotra L. P.; Tanaka Y.; Fridman R.; Mobashery S. (2000) Potent and selective mechanism-based inhibition of gelatinases. J. Am. Chem. Soc. 122, 6799–6800. [Google Scholar]
- Gu Z.; Cui J.; Brown S.; Fridman R.; Mobashery S.; Strongin A. Y.; Lipton S. A. (2005) A highly specific inhibitor of matrix metalloproteinase-9 rescues laminin from proteolysis and neurons from apoptosis in transient focal cerebral ischemia. J. Neurosci. 25, 6401–6408. [DOI] [PMC free article] [PubMed] [Google Scholar]
- Cui J.; Chen S.; Zhang C.; Meng F.; Wu W.; Hu R.; Hadass O.; Lehmidi T.; Blair G. J.; Lee M.; Chang M.; Mobashery S.; Sun G. Y.; Gu Z. (2012) Inhibition of MMP-9 by a selective gelatinase inhibitor protects neurovasculature from embolic focal cerebral ischemia. Mol. Neurodegener. 7, 21. [DOI] [PMC free article] [PubMed] [Google Scholar]
- Guo Z.; Sun X.; He Z.; Jiang Y.; Zhang X.; Zhang J. H. (2010) Matrix metalloproteinase-9 potentiates early brain injury after subarachnoid hemorrhage. Neurol. Res. 32, 715–720. [DOI] [PubMed] [Google Scholar]
- Wang Z.; Fang Q.; Dang B. Q.; Shen X. M.; Shu Z.; Zuo G.; He W. C.; Chen G. (2012) Potential contribution of matrix metalloproteinase-9 (mmp-9) to cerebral vasospasm after experimental subarachnoid hemorrhage in rats. Ann. Clin. Lab.Sci. 42, 14–20. [PubMed] [Google Scholar]
- Zhang H.; Trivedi A.; Lee J. U.; Lohela M.; Lee S. M.; Fandel T. M.; Werb Z.; Noble-Haeusslein L. J. (2011) Matrix metalloproteinase-9 and stromal cell-derived factor-1 act synergistically to support migration of blood-borne monocytes into the injured spinal cord. J. Neurosci. 31, 15894–15903. [DOI] [PMC free article] [PubMed] [Google Scholar]
- Yu F.; Kamada H.; Niizuma K.; Endo H.; Chan P. H. (2008) Induction of mmp-9 expression and endothelial injury by oxidative stress after spinal cord injury. J. Neurotrauma 25, 184–195. [DOI] [PMC free article] [PubMed] [Google Scholar]
- Gooyit M.; Suckow M. A.; Schroeder K. L.; Wolter W. R.; Mobashery S.; Chang M. (2012) Selective gelatinase inhibitor neuroprotective agents cross the blood–brain barrier. ACS Chem. Neurosci. 3, 730–736. [DOI] [PMC free article] [PubMed] [Google Scholar]
- Testero S. A.; Lee M.; Staran R. T.; Espahbodi M.; Llarrull L. I.; Toth M.; Mobashery S.; Chang M. (2011) Sulfonate-containing thiiranes as selective gelatinase inhibitors. ACS Med. Chem. Lett. 2, 177–181. [DOI] [PMC free article] [PubMed] [Google Scholar]
- Lee M.; Villegas-Estrada A.; Celenza G.; Boggess B.; Toth M.; Kreitinger G.; Forbes C.; Fridman R.; Mobashery S.; Chang M. (2007) Metabolism of a highly selective gelatinase inhibitor generates active metabolite. Chem. Biol. Drug Des. 70, 371–382. [DOI] [PubMed] [Google Scholar]
- Gooyit M.; Lee M.; Schroeder V. A.; Ikejiri M.; Suckow M. A.; Mobashery S.; Chang M. (2011) Selective water-soluble gelatinase inhibitor prodrugs. J. Med. Chem. 54, 6676–6690. [DOI] [PMC free article] [PubMed] [Google Scholar]
- Asahi M.; Sumii T.; Fini M. E.; Itohara S.; Lo E. H. (2001) Matrix metalloproteinase 2 gene knockout has no effect on acute brain injury after focal ischemia. Neuroreport 12, 3003–3007. [DOI] [PubMed] [Google Scholar]
- Upton A.; Johnson N.; Sandy J.; Sim E. (2001) Arylamine N-acetyltransferases - of mice, men and microorganisms. Trends Pharmacol. Sci. 22, 140–146. [DOI] [PubMed] [Google Scholar]
- Boukouvala S.; Sim E. (2005) Structural analysis of the genes for human arylamine N-acetyltransferases and characterisation of alternative transcripts. Basic Clin. Pharmacol. Toxicol. 96, 343–351. [DOI] [PubMed] [Google Scholar]
- Ikejiri M.; Bernardo M. M.; Bonfil R. D.; Toth M.; Chang M.; Fridman R.; Mobashery S. (2005) Potent mechanism-based inhibitors for matrix metalloproteinases. J. Biol. Chem. 280, 33992–34002. [DOI] [PubMed] [Google Scholar]
- Stevens S. M. Jr.; Duncan R. S.; Koulen P.; Prokai L. (2008) Proteomic analysis of mouse brain microsomes: identification and bioinformatic characterization of endoplasmic reticulum proteins in the mammalian central nervous system. J. Proteome Res. 7, 1046–1054. [DOI] [PubMed] [Google Scholar]
- Tang L.; Zhou J.; Yang C. H.; Xia B. J.; Hu M.; Liu Z. Q. (2012) Systematic studies of sulfation and glucuronidation of 12 flavonoids in the mouse liver S9 fraction reveal both unique and shared positional preferences. J. Agric. Food Chem. 60, 3223–3233. [DOI] [PMC free article] [PubMed] [Google Scholar]
Associated Data
This section collects any data citations, data availability statements, or supplementary materials included in this article.


