

Abstract
Mechanical boundaries that define and regulate biological processes, such as cell-cell junctions and dense extracellular matrix networks, exist throughout the physiological landscape. During metastasis, cancer cells are able to invade across these barriers and spread to distant tissues. While transgressing boundaries is a necessary step for distal colonies to form, little is known about interface effects on cell behavior during invasion. Here we introduce a device and metric to assess cell transition effects across mechanical barriers. Using MDA-MB-231 cells, a highly metastatic breast adenocarcinoma cell line, our results demonstrate that dimensional modulation in confined spaces with mechanical barriers smaller than the cell nucleus can induce distinct invasion phases and elongated morphological states. Further investigations on the impact of microtubule stabilization and drug resistance reveal that taxol-treated cells have reduced ability in invading across tight spaces and lose their super-diffusive migratory state and taxol-resistant cells exhibit asymmetric cell division at barrier interfaces. These results illustrate that subnucleus-scaled confinement modulation can play a distinctive role in inducing behavioral responses in invading cells and can help reveal the mechanical elements of non-proteolytic invasion.
Introduction
Metastasis is the process by which cancer invades and spreads to different parts of the body. It is a difficult phenomenon to study because of its expansive spatiotemporal scales–it can involve a single cell’s journey over meters and years.1–3 While new technologies in genomics and proteomics, computational models, and advanced microscopy have facilitated our understanding of the many altered molecular pathways and mutations that occur in cancer,4 very little is understood about the mechanical properties that are characteristic of cancer, particularly at the single-cell level. Single-cell mechanics is important because metastasis is intrinsically a mechanical transport phenomenon in which individual cells must break from the primary tumor, squeeze and invade through small pores of the extracellular matrix (ECM) of the tumor stroma, intra- and extravasate across endothelial junctions, and circulate and traffic in the vasculature.1,2,5 Additionally, cell mechanics is rich with many characteristic properties such as traction stress,6,7 morphological responsivity to force, and material properties. All of these features may potentially impact the capabilities and behavior of cancer cells during invasion.8–11 Moreover, the connections between many important phenomenological events associated with cancer–such as morphological phenotypes, cell division asymmetry, and drug resistance- and the mechanical features of the microenvironment-e.g. geometry, dimensionality, and confinement on a subnucleus length scale–are not well understood. The subnucleus length scale is of particular interest because the nucleus is one of the stiffest and largest organelles in the cell.12 Therefore, intuitively, across the most confined spaces, the nucleus is likely to limit invasion rates and be forced to undergo deformations and potential conformational changes, which could have implications in mechanotransduction and altered cell phenotypes.12–14
Current experimental systems for understanding cell-level mechanical phenomena can be categorized into two general types: passive and active systems from the frame of reference of the cell. In a passive system, the experimentalist is manipulating cells and obtaining measurements, such as material properties of the cytoskeleton and nucleus, often in real-time. Cells are passively being probed and cell signaling is generally not studied in detail. In an active system, cells are seeded in an engineered environment and allowed to interact (actively and holistically) with their surroundings. Timelapse video microscopy is used to record the interactions for later processing.
Examples of passive systems for cell mechanics studies include microfluidic inertial focusing, optical force deformation, microrheology, atomic force microscopy (AFM), and micropipette aspiration.10,11,15–17 The advantage of these systems is that they can be very precise, as in piezo-electric positioning in AFM measurements, with many parameters that are highly tunable (such as flow rate, optical power, electric and magnetic field modulation, and micropipette suction force). Measurements can also be fast on a per cell basis; upwards of thousands of cells can be sampled per second.11 The drawback is that these systems measure passive and/or bulk biological characteristics, such as cell deformability and viscoelasticity. While these properties are useful and can be correlated with important phenomena such as disease state, stem cell differentiation, and possibly metastatic potential,10,11 they are usually a reductionist description of biological systems that are infinitely more complex. As such, phenomena attributable to dynamic behavior and functional abilities associated with the integrated system of a cell (which is a complex coordination of signaling events from a multitude of biomolecules and pathways) typically cannot be assessed.
The advantage of active systems is that they interrogate system-level biological processes and cell responses. The results are then more translatable and tangible toward cell behavior and capabilities in dynamic physiological events, which may help identify targetable elements for therapeutics.18–20 Current state-of-the-art active systems include 3D cell-in-gel models, 2D micropatterning techniques, and microfluidic devices for cell migration.16,21–24 In these systems, aspects of cell motility and mechanics can be studied, such as the cell’s ability to remodel and navigate through extracellular matrix (ECM) fibers, the migration behavior and morphology on a predefined substrate pattern, and motility characteristics in highly confined spaces. One main drawback is that thus far such active systems generally are not well equipped with features and metrics to facilitate the study of complex cell behavior. Dynamic single-cell events and characteristics are important towards our understanding of cancer progression, particularly in light of current themes of interest including heterogeneity, plasticity, and drug-resistance.25–28 Existing methods tend to measure lower-order properties such as cell displacements and velocities. If we consider the complex displacement function of a typical cell, those properties are simply the 0th and 1st order terms of its Taylor expansion. Fundamentally, there is no reason why we should be reduced to those terms. Practically, however, there are limitations. 3D gels are viscoelastic and heterogeneous on the scale of the cell,2,26,29 so environmental dispersion is likely to reduce measurable elements to lower order properties–such as displacements and velocities. Microfluidic motility assays with no localized stimulatory features enable only the measurement of spontaneous cell behavior, so any transition dynamics would be difficult to quantify. Even techniques like traction force microscopy that measure more complex mechanical phenomena are often acquired at fixed points in time. Only recently have experimental studies started alluding to mechanical cell transition dynamics, investigating active shape changes of cell nuclei in hydrogels and induced patterns of velocity change in microchannels.14,30
Here, we develop an active microfluidic system with complex, well-defined features to study the dynamics and mechanical properties of actively invading cells. As shown in Fig. 1, we incorporate patterns and repetitions along a dimensionally-confined microfluidic channel. Specifically, the dimensions are modulated and confinement features smaller than the cell nucleus are incorporated, which stimulate cell transition dynamics both in motility and morphology. Such highly confined geometries mimic the dimensionality of the smallest physiological spaces relevant in metastasis, for example small pores in the dense ECM of the tumor stroma, endothelial junctions during intravasation, and traffic-inducing microvessels.2,19,31,32 Additionally, the periodic barrier design imposes multiple interfaces per cell, which is a first step in better quantifying the effects of more complex physiological boundaries that mimic the spatial heterogeneities found in the tumor stroma. The periodic barriers along a single channel also enable the sampling of individual cells multiple times. The goal of our study is to develop a device designed to test the effects of subnucleus-scaled spatial confinement modulation on the dynamics of cell invasion and the specific roles of cell mechanical plasticity and cell-to-cell heterogeneity in tumor progression. Currently there does not exist a standardized technique that can probe into the connections between these important parameters in cancer metastasis, particularly on a single high-throughput platform.
Fig. 1.

Device design. Microfluidic channels connect two port reservoir regions. Cells are seeded into the reservoir and allowed to invade into the channels. In the actual device, the two ports are connected to the same larger reservoir in order to allow for pressure equilibration and a larger volume of media to be supplied. Expanded view: the multi-staged serial invasion channels (M.U.S.I.C.) device consists of repeating patterns of a larger channel (LC) with width (15 μm) on the scale of the cell connected to a smaller channel (the subnucleus barrier) with width (3.3 μm) smaller than the typical cell nucleus. There are two designs for the subnucleus barrier (SNB)–one is shorter than a typical cell (SNB10) and one is longer (SNB60), with lengths 10 μm and 60 μm, respectively. Transition dynamics occur when cells squeeze across the subnucleus barriers.
In what follows, we quantify higher order mechanical dynamics, interface induced morphological effects, and the impacts of microtubule stabilization and drug resistance during invasion. Our results reveal several key findings–1) cell transition across spaces smaller than the cell nucleus can be segmented into multiple distinct phases, 2) multiple functional strategies are employed by the cell during invasion, 3) a more extended morphological state is induced by the modulation of confined spaces, 4) microtubule stabilization impairs cell transition across mechanical barriers and alters the motile state of the cell, and 5) taxane-resistance is correlated with geometrically induced asymmetric cell division.
Results and discussions
Multi-staged serial invasion microchannels (MUSIC) for investigating cell mechanics and dynamics
To develop an assay that can directionally focus the cell invasion program for high throughput quantitative analysis, we designed and fabricated a microfluidic device that induces serial dimensional modulation on the cell and nucleus scale (Fig. 1). We refer to this herein as a MUlti-staged Serial Invasion Channels (MUSIC) device. To perform the assay, first we induce spontaneous cell migration into confinement microchannels with cross-sectional area comparable to the cell size–the y and z dimensions are bound such that the cell is forced to move primarily along the x-direction. Then we incorporate a spatially tapering interface that connects the confinement channel to another even smaller channel (referred to as the subnucleus barrier (SNB)) with width smaller than the cell nucleus, which is one of the largest and stiffest organelles in the cell.14 Fig. S1, ESI† shows fluorescently stained nuclei at different sections of the device, revealing nuclei morphology and deformation. This device design in essence directs and reduces the 3-D invasion program into a 2-component process–1) the cell migrates in the x-direction while 2) necessarily altering its y-dimensions. Because the migration vector points in one direction (x) and the primary induced region of change is in the orthogonal direction (y), high throughput quantitative analysis can now be accomplished in 1-D, thus increasing the feasibility of experiments and enabling predetermined axes of interest. Furthermore, repeating patterns of the subnucleus barrier are placed along the length of the microchannel, enabling serial effects and multiple sampling of individual cells, therefore providing a way to elucidate the plasticity of mechanisms of invasion for each cell. In our experiments, we consider both 1) cell invasion in only the larger confinement channel region (referred to as LCI) and 2) invasion from the larger channel across the subnucleus barrier (referred to as SNI). Our device design incorporates two different lengths for the SNB–10 μm (SNB10) and 60 μm (SNB60), which are shorter and longer than a typical MDA-MB-231 cell, respectively.
Invasion dynamics across the subnucleus barrier
To understand higher order effects of cell invasion, we first identified the nonlinearity in the cell displacement function during SNI. Then we segmented the process into 4 distinct phases and measured the time constants of each phase. This is important because SNI is a transition process, so an average velocity approximation does not reveal the transition dynamics. In our analysis, four SNI phases are distinguished by distinct mechanical characteristics as shown in Fig. 2. Phase 1–the cell migrates in the larger channel (LC) and slows down as it approaches the subnucleus barrier interface. Phase 2–the body (bulge region) of the cell starts permeating into the subnucleus barrier. Phase 3–the cell stops monotonic forward motion and either pauses or moves back and forth. Phase 4–the body of the cell exits the subnucleus barrier in a monotonic forward motion. We quantified the invasion time constants for the MDA-MB-231 cell line that models highly invasive breast cancer cells, and we parameterized the subnucleus barrier length (Fig. 2b, Video S1, ESI†). By dissecting the measurements into phases, we are able to describe the steps and timeframe for a cell to organize into a conformation that is conducive for subnucleus barrier invasion. Phase 3 is of particular interest in this study because it is a phase that is neglected in conventional assays that score cells based on net cell velocities or average directional persistence. It appears to be a transient reorganization phase, which we will discuss in more detail below.
Fig. 2.
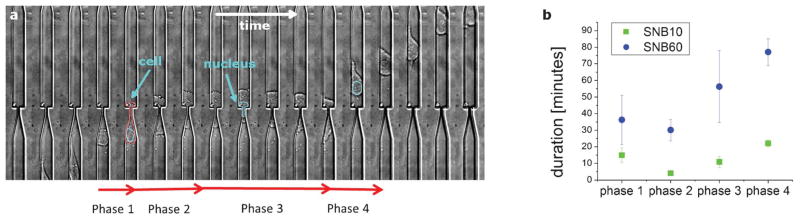
Cell invasion phases. a) The dynamics of a cell invading across subnucleus barriers can be segmented into 4 phases, as shown in the timelapse image stack (17 min/frame). The cell slows down as it reaches the barrier (phase 1), the cell body starts permeating into the barrier (phase 2), the cell pauses or otherwise stops monotonic forward motion (phase 3), and the cell resumes monotonic forward motion and exits the barrier (phase 4). b) The average time constants for these phases are measured for invasions across the subnucleus barriers SNB10 (n = 62) and SNB60 (n = 20), where n is the number of invasion events observed. The width of the larger channel is 15 μm.
Multiple mechanical strategies are employed during invasion
The probability data in Fig. 3a shows that not all of the invasion phases are exhibited by all cells, and the barrier length can modulate the expression of these mechanical phases. Specifically, the longer subnucleus barrier SNB60 has a higher probability of inducing invasion phase 3, whereas many cells do not exhibit this phase in the shorter barrier SNB10. We take a closer look into the mechanistic steps in cell invasion across a confined area and consider the functional role of the dynamic mechanical processes that take place. Here, we qualitatively describe some of the strategies used by the cell in order to modulate its width and squeeze through the subnucleus barrier. Fig. 3b–d demonstrates several scenarios in which the cells squeeze across the barrier. In Fig. 3b, the cell simply contracts and the nucleus of the cell is deformed enough via the contractile force for the cell to move across the constriction. In Fig. 3c–d, the cell undergoes phase 3 as described previously. Fig. 3c shows a cell stuck at the barrier due to a stiff intracellular aggregate. A back extension is protruded which tensionally elongates the cell body and reduces the width of the aggregate, thus facilitating intracellular trans-barrier transport. In Fig. 3d, the cell moves backwards and forward, during which there are cytoplasmic rotational dynamics. The cell body permeates into the confined region in a rolling motion, which potentially enables the sampling of different energy landscapes and deformable configurations and may reduce the energy required to deform the cell nucleus. Therefore, through dimensional modulation at the length scale of the cell nucleus, we have more clearly identified some of the mechanical and functional phenomena that are active during the invasion process. Recent studies have demonstrated that lamin b1 and dynein help regulate rotations of and force transduction onto the cell nucleus,33,34 so further investigations would be interesting to investigate their contributions to the invasion program.
Fig. 3.

Functional strategies during mechanical invasion. a) The probability of phase 3 existing for the two different subnucleus barriers SNB10 and SNB60. SNB60 induces a higher probability of phase 3 existing (70%, n = 20) than SNB10 (19.4%, n = 62). Error bars represent standard error of the mean (s.e.m.) from Bernoulli statistics and *** indicates p < 0.001 (Chi-squared test). b) A timelapse image stack (17 min/frame) showing a cell invading across SNB10 with no phase 3 observed. The contractile force of the cell is enough to deform the cell nucleus across the barrier in a monotonic forward motion. c) As this cell invades from top to bottom across SNB60, a stiff aggregate at the rear of the cell is stuck at the barrier interface. A back extension is protruded, which tensionally reduces the width of the aggregate and facilitates intracellular trans-barrier transport. 34 min elapsed between subsequent frames. d) As this cell is invading from the LC into SNB60, cell body rotations, with visualization facilitated by endocytosed particles, can be seen in the timelapse image stack during the invasion process. These rotational dynamics may help position the cell more favorably and/or sample more energetically favorable conformations as the cell is invading across the subnucleus barrier. 34 min elapsed between subsequent frames. The width of the larger channel is 15 μm.
Microtubule stabilization decreases cell invasiveness, but not simply by reducing cell speed
Microtubule dynamics are important in many aspects of cell mechanics, including cell division and polarization.35–38 Previous studies have demonstrated that microtubule stabilization reduces asymmetric distribution of cell motor proteins and reduces asymmetry in microtubule instability in the cell.38 These properties are necessary for leading and trailing edges of the cell to form, which in turn lead to polarized cell migration. Here, we consider the invasion dynamics of the cell as a result of microtubule stabilization. We compare MDA-MB-231 cells that are either untreated or treated with 16 μM taxol, which stabilizes microtubule dynamics39 (Video S2, ESI†). We show that taxol-treated cells spend a significantly longer time at the interface of the subnucleus barrier, as shown in Fig. 4a. For instance, for a 10 μm long subnucleus barrier, cells typically take less than 1 h for permeation. Taxol-treated cells, however, spend t > 20 h at the interface. Many cells actually spend more than the duration of our timelapse experiments before permeation, so the times specified for taxol-treated cells represent a lower-bound of the actual SNI time.
Fig. 4.

Effects of Microtubule Stabilization. a) Taxol-treated (16 μM) MDA-MB-231 cells take much longer to permeate across the subnucleus barriers than untreated MDA-MB-231 cells. The total invasion times are 0.86 h (n = 62 invasion events), 3.33 h (n = 20 invasion events), 22 h (n = 42 invasion events), 22 h (n = 31 invasion events), for untreated cells across SNB10, untreated cells across SNB60, taxol-treated cells across SNB10, and taxol-treated cells across SNB60, respectively. Many of the taxol-treated cells have yet to permeate through the subnucleus barrier by the end of the experiments, so the data represents a lower-bound measurement. Cells that have not permeated by the end of the experiments were only accounted for if they have spent at least 4 h at the barrier. This way we have disregarded arbitrarily short lower-bound measurements for data that was truncated too early (less than 4 h). Inset: the average speed of untreated (0.93 μm min−1, n = 12) and 16 μM taxol-treated (0.53 μm min−1, n = 10) MDA-MB-231 cells in the larger channel LC during a 3.4 min time interval. Error bars are s.e.m. b) Log-log plot of the average normalized mean-squared displacements (MSD) vs. time for untreated (black circles, n = 12 cells) and taxol-treated cells (red squares, n = 10 cells) in the larger channel LC. Normalization is with respect to the first data point (3.4 min time interval) of each cell. Error bars are s.e.m. A non-linear least squares fit to a power-law model shows a dependence of t1.667 (R2: 0.996, 95% confidence [1.66, 1.673]) and t1.014 (R2: 0.9829, 95% confidence [1.006, 1.022]) for untreated and taxol-treated MDA-MB-231 cells, respectively. For Brownian motion, MSD ∝ t.
To explain these results from a mechanical standpoint, we consider migration dynamics of the cells in the larger channel region LC (before reaching the subnucleus barrier interface). In this region, the average cell speed differs by only a factor of >2 between treated and untreated cells (Fig. 4a (inset)). We consider this to be low compared to the factor of >20 in total SNI time over a barrier that is only 10 μm long. To investigate the possible reasons for this phenomenon, we analyze the second moment of the cell displacement function (i.e. the mean-squared displacement (MSD)). As shown in Fig. 4b, the MSD vs. time interval relation can be fitted well to a power-law model. For untreated cells MSD ∝ t1.67, whereas for micro-tubule-stabilized cells MSD ∝ t1, where t is the time interval. To help understand the consequence of these results, consider the two limiting cases. If a particle moves at a constant velocity v, MSD = v2t2, and if a particle is undergoing 1-D Brownian motion (pure random walk), MSD = 2Dt, where D is the diffusion coefficient. The power-law dependence on time will manifest on the log-log MSD vs. t curve as the slope. Our results demonstrate that untreated cells are super-diffusive, as consistent with previous 2D studies,40 but microtubule stabilized cells exhibit a purely random motion behavior, indicating that microtubule dynamics contribute to adding a “memory effect” to cell motility.
Since microtubules play an important role in cell polarization, motility, and division, in addition to being a well-targeted molecule in anticancer treatments,37 it is particularly interesting to understand their role during mechanical invasion. Microtubule stabilization drastically reduces the ability of MDA-MB-231 cells to invade across subnucleus barriers, and one potential cause is that the cells’ natural super-diffusive nature is abolished, reducing them to Brownian movers. Previous studies have shown that signaling through the Rho family of GTPases help stabilize microtubules at the leading edge of cells and can determine migration persistence, phenomenologically distinct from phosphoinositide 3-kinase (PI3K) signaling in chemotaxis.41,42 Concentrations of the GTPase Rac1 are modulated through the dimensionality of the microenvironment (1D lines, 2D flat surfaces, and 3D matrices), and a naturally occurring reduction in Rac1 expression in 1D and 3D as compared to 2D environments leads to fewer peripheral protrusions which results in more persistent migratory behavior.42 Rho-GTPase signaling may therefore explain the persistent migration in these confined microchannels, and by diminishing this persistence through uniform rather than localized microtubule stabilization, the cell invasion ability across subnucleus barriers is also impaired. This suggests that microtubule stabilization may prevent cells from permeating across tight spaces, which when used together with matrix metalloproteinases (MMP)-inhibitors to prevent proteolytic invasion, may produce a synergistic effect in suppressing invasion across tight physiological spaces (some of which are degradable by MMPs). A previous study used protease inhibitors together with Y27632 (which inhibits Rho-associated protein kinase ROCK) and demonstrated synergistic effects in preventing cell invasion.18 One difference here is that microtubule targeting drugs are approved and readily available in cancer treatments. These drugs have been applied traditionally for their anti-mitosis and apoptosis effects in addition to potential anti-metastasis properties.37,43 However, it is unclear how they affect single-cell invasion. Our results suggest that for viable cells after treatment, anti-invasion effects from taxol may manifest in the impediment of polarization-dependent permeation across subnucleus barriers (rather than on simply altering cell speed). These details can potentially help in the design of new combination chemotherapeutics.
Dimensional modulation induces differential cell extension lengths
With the MUSIC device, we demonstrate that dimensional modulation on the scale of the cell and cell nucleus and interface effects from subnucleus barriers can induce morphological changes in invading cells. As demonstrated in Fig. 5 and Video S3, ESI,† when a cell interacts with a region smaller than the cell nucleus, significantly longer extensions are protruded. These extensions can be hundreds of micrometers long. Interestingly, K20T cells, the taxol resistant derivative of MDA-MB-231 cells, are longer even without interface effects. Furthermore, the cell length distribution data shown in Fig. 5b demonstrates the diversity of morphological states exhibited during the invasion process.
Fig. 5.

Cell extension lengths. a) The average cell extension length measured at a random point in time for MDA-MB-231 cells in the larger channel LC (53 μm, n = 42 cells), while interacting with SNB10 (85 μm, n = 50 cells), while interacting with SNB60 (95 μm, n = 45 cells), and K20T cells in the LC (109 μm, n = 35 cells). Extension lengths are measured from the center of the cell body to the end of the longest extension. The subnucleus barrier induces longer cell extensions and K20T cells also have longer cell extensions. ** represents p < 0.01 and *** represents p < 0.001 from ANOVA statistics. b) Histograms and typical cell morphologies at each scenario. The width of the larger channel is 15 μm.
These results suggest that mechanical barriers can cause cells to have a larger, more extended region of influence, which may facilitate nutrient-finding and homing towards the vasculature in conjunction with other mechanisms such as chemotaxis.44 Certain cell morphologies have been linked to more potent cancer phenotypes. Compressive forces in 2D experiments for instance lead to a “leader cell” phenotype that is elongated and spindle-shaped and leads neighboring cells in the invasion process.9 Substrate stiffness and tensional forces can induce larger cell areas and activate integrin mediated signaling pathways that lead to more malignant phenotypes.8 The sidewalls of the subnucleus barriers in the MUSIC device essentially impose compression in the form of normal forces onto the cell and its nucleus during invasion, and the induced cell elongation process likely causes higher tension along the cell. Subnucleus barrier confinements therefore may contribute towards driving metastatic phenotypes.
Taxol resistant cells are more susceptible to asymmetric cell division during invasion
K20T cells are taxol-resistant MDA-MB-231 cells selected as described in.45 As shown in Fig. 6 and Video S4, ESI,† K20T cells that divide while moving from left to right into the subnucleus barrier interface exhibit geometric asymmetry in its axis of division, with the daughter cell closer to the confinement region being 50% larger. This phenomenon is not as pronounced in control MDA-MB-231 cells or in K20T cells that divide in the symmetric straight region of the device. Calculations of area ratios are determined by the following methodology: in symmetric large channel regions, the area ratio AR = Asmaller cell/Alarger cell; in the interface region, only cells moving from left to right into the interface are considered, and the area ratio is determined by AR = Aleft cell/Aright cell. Asymmetric cell division has been linked to aneuploidy and genomic instability, which can potentially lead to accelerated and gain of function mutations.46–48 Our results here could imply that the resistant cell line is intrinsically more ready to mutate and that geometric effects during invasion can have an impact on cell division, mutations, and directed evolution. Further investigations into cell ploidy and phenotypic differences between cells that have divided asymmetrically will be necessary to investigate the connections between drug and taxane-resistance and tumor cell evolution during invasion. Previous efforts in 2D protein micropatterning techniques have demonstrated that the axis of cell division and mitotic spindle positioning can be regulated by geometric constraints.49,50 However, connections between cell behavior (migration and division) in 2D geometric patterns and cancer progression and evolution due to invasion, inherently a 3D process, are unclear. Confinement in 3D mechanically simulates tight physiological spaces relevant during invasion, and physiological cell division also usually occurs in 3D, so a transition from 2D engineered patterns to 3D engineered patterns can reveal insights of dimensionality on cell division mechanics. Additionally, the probability of a cell dividing at any given region of fixed length should be higher if there is a mechanical barrier there because the cell spends more time in that region due to the transition dynamics described earlier. Therefore, understanding cell division effects caused by different mechanical barriers during invasion may provide insights towards potential driving elements of cell evolution. This is particularly interesting for cancer cells since they are notorious for their ability to acquire new abilities4 and they typically do not exhibit contact inhibition,51,52 so their cell cycle is likely not influenced by external elements such as mechanical confinement. We note here that the throughput of these experiments in this design of the MUSIC device is lower in comparison to the invasion studies since only a fraction of the invading cells will divide at the SNB interface. A next generation device design incorporating more frequent SNBs can increase experimental throughput by increasing the probability that a cell is positioned in a geometrically asymmetric location during division.
Fig. 6.

Cell division asymmetry. MDA-MB-231 cells tend to divide symmetrically both in the larger channel LC and at the barrier interface. K20T cells, however, tend to divide asymmetrically at the subnucleus barrier interface. The daughter cell closer to the barrier is larger. AR = area ratio between daughter cells. In the symmetric larger channel LC, AR = smaller cell/larger cell. At the interface, AR = left cell/right cell, and only cells dividing while invading from left to right into the SNB are taken into account. The area ratios measured are (mean = 0.91, median = 0.92, n = 19) for MDA-MB-231 in LC, (mean = 0.97, median = 0.96, n = 17) for MDA-MB-231 at SNB interface, (mean = 0.85, median = 0.94, n = 17) for K20T in LC, and (mean = 0.67, median = 0.63, n = 7) for K20T at SNB interface. *** indicates p < 0.001 from ANOVA statistics. Error bars are s.e.m. The width of the larger channel is 15 μm.
Conclusion
There are many instances when cells exhibit modulation from their environment. Sometimes the external stimulation exists as chemical cues as in chemotaxis, and sometimes it is presented as mechanical cues, such as during contact inhibition or durotaxis.44,52–54 Often times the signal is both physical and chemical, as in cell-cell or cell-ECM interactions.8,54–56 Here we presented a different form of mechanical modulation–modulation in the confinement dimensions of invading cells. This is of particular interest towards cancer progression and metastasis because tumor growth can lead to increased confinement sensed by the cells and cell invasion can involve permeation across tight spaces, from tumor stroma to basement membranes to endothelial junctions.1,2,9 We have created a platform–serial dimensional modulation at the subnucleus length scale–and device (MUSIC) that enable new phenomenological events associated with mechanical cell invasion and boundary effects to be elucidated and quantified. We focused on higher order invasion dynamics, morphologies, division, and pharmacologic effects and thus have demonstrated the details and wide range of biological phenomena on the single-cell scale that can be interrogated with our approach. Our analysis revealed some important characteristics, such as elongated morphologies, cell division asymmetry, and super-diffusivity, that suggest potential mechanical elements during invasion that can drive cancer metastasis and progression. Our previous work30 has also shown that more subtle geometric effects such as barrier angles could impact invasion behavior and that cancer cells of different metastatic grades exhibit differential invasion capacities across mechanical barriers. Further studies using the MUSIC device for different cancer cell lines with different external chemotactic inputs can help elicit and establish characteristic behavioral signatures of mechanical invasion and identify modulation effects from chemokines. Therefore, our platform has potential applications in uncovering subtle properties of cell invasion, drug screening, and discovering mechanical biomarkers. The portable and versatile lab-on-a-chip form-factor of and the label free properties measureable by our technique also facilitate implementation in clinical and commercial settings.
Methods
Cell culture and reagents
MDA-MB-231 cells were obtained from the NCI PS-OC and the ATCC. They were cultured in Leibovitz L-15 media (Life Technologies) supplemented with 10% fetal bovine serum (Atlanta Biologicals) and 1% Penicillin-Streptavidin (Life Technologies). K20T cells were obtained from the Giannakakou lab at Weill Cornell Medical College. They are a taxol-resistant derivative of MDA-MB-231 cells.45 They were cultured in L-15 media supplemented with 10% fetal bovine serum, 1% Penicillin-Streptavidin, and 15 nm paclitaxel (taxol) (Cytoskeleton, Inc). All cells were incubated at 37 °C without supplemented CO2.
Device fabrication
Device masters were fabricated at the Cornell Nanofabrication Facility (CNF). Standard stepper photolithography was used on SU8 resist on a silicon substrate followed by PDMS-soft lithography, similarly described in.30 Briefly, SU8 was spun onto a Si wafer, exposed to UV with a stepper under a patterned photomask, and developed to create patterned master substrates. PDMS was then molded over the master and crosslinked to create microchannels. The channels were bonded to glass slides to create microfluidic devices.
Experiments and analysis
Cells were loaded into the inlet reservoir regions at the ends of the microchannels and allowed to spontaneously migrate into the three-dimensionally confined channels. Devices with cells were incubated as in regular cell culture as described above. Timelapse experiments were performed once the cells were in the channels. For each experiment, devices were placed on top of a heating plate maintained at 37 °C. Typical durations for timelapse experiments were around 1–2 days at a temporal resolution of 3.4 min. Cell tracking and measurements were performed by manual tracing via ImageJ. Data processing and analysis were performed via custom programs on MATLAB. The height of the microchannels used for all experiments with quantitative analysis was 10 μm. 5 μm high channels were used in Fig. 2a and 3 only for demonstrative purposes and qualitative presentation. The reason was that mechanical features were very clear for 5 μm high channels, but the experimental throughput was low because many cells did not permeate subnucleus barriers that were 5 μm high. For statistical analysis, the Chi-squared test was used for probability measurements, and ANOVA statistics were used for all other measurements, unless otherwise specified. Error bars are standard error of the mean (s.e.m.). Standard DAPI staining was used for fluorescence imaging in Fig. S1, ESI.† For cell viability in these devices, we found in a typical timelapse experiment of >23 h that less than 10% (5 out of 54) of the cells died while occupying the experimental field of view.
Acknowledgments
We thank Professor Paraskevi Giannakakou for the K20T cells. The work described was supported by the Cornell Center on the Microenvironment and Metastasis through Award Number U54CA143876 from the National Cancer Institute. This work was performed in part at the Cornell NanoScale Facility, a member of the National Nanotechnology Network, which is supported by the National Science Foundation (Grant ECS-0335765). Michael Mak is a NSF Graduate Research Fellow. The funders had no role in study design, data collection and analysis, decision to publish, or preparation of the manuscript.
Footnotes
Electronic supplementary information (ESI) available. See DOI: 10.1039/c2lc41117b
References
- 1.Chambers AF, Groom AC, MacDonald IC. Nat Rev Cancer. 2002;2:563–572. doi: 10.1038/nrc865. [DOI] [PubMed] [Google Scholar]
- 2.Sahai E. Nat Rev Cancer. 2007;7:737–749. doi: 10.1038/nrc2229. [DOI] [PubMed] [Google Scholar]
- 3.Quintana E, Shackleton M, Sabel MS, Fullen DR, Johnson TM, Morrison SJ. Nature. 2008;456:593–598. doi: 10.1038/nature07567. [DOI] [PMC free article] [PubMed] [Google Scholar]
- 4.Hanahan D, Weinberg RA. Cell. 2011;144:646–674. doi: 10.1016/j.cell.2011.02.013. [DOI] [PubMed] [Google Scholar]
- 5.Kumar S, Weaver VM. Cancer Metastasis Rev. 2009;28:113–127. doi: 10.1007/s10555-008-9173-4. [DOI] [PMC free article] [PubMed] [Google Scholar]
- 6.Kraning-Rush CM, Carey SP, Califano JP, Smith BN, Reinhart-King CA. Phys Biol. 2011;8:015009. doi: 10.1088/1478-3975/8/1/015009. [DOI] [PMC free article] [PubMed] [Google Scholar]
- 7.Kraning-Rush CM, Califano JP, Reinhart-King CA. PLoS One. 2012;7:e32572. doi: 10.1371/journal.pone.0032572. [DOI] [PMC free article] [PubMed] [Google Scholar]
- 8.Paszek MJ, Zahir N, Johnson KR, Lakins JN, Rozenberg GI, Gefen A, Reinhart-king CA, Margulies SS, Dembo M, Boettiger D, Hammer DA, Weaver VM. Cancer Cell. 2005;8:241–254. doi: 10.1016/j.ccr.2005.08.010. [DOI] [PubMed] [Google Scholar]
- 9.Tse JM, Cheng G, Tyrrell JA, Wilcox-Adelman SA, Boucher Y, Jain RK, Munn LL. Proc Natl Acad Sci U S A. 2012;109:911–916. doi: 10.1073/pnas.1118910109. [DOI] [PMC free article] [PubMed] [Google Scholar]
- 10.Guck J, Schinkinger S, Lincoln B, Wottawah F, Ebert S, Romeyke M, Lenz D, Erickson HM, Ananthakrishnan R, Kas DMJ, Ulvick S, Bilby C. Biophys J. 2005;88:3689–3698. doi: 10.1529/biophysj.104.045476. [DOI] [PMC free article] [PubMed] [Google Scholar]
- 11.Gossett DR, Tse HTK, Lee SA, Ying Y, Lindgren AG, Yang OO, Rao J, Clark AT, Carlo DD. Proc Natl Acad Sci U S A. 2012;109:7630–7635. doi: 10.1073/pnas.1200107109. [DOI] [PMC free article] [PubMed] [Google Scholar]
- 12.Dahl KN, Ribeiro AJS, Lammerding J. Circ Res. 2008;102:1307–1318. doi: 10.1161/CIRCRESAHA.108.173989. [DOI] [PMC free article] [PubMed] [Google Scholar]
- 13.Butcher DT, Alliston T, Weaver VM. Nat Rev Cancer. 2009;9:108–122. doi: 10.1038/nrc2544. [DOI] [PMC free article] [PubMed] [Google Scholar]
- 14.Friedl P, Wolf K, Lammerding J. Curr Opin Cell Biol. 2011;23:55–64. doi: 10.1016/j.ceb.2010.10.015. [DOI] [PMC free article] [PubMed] [Google Scholar]
- 15.Bao G, Suresh S. Nat Mater. 2003;2:715–725. doi: 10.1038/nmat1001. [DOI] [PubMed] [Google Scholar]
- 16.Wirtz D, Konstantopoulos K, Searson PC. Nat Rev Cancer. 2011;11:512–522. doi: 10.1038/nrc3080. [DOI] [PMC free article] [PubMed] [Google Scholar]
- 17.Rosenbluth MJ, Lam WA, Fletcher DA. Biophys J. 2006;90:2994–3003. doi: 10.1529/biophysj.105.067496. [DOI] [PMC free article] [PubMed] [Google Scholar]
- 18.Sahai E, Marshall CJ. Nat Cell Biol. 2003;5:711–719. doi: 10.1038/ncb1019. [DOI] [PubMed] [Google Scholar]
- 19.Friedl P, Wolf K. Nat Rev Cancer. 2003;3:363–374. doi: 10.1038/nrc1075. [DOI] [PubMed] [Google Scholar]
- 20.Albini A, Noonan DM. Current Opinion in Cell Biology. 2010 doi: 10.1016/j.ceb.2010.08.017. [DOI] [PubMed] [Google Scholar]
- 21.Fraley SI, Feng Y, Krishnamurthy R, Kim DH, Celedon A, Longmore GD, Wirtz D. Nat Cell Biol. 2010;12:598–604. doi: 10.1038/ncb2062. [DOI] [PMC free article] [PubMed] [Google Scholar]
- 22.Irmia D, Toner M. Integr Biol. 2009;1:506–512. doi: 10.1039/b908595e. [DOI] [PMC free article] [PubMed] [Google Scholar]
- 23.Mahmud G, Campbell CJ, Bishop KJM, Komarova YA, Chaga O, Soh S, Huda S, Kandere-Grzybowska K, Grzybowski BA. Nat Phys. 2009;5:606–612. [Google Scholar]
- 24.Jiang X, Bruzewicz DA, Wong AP, Piel M, Whitesides GM. Proc Natl Acad Sci U S A. 2005;102:975–978. doi: 10.1073/pnas.0408954102. [DOI] [PMC free article] [PubMed] [Google Scholar]
- 25.Gerlinger M, Rowan AJ, Horswell S, Larkin J, Endesfelder D, Gronroos E, Martinez P, Matthews N, Stewart A, Tarpey P, Varela I, Phillimore B, Begum S, McDonald NQ, Butler A, Jones D, Raine K, Latimer C, Santos CR, Nohadani M, Eklund AC, Spencer-Dene B, Clark G, Pickering L, Stamp G, Gore M, Szallasi Z, Downward J, Futreal PA, Swanton C. N Engl J Med. 2012;366:883–892. doi: 10.1056/NEJMoa1113205. [DOI] [PMC free article] [PubMed] [Google Scholar]
- 26.Wolf K, Mazo I, Leung H, Engelke K, Andrian UHv, Deryugina EI, Strongin AY, Bröcker E-B, Friedl P. J Cell Biol. 2003;160:267–277. doi: 10.1083/jcb.200209006. [DOI] [PMC free article] [PubMed] [Google Scholar]
- 27.Hermann PC, Huber SL, Herrler T, Aicher A, Ellwart JW, Guba M, Bruns CJ, Heeschen C. Cell Stem Cell. 2007;1:313–323. doi: 10.1016/j.stem.2007.06.002. [DOI] [PubMed] [Google Scholar]
- 28.Verdier-Pinard GAOP, McDai H, Horwitz SB. Oncogene. 2003;22:7280–7295. doi: 10.1038/sj.onc.1206934. [DOI] [PMC free article] [PubMed] [Google Scholar]
- 29.Velegol D, Lanni F. Biophys J. 2001;81:1786–1792. doi: 10.1016/S0006-3495(01)75829-8. [DOI] [PMC free article] [PubMed] [Google Scholar]
- 30.Mak M, Reinhart-King CA, Erickson D. PLoS One. 2011;6:e20825. doi: 10.1371/journal.pone.0020825. [DOI] [PMC free article] [PubMed] [Google Scholar]
- 31.Sabeh F, Shimizu-Hirota R, Weiss SJ. J Cell Biol. 2009;185:11–19. doi: 10.1083/jcb.200807195. [DOI] [PMC free article] [PubMed] [Google Scholar]
- 32.Kienast Y, Baumgarten Lv, Fuhrmann M, Klinkert WEF, Goldbrunner R, Herms J, Winkler F. Nat Med. 2010;16:116–122. doi: 10.1038/nm.2072. [DOI] [PubMed] [Google Scholar]
- 33.Levy JR, Holzbaur ELF. J Cell Sci. 2008;121:3187–3195. doi: 10.1242/jcs.033878. [DOI] [PMC free article] [PubMed] [Google Scholar]
- 34.Ji JY, Lee RT, Vergnes L, Fong LG, Stewart CL, Reue K, Young SG, Zhang Q, Shanahan CM, Lammerding J. J Biol Chem. 2007;282:20015–20026. doi: 10.1074/jbc.M611094200. [DOI] [PubMed] [Google Scholar]
- 35.Takesono A, Heasman SJ, Wojciak-Stothard B, Garg R, Ridley AJ. PLoS One. 2010;5:e8774. doi: 10.1371/journal.pone.0008774. [DOI] [PMC free article] [PubMed] [Google Scholar]
- 36.Rankin KE, Wordeman L. J Cell Biol. 2010;190:35–43. doi: 10.1083/jcb.201004017. [DOI] [PMC free article] [PubMed] [Google Scholar]
- 37.Jordan MA, Wilson L. Nat Rev Cancer. 2004;4:253–265. doi: 10.1038/nrc1317. [DOI] [PubMed] [Google Scholar]
- 38.Kapoor S, Panda D. Biochem Pharmacol. 2012;83:1495–1506. doi: 10.1016/j.bcp.2012.02.012. [DOI] [PubMed] [Google Scholar]
- 39.Schiff PB, Horwitz SB. Proc Natl Acad Sci U S A. 1980;77:1561–1565. doi: 10.1073/pnas.77.3.1561. [DOI] [PMC free article] [PubMed] [Google Scholar]
- 40.Dieterich P, Klages R, Preuss R, Schwab A. Proc Natl Acad Sci U S A. 2008;105:459–463. doi: 10.1073/pnas.0707603105. [DOI] [PMC free article] [PubMed] [Google Scholar]
- 41.Petrie RJ, Doyle AD, Yamada KM. Nat Rev Mol Cell Biol. 2009;10:538–549. doi: 10.1038/nrm2729. [DOI] [PMC free article] [PubMed] [Google Scholar]
- 42.Pankov R, Endo Y, Even-Ram S, Araki M, Clark K, Cukierman E, Matsumoto K, Yamada KM. J Cell Biol. 2005;170:793–802. doi: 10.1083/jcb.200503152. [DOI] [PMC free article] [PubMed] [Google Scholar]
- 43.Stearns ME, Wang M. Cancer Research. 1992;52:3776–3781. [PubMed] [Google Scholar]
- 44.Shields JD, Fleury ME, Yong C, Tomei AA, Randolph GJ, Swartz MA. Cancer Cell. 2007;11:526–538. doi: 10.1016/j.ccr.2007.04.020. [DOI] [PubMed] [Google Scholar]
- 45.Wiesen KM, Xia S, Yang CPH, Horwitz SB. Cancer Lett. 2007;257:227–235. doi: 10.1016/j.canlet.2007.07.022. [DOI] [PubMed] [Google Scholar]
- 46.Storchova Z, Pellman D. Nat Rev Mol Cell Biol. 2004;5:45–54. doi: 10.1038/nrm1276. [DOI] [PubMed] [Google Scholar]
- 47.Knoblich JA. Nat Rev Mol Cell Biol. 2010;11:849–860. doi: 10.1038/nrm3010. [DOI] [PMC free article] [PubMed] [Google Scholar]
- 48.Rajagopalan H, Lengauer C. Nature. 2004;432:338–341. doi: 10.1038/nature03099. [DOI] [PubMed] [Google Scholar]
- 49.Fink J, Carpi N, Betz T, Bétard A, Chebah M, Azioune A, Bornens M, Sykes C, Fetler L, Cuvelier D, Piel M. Nat Cell Biol. 2011;13:771–778. doi: 10.1038/ncb2269. [DOI] [PubMed] [Google Scholar]
- 50.Thery M, Jimenez-Dalmaroni A, Racine V, Bornens M, Julicher F. Nature. 2007;447:493–497. doi: 10.1038/nature05786. [DOI] [PubMed] [Google Scholar]
- 51.Suresh S. Acta Mater. 2007;55:3989–4014. [Google Scholar]
- 52.Liu L, Sun B, Pedersen JN, Yong KMA, Getzenberg RH, Stone HA, Austin RH. Proc Natl Acad Sci U S A. 2011;108:6853–6856. doi: 10.1073/pnas.1102808108. [DOI] [PMC free article] [PubMed] [Google Scholar]
- 53.Isenberg BC, DiMilla PA, Walker M, Kim S, Wong JY. Biophys J. 2009;97:1313–1322. doi: 10.1016/j.bpj.2009.06.021. [DOI] [PMC free article] [PubMed] [Google Scholar]
- 54.Roussos ET, Condeelis JS, Patsialou A. Nat Rev Cancer. 2011;11:573–587. doi: 10.1038/nrc3078. [DOI] [PMC free article] [PubMed] [Google Scholar]
- 55.Zaman MH, Trapani LM, Sieminski AL, MacKellar D, Gong H, Kamm RD, Wells A, Lauffenburger DA, Matsudaira P. Proc Natl Acad Sci U S A. 2006;103:10889–10894. doi: 10.1073/pnas.0604460103. [DOI] [PMC free article] [PubMed] [Google Scholar]
- 56.Zheng Y, Chen J, Craven M, Choi NW, Totorica S, Diaz-Santana A, Kermani P, Hempstead B, Fischbach-Teschl C, López JA, Stroock AD. Proc Natl Acad Sci USA. 2012 doi: 10.1073/pnas.1201240109. [DOI] [PMC free article] [PubMed] [Google Scholar]